
Research Faster.
Invest Smarter.
Most investors waste hours digging through PDFs, stitching together fragmented filings, and second-guessing the numbers. GeminIQ changes that. We use a proprietary algorithm, not third-party APIs, to extract, clean, and organize SEC filing data into one seamless, interactive timeline. With built-in metrics, market reactions, and insider activity, you get clarity, not clutter—so you can focus on making smarter investment decisions.
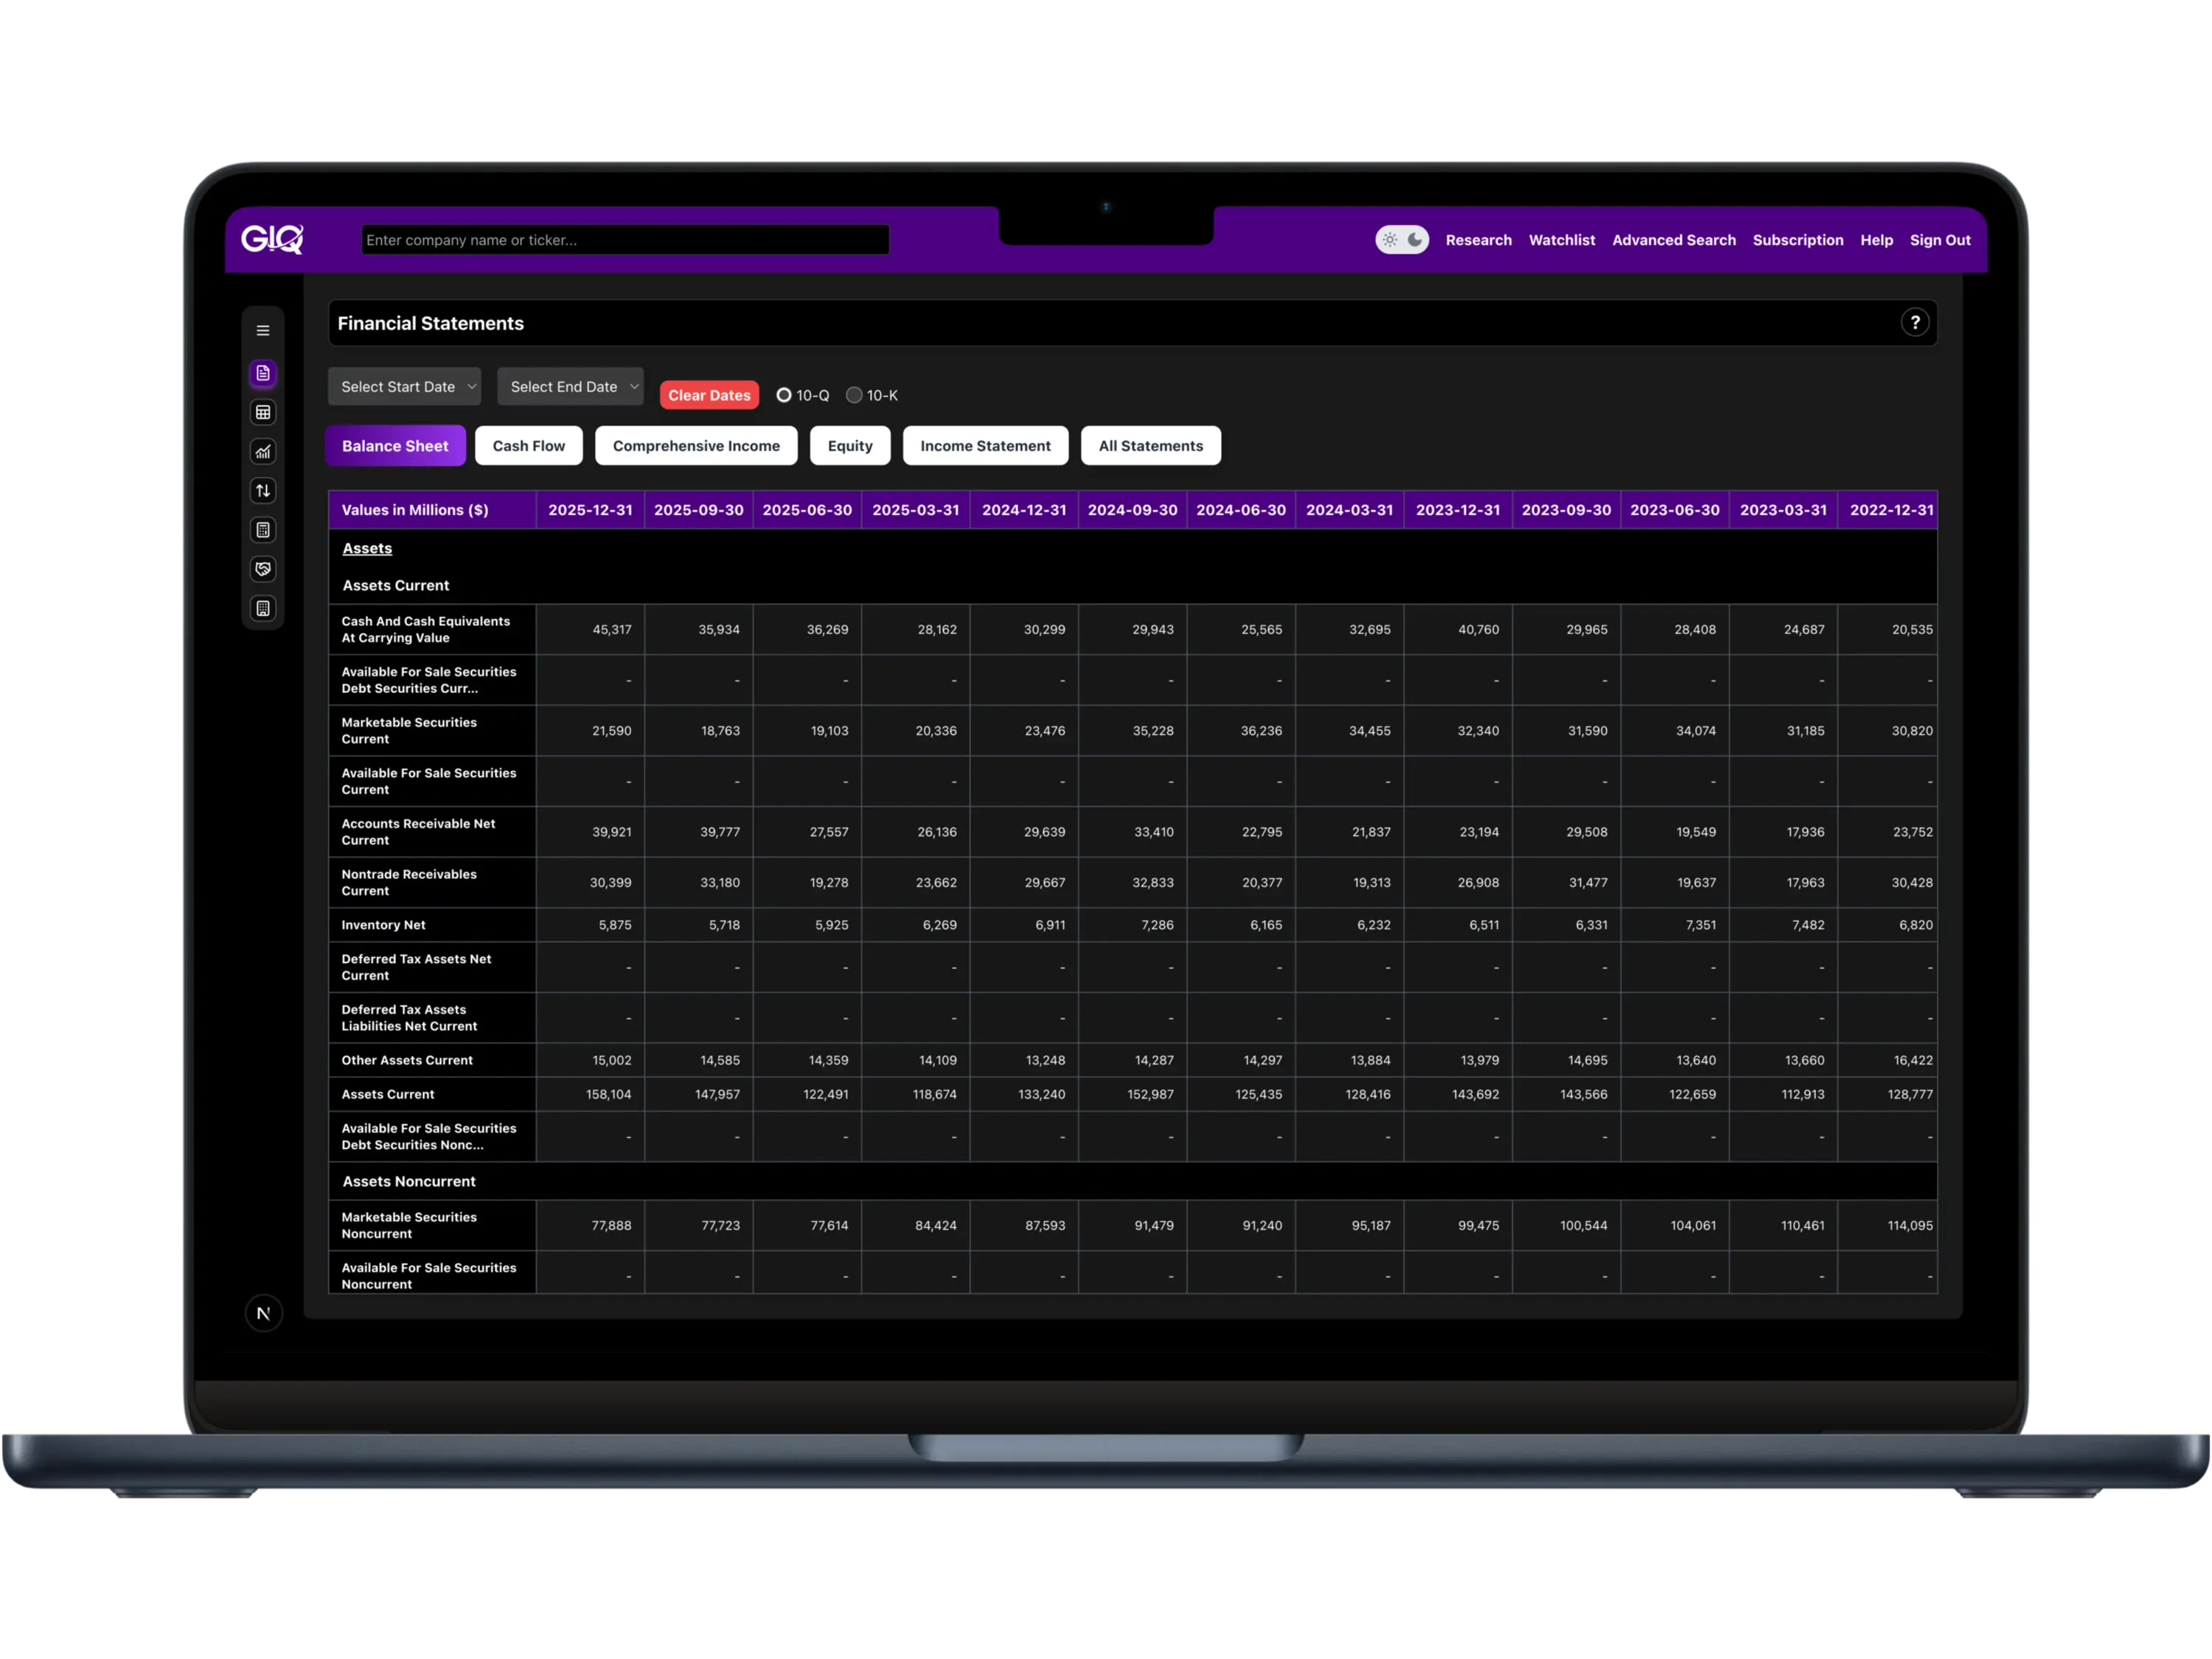
Financial Statements
View cleaned and standardized 10-Q (quarterly) and 10-K (annual) financial data, processed through our proprietary algorithms to ensure consistency, accuracy, and comparability across time periods and companies. Our process eliminates common filing inconsistencies and aligns data to industry-standard formats, ensuring you're working with reliable, ready-to-analyze numbers.
Easily switch between Balance Sheet, Income Statement, Cash Flow, Equity, and Comprehensive Income views, or see all statements in one place.
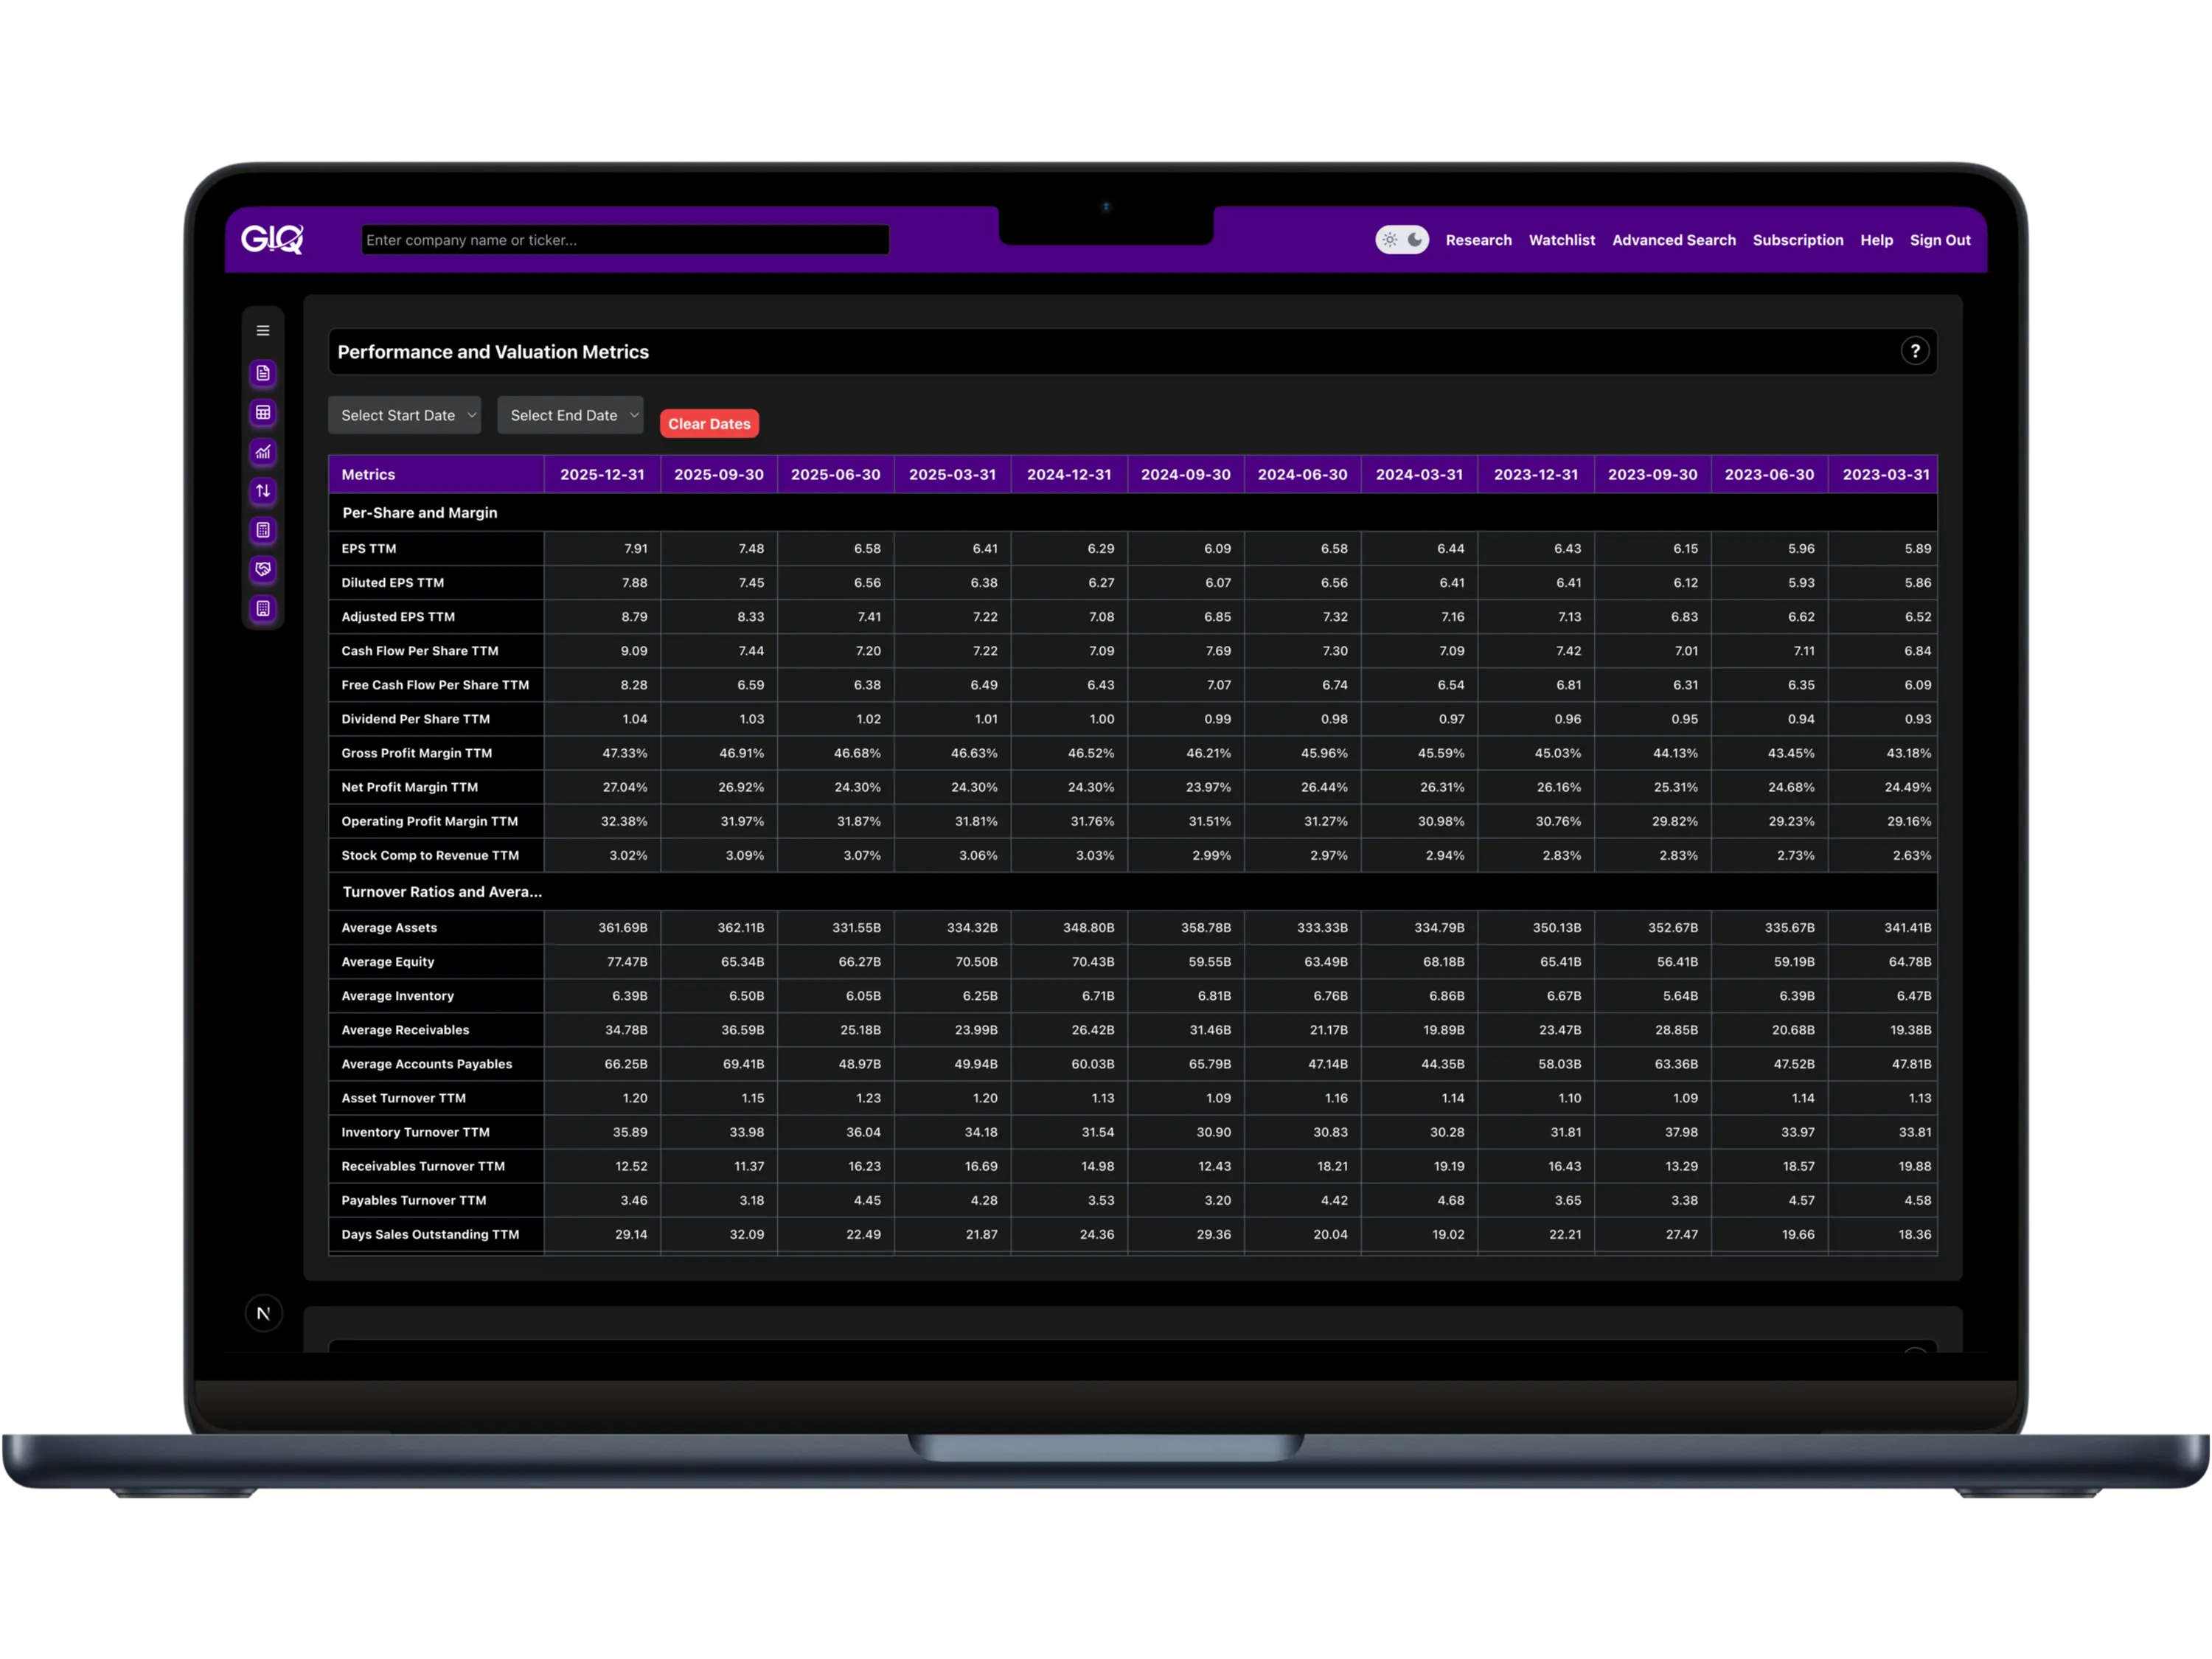
Performance and Valuation Metrics
Make apples-to-apples comparisons with industry-standard financial metrics, calculated directly from SEC filings and standardized for reliability. We give you a complete view across profitability, efficiency, growth, liquidity, leverage, returns, and valuation, so you can analyze companies with clarity and confidence. Whether you're screening for high-margin businesses, comparing ROE across peers, or spotting companies with accelerating growth, our metrics help you uncover what really matters, without the manual cleanup.
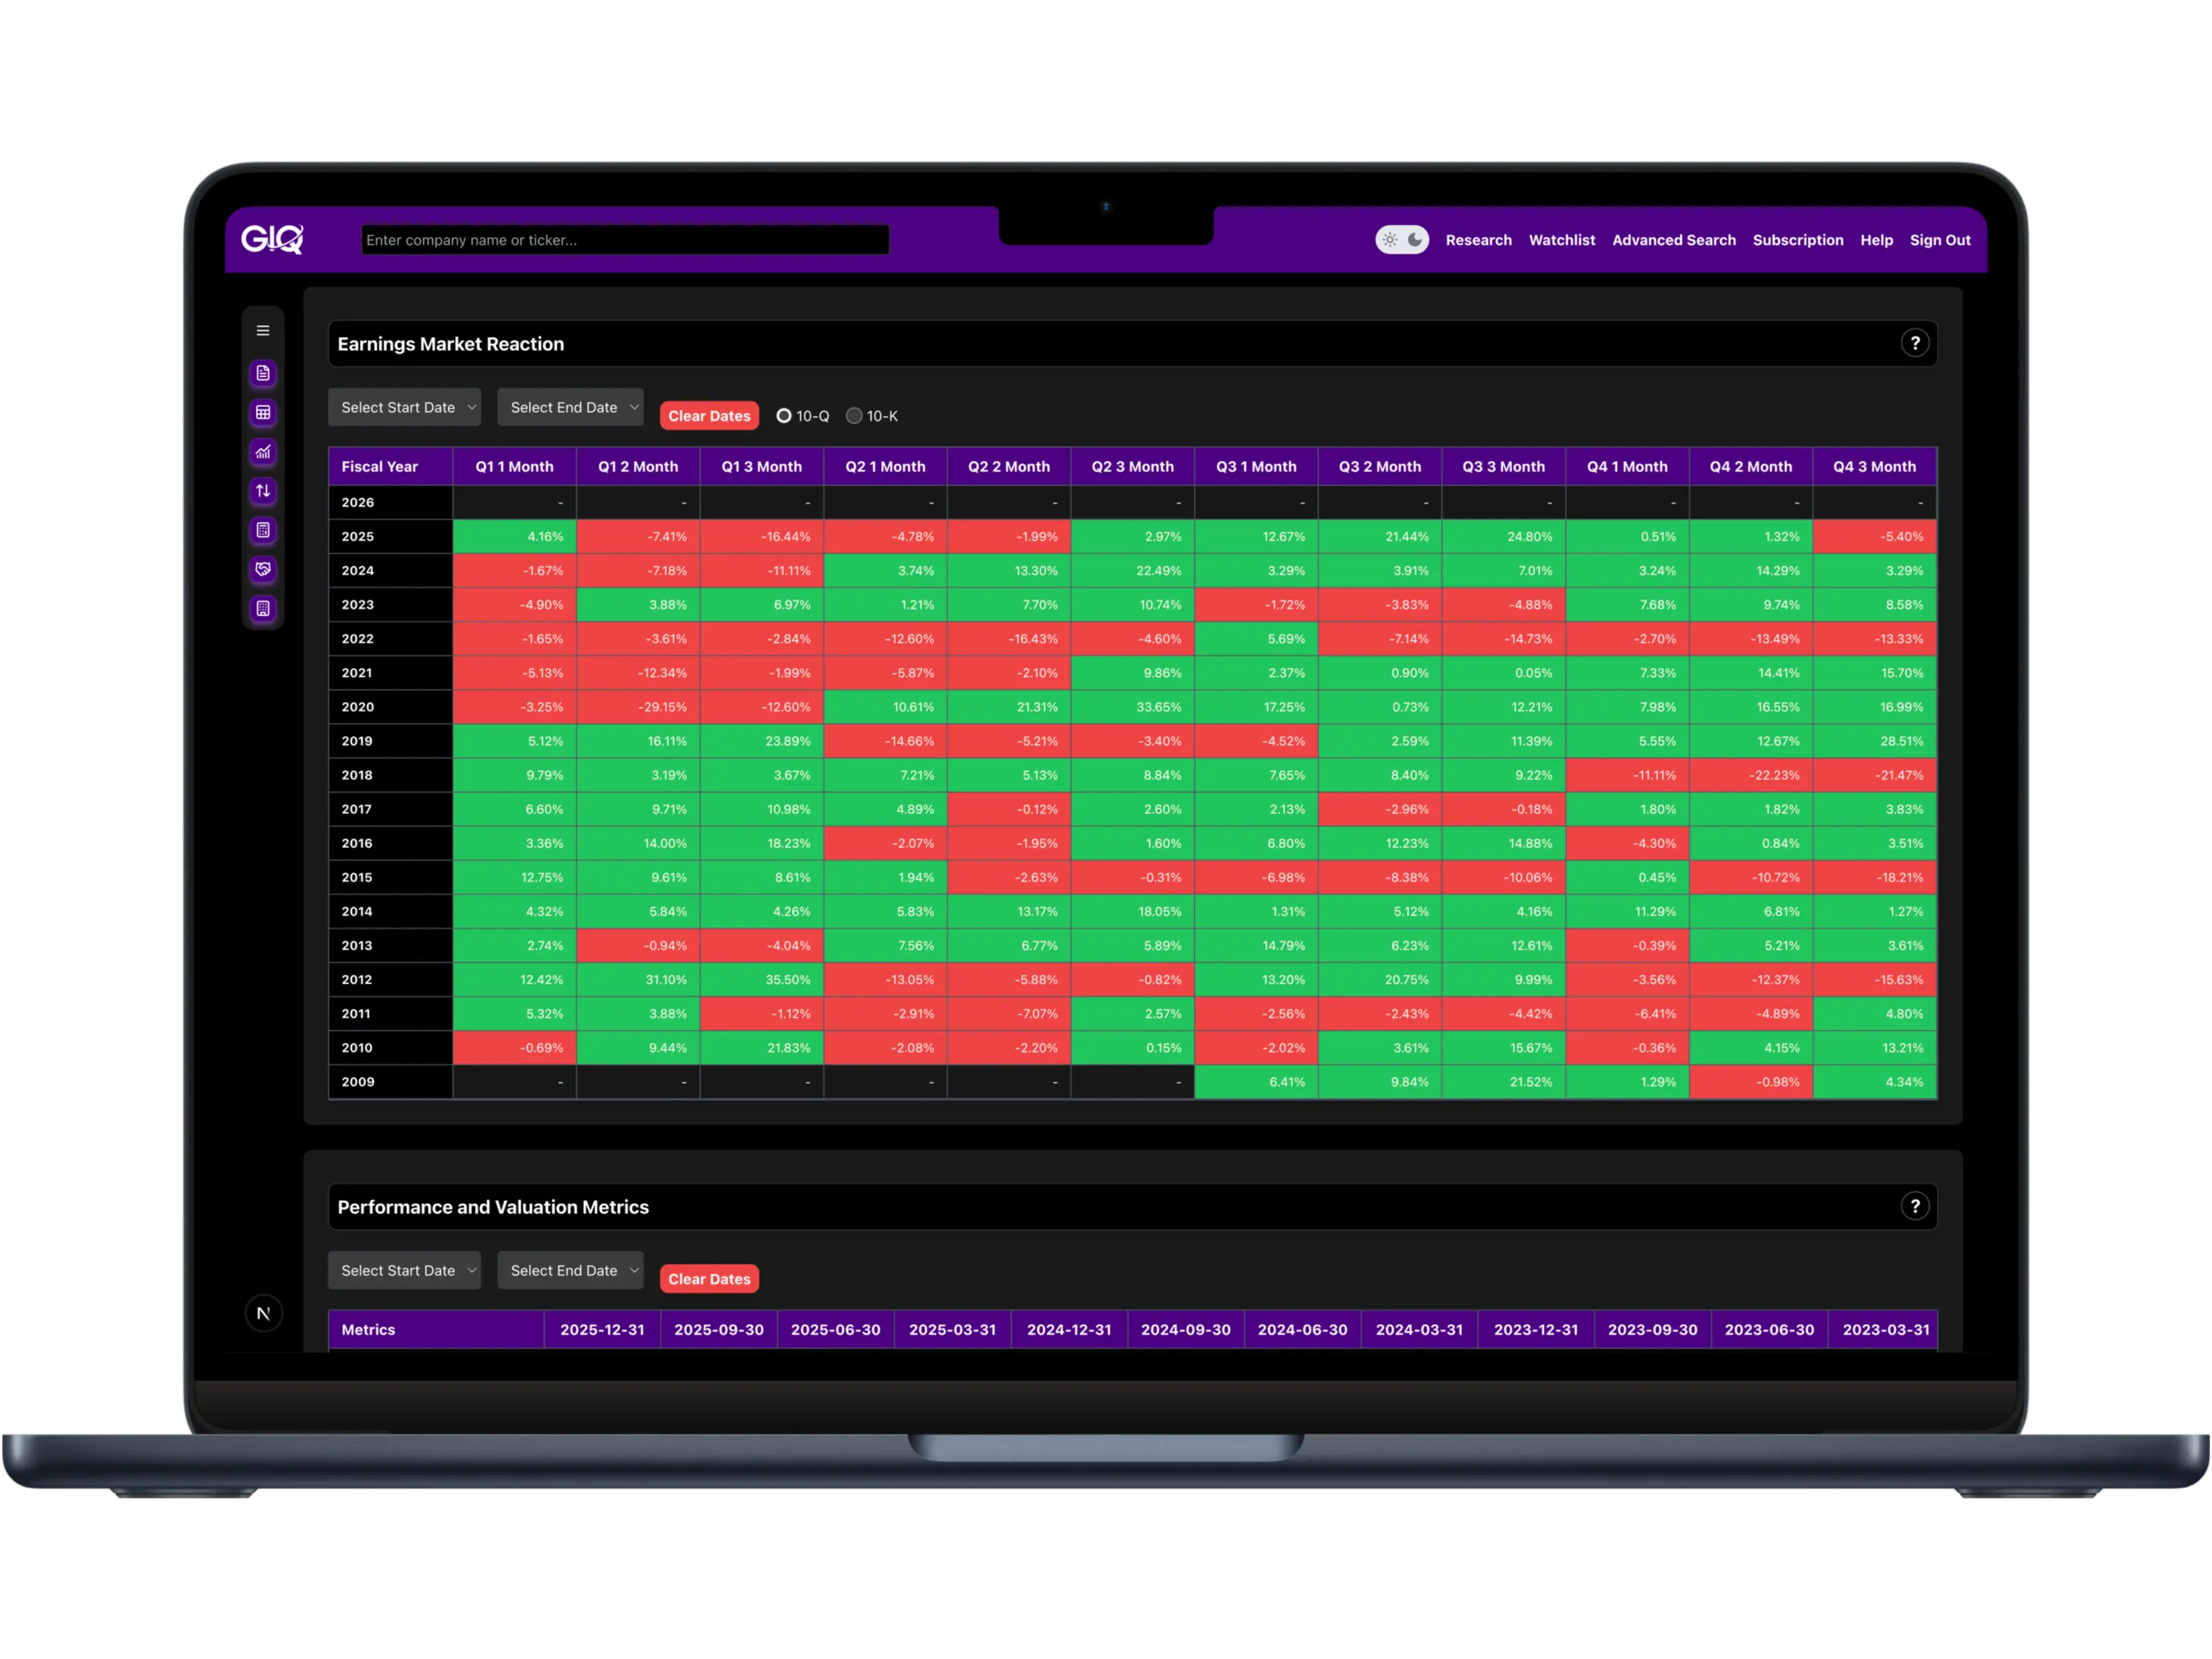
Earnings Market Reaction
For each filing, we track the stock's price performance over 1, 2, and 3 months for 10-Q's and 1 to 12 months for 10-K's following the release date. Quickly gauge how investors historically reacted to new financial information—whether the market rewarded strong results or punished weak ones—helping you spot patterns in sentiment, surprises, and post-earnings drift over time.
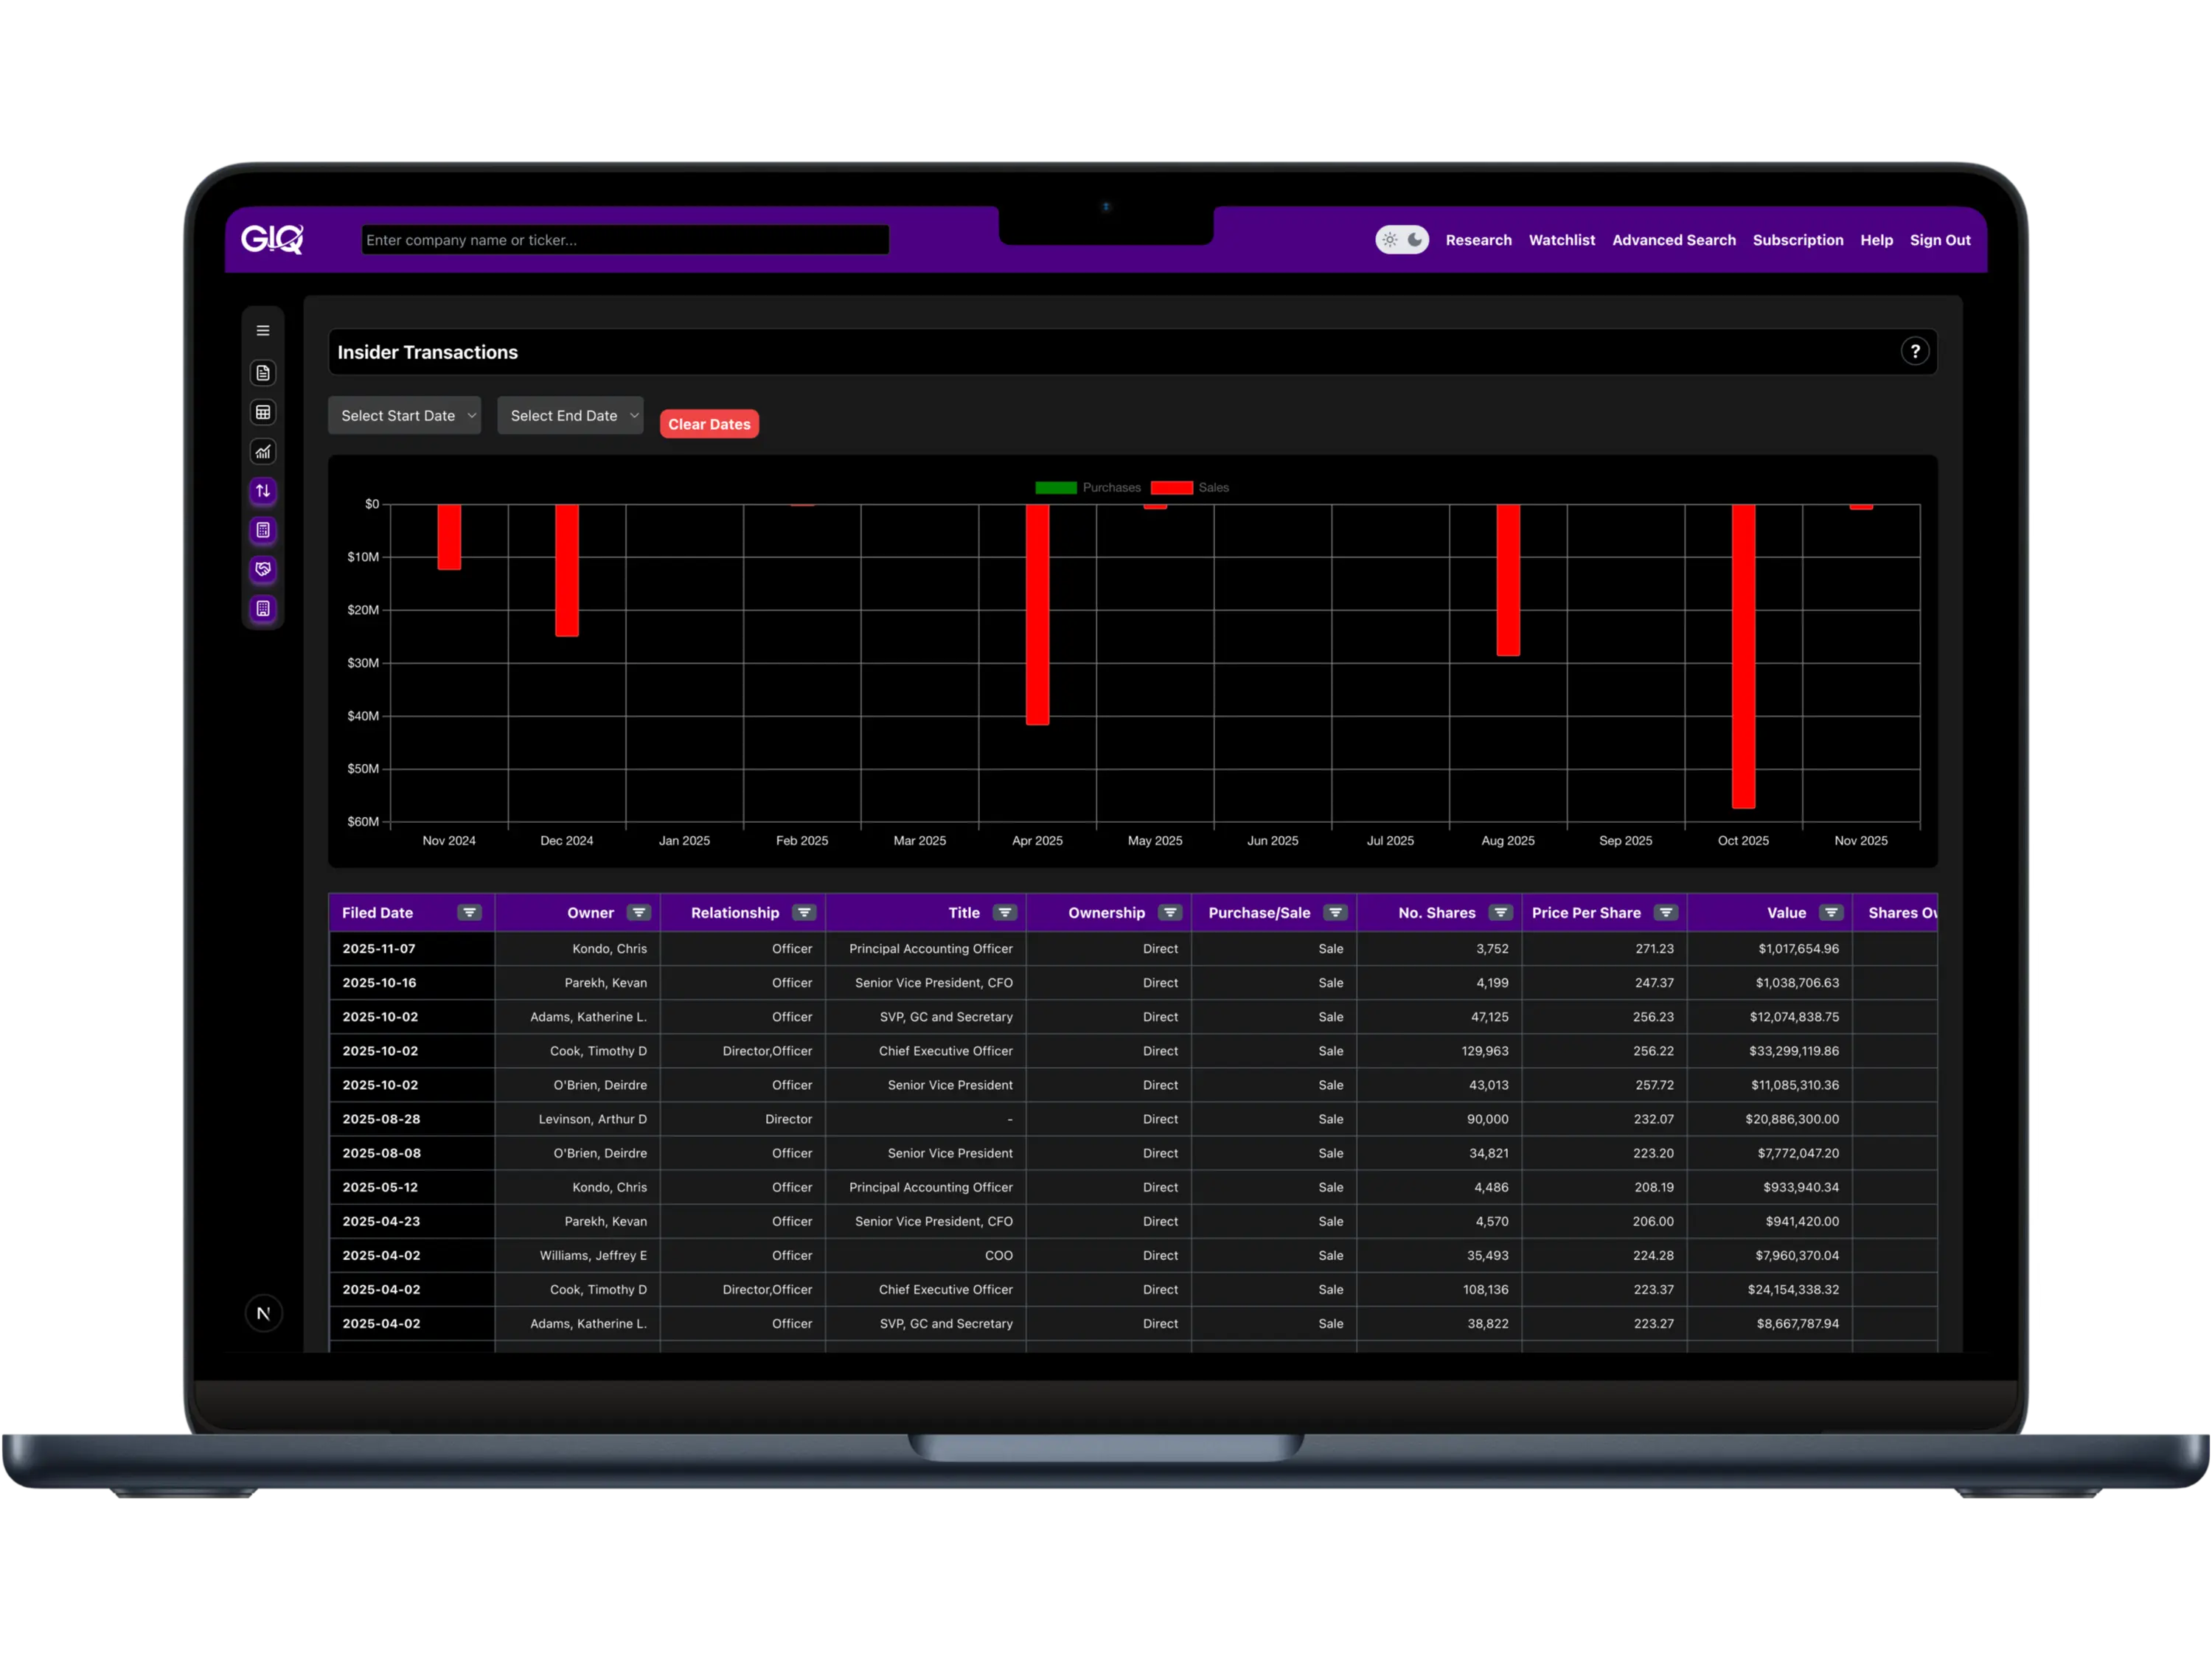
Insider Transactions
See what company insiders are doing with their own money. Track purchases and sales by executives, directors, and major shareholders to gauge internal confidence or caution. Whether you're validating a thesis or spotting red flags, insider activity adds valuable context to your fundamental analysis.
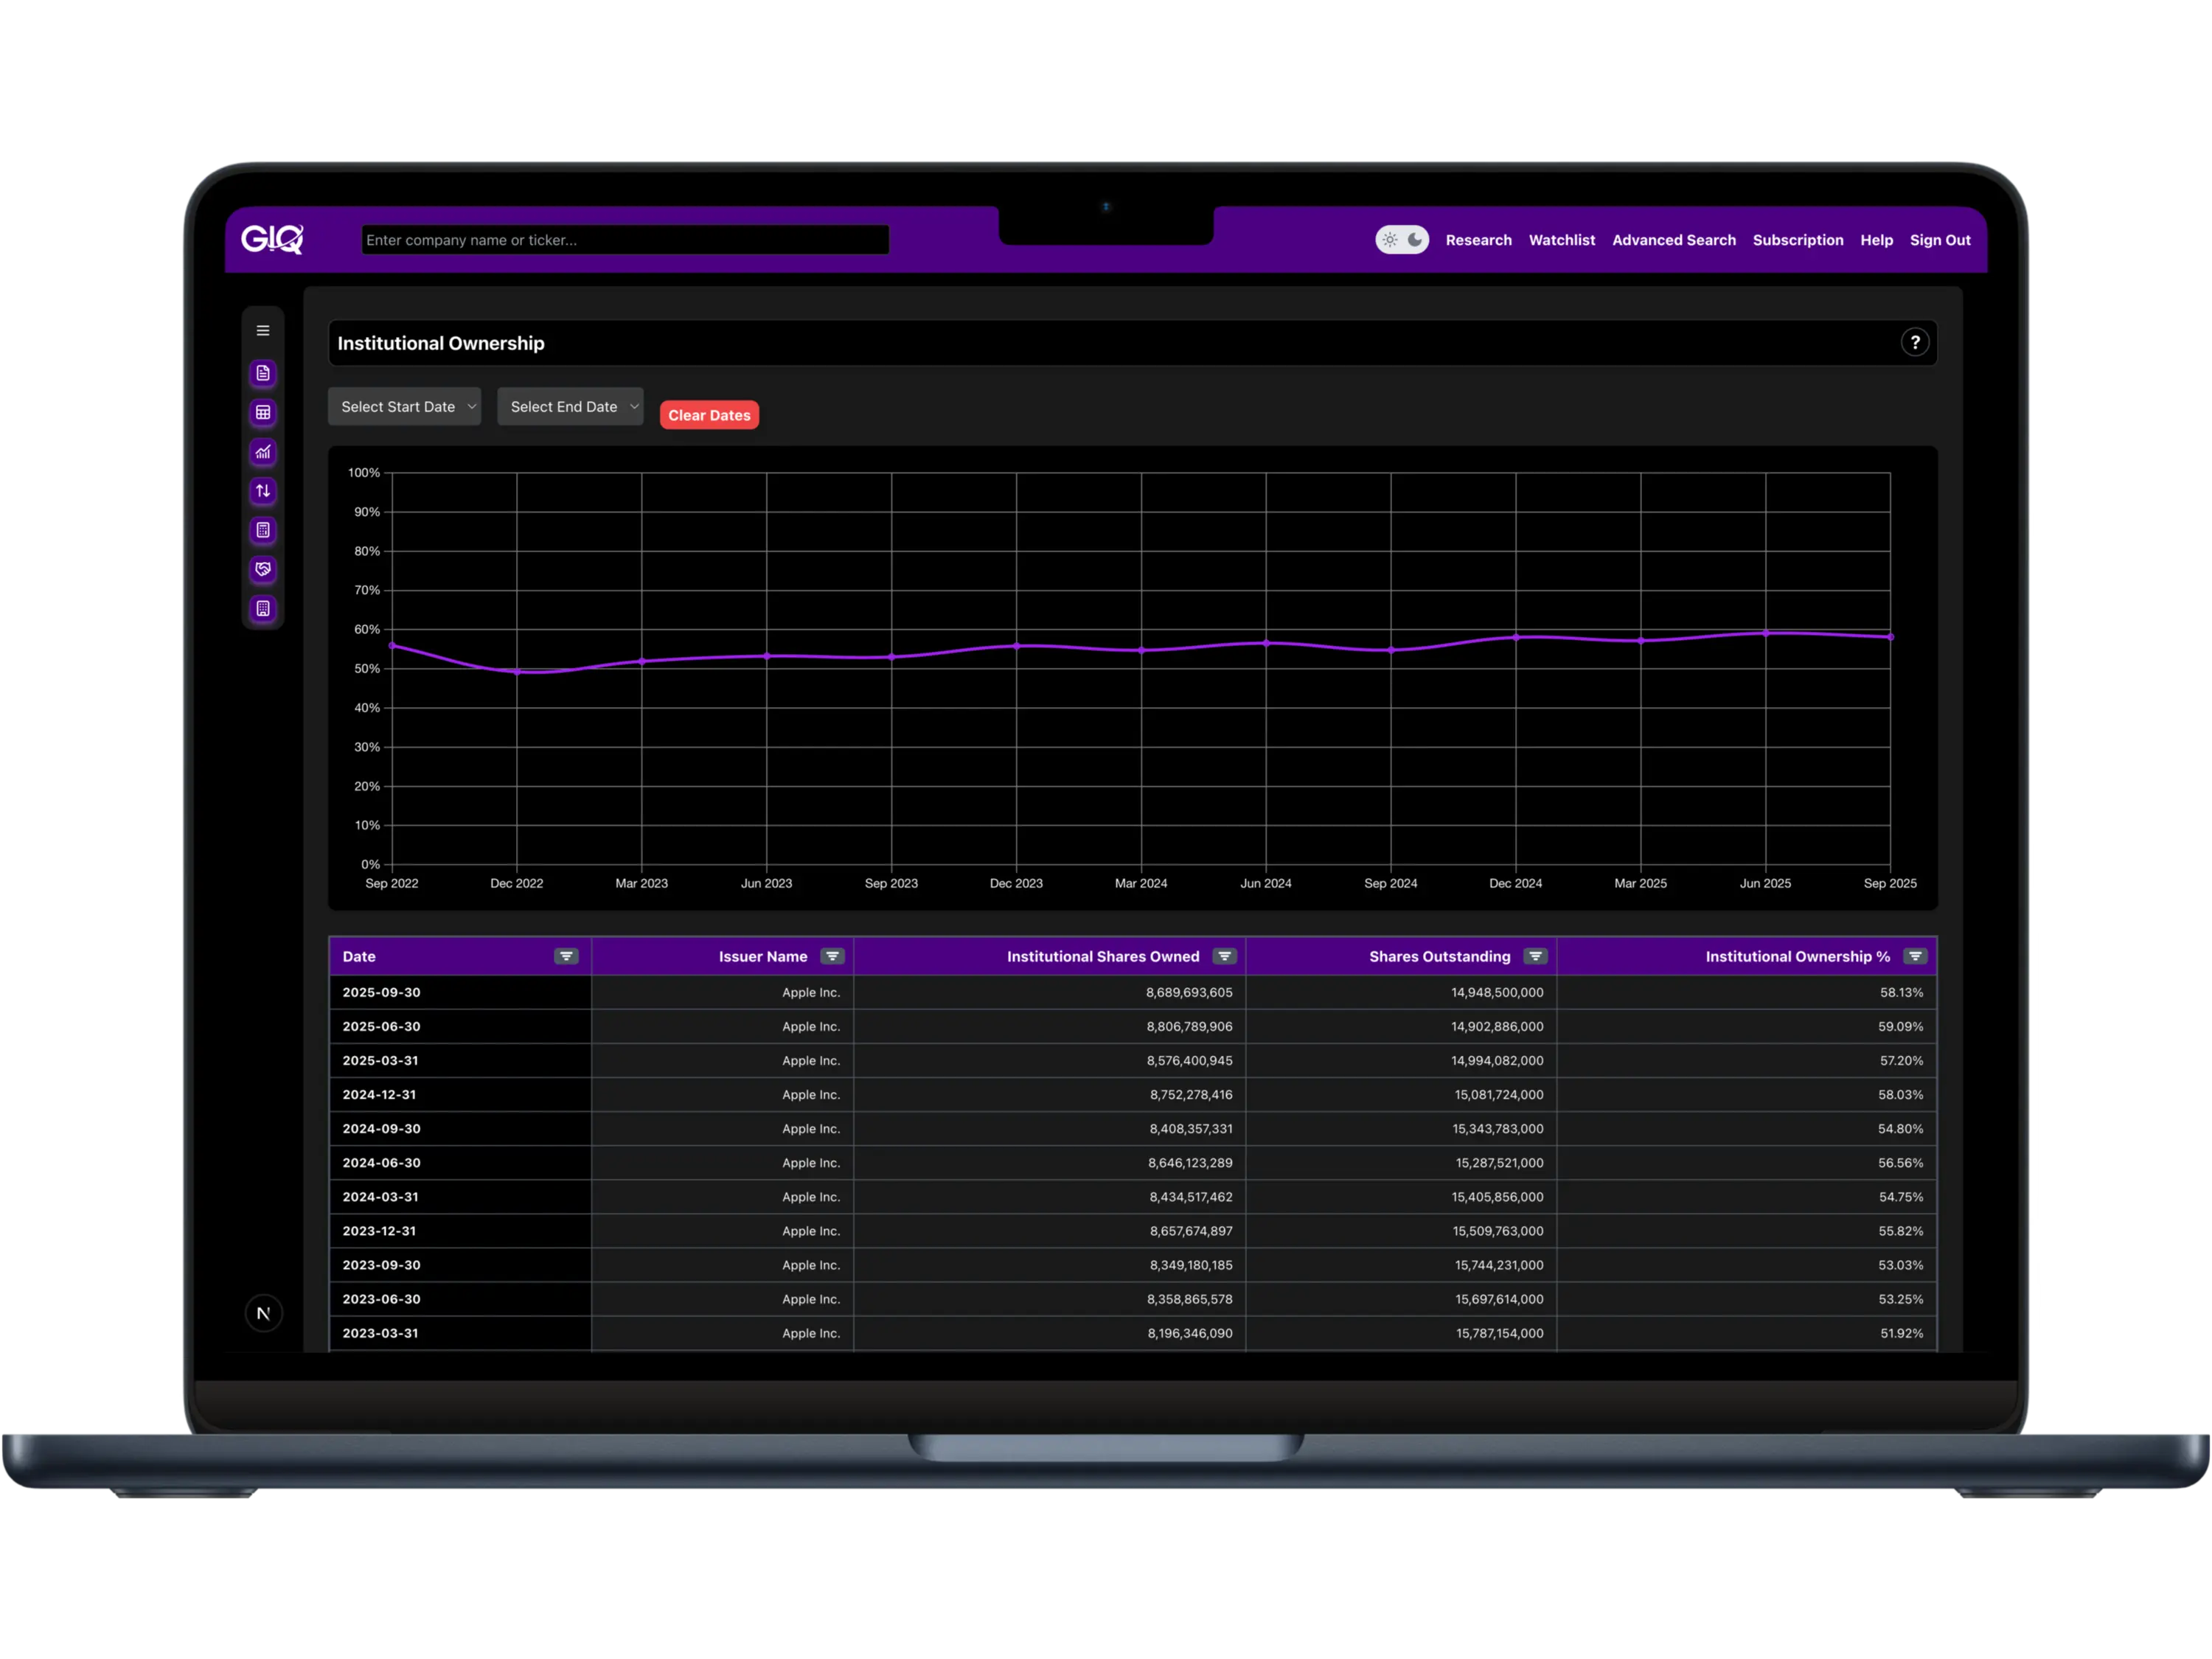
Institutional Data
Measure institutional participation at a high level. Monitor aggregate ownership percentages to understand how much professional capital is invested in a company and how that exposure evolves over time.
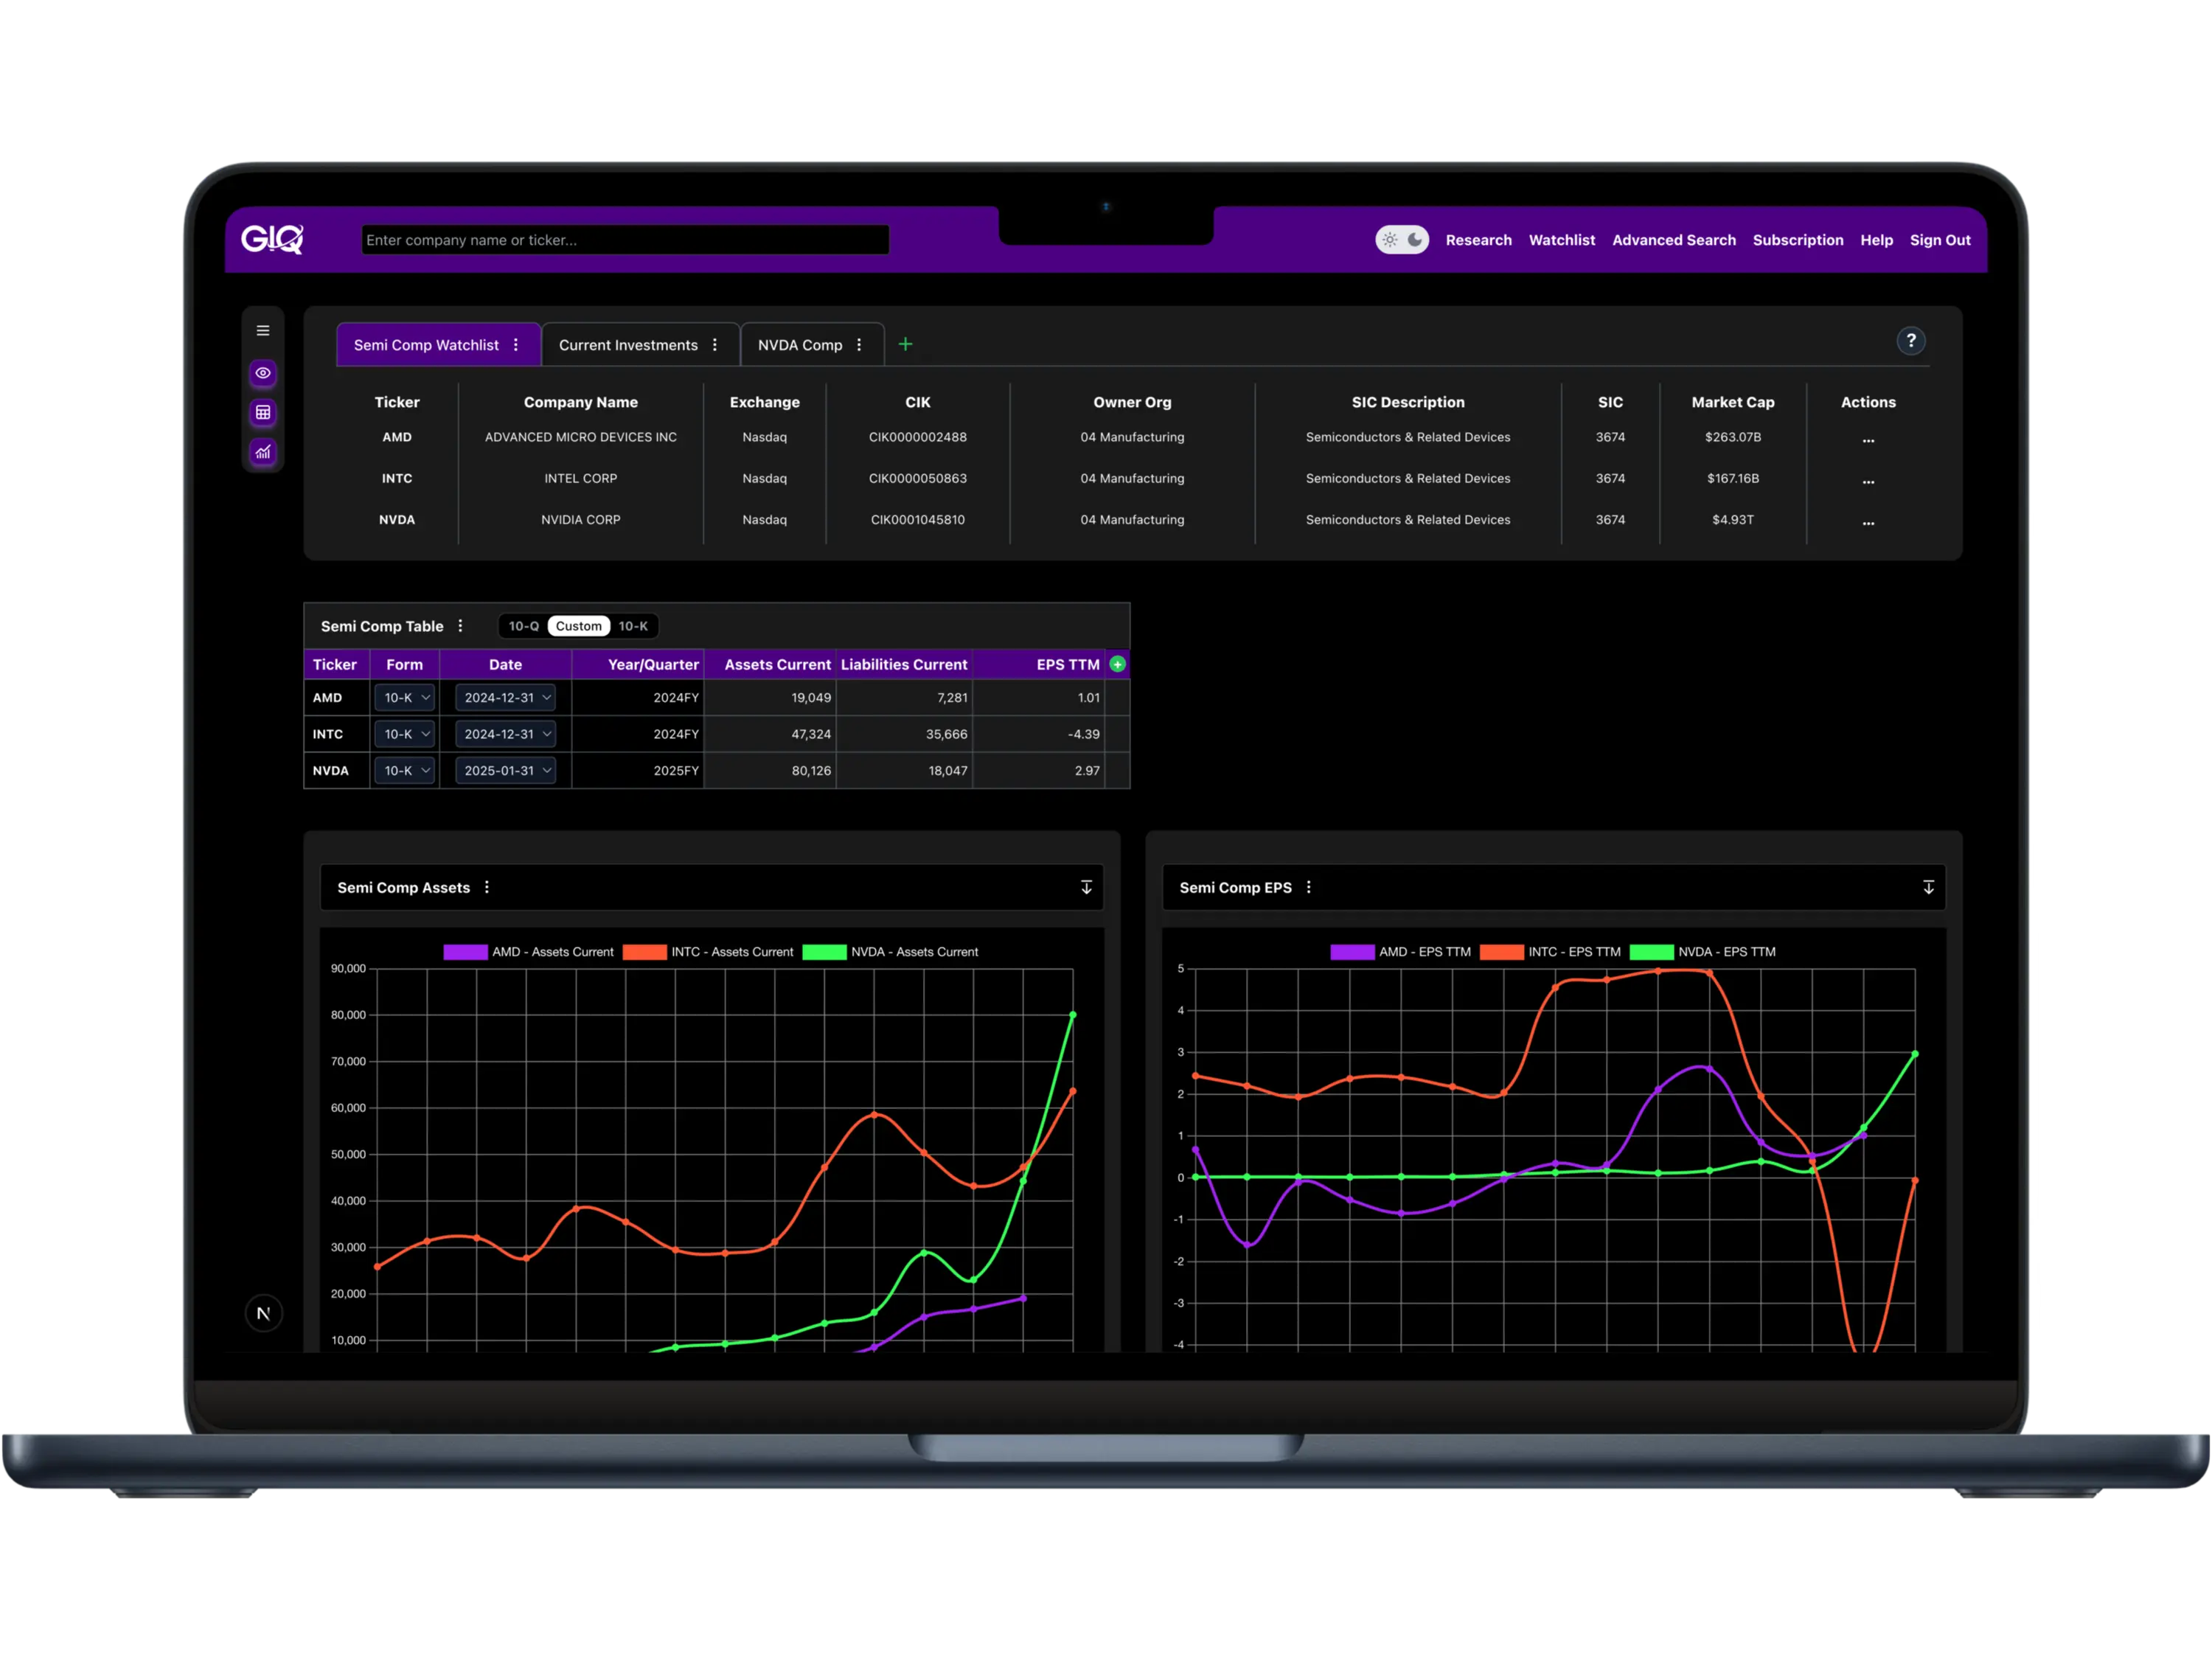
Customizable Dashboard
Visualize your strategy. Stop sifting through clutter. Build custom watchlists that track the companies you care about using only the metrics that drive your decisions. From detailed fundamental tables to comparative line and bar charts, you get a clear, noise-free view of the market. Spot trends faster, identify outliers easier, and make investment decisions with confidence.
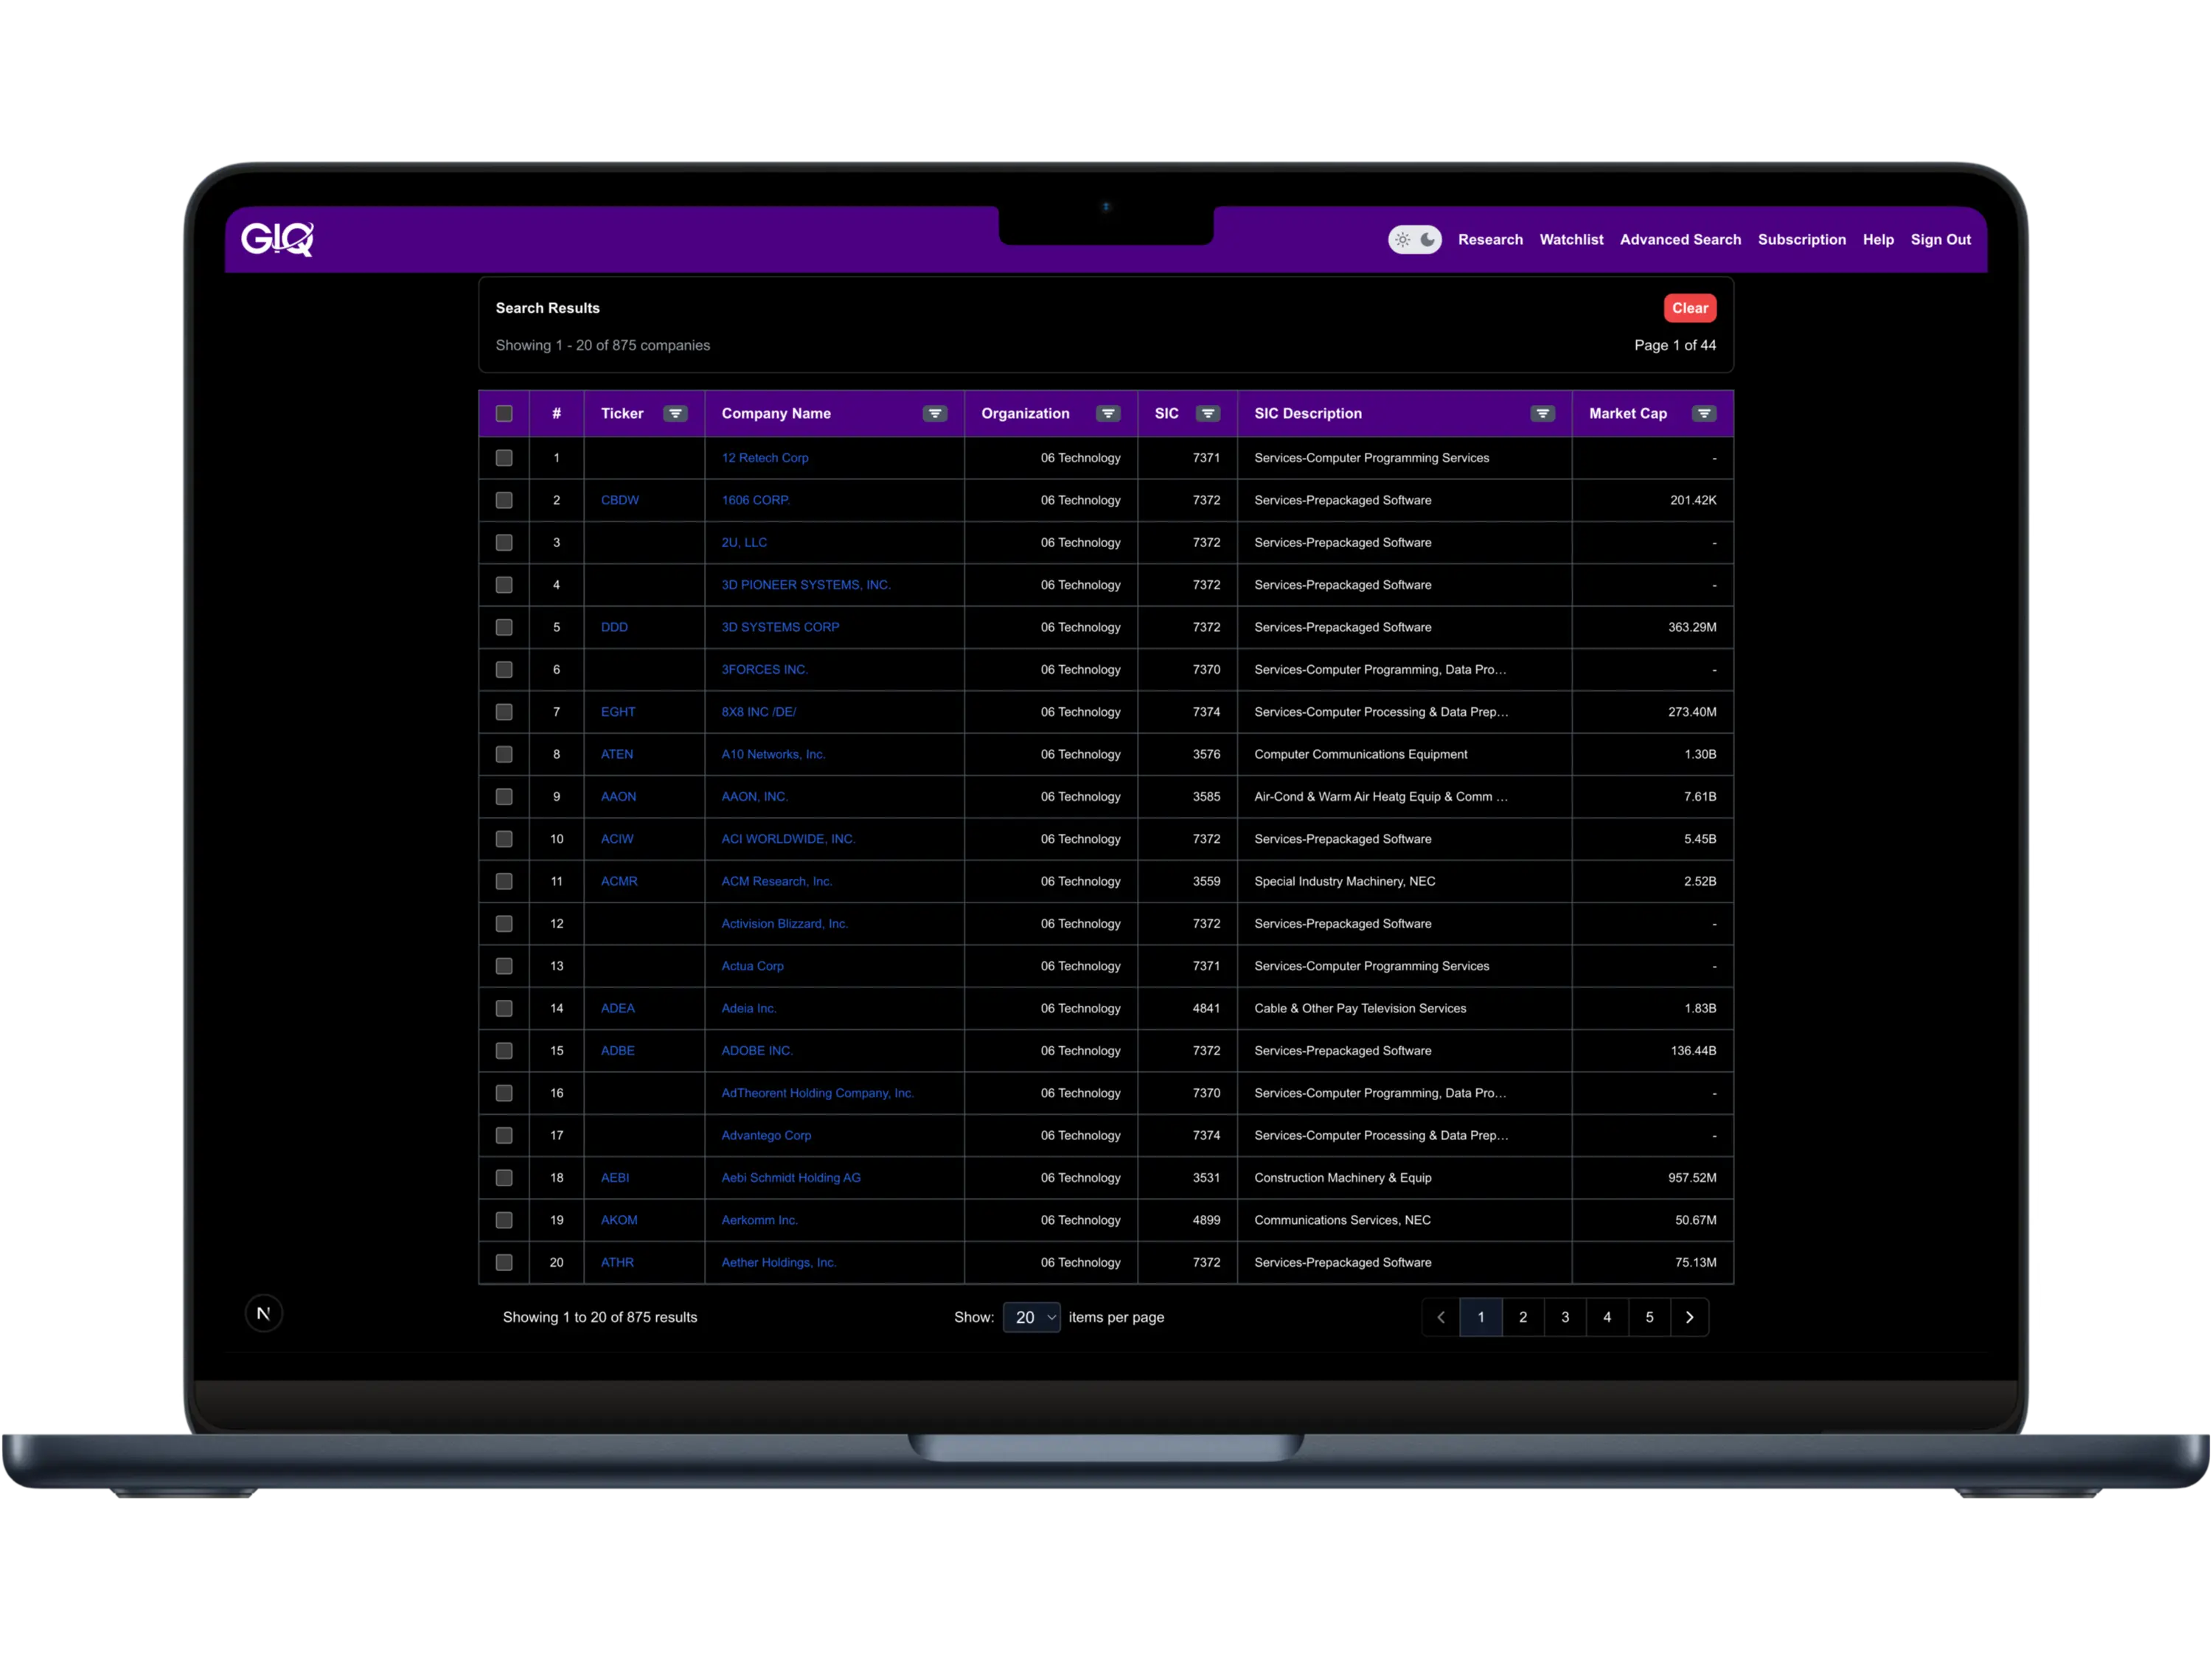
Advanced Search
Quickly find and filter companies by industry, size, or name to streamline your research. Use SIC codes, sector descriptions, or keywords to surface peer groups, then narrow the list by market cap or other financial criteria to isolate companies with similar profiles. Whether you're benchmarking performance, screening for valuation opportunities, or building comps for analysis, this tool helps you focus on the right set of companies, faster and with more precision.
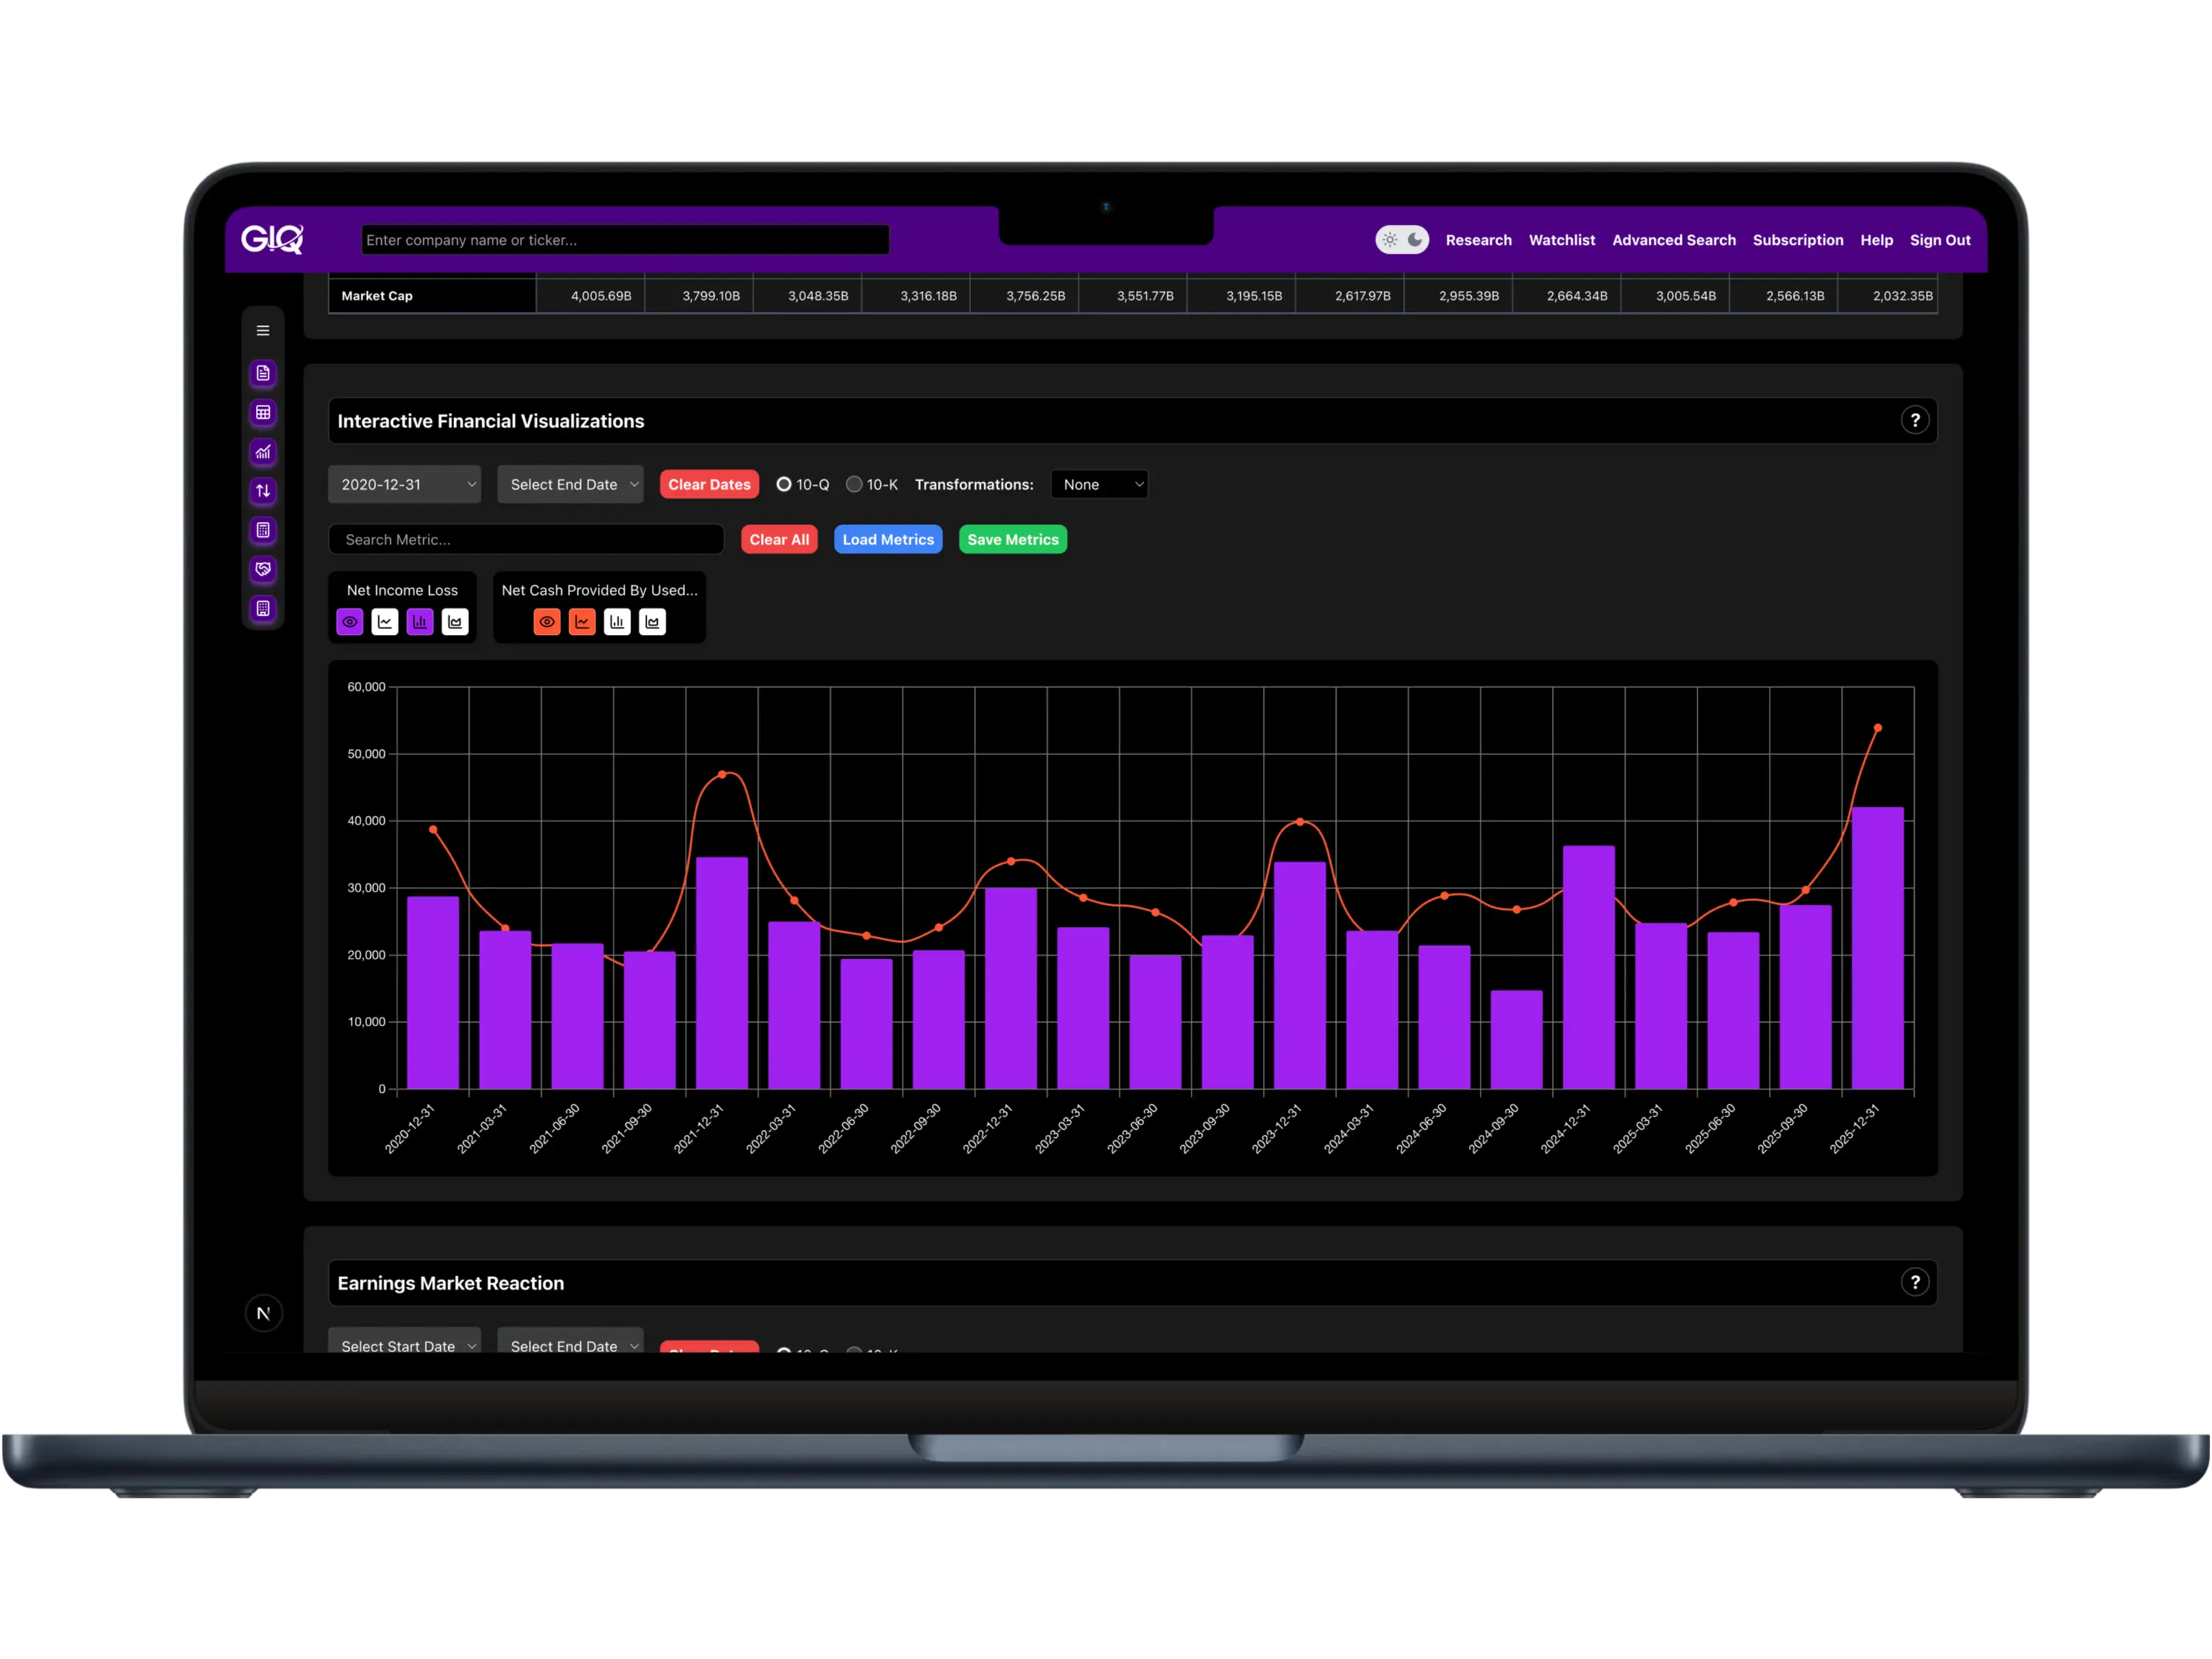
Interactive Financial Visualizer
Turn raw financial data into clear, customizable charts that reveal the story behind the numbers. Choose the metrics that matter (revenue, margins, debt, cash flow, etc.), and track how they evolve over time using line, bar, or area charts.
Apply filters, zoom in on specific time periods, and use transformations like log scale, z-score standardization, or min–max normalization to make meaningful comparisons across different values and scales. Save your favorite metric sets to reuse instantly across different companies, making your research faster, more consistent, and repeatable.
Whether you're looking for accelerating growth, margin compression, or signs of financial strength, visualizations help you spot key trends faster and make more informed investment decisions.
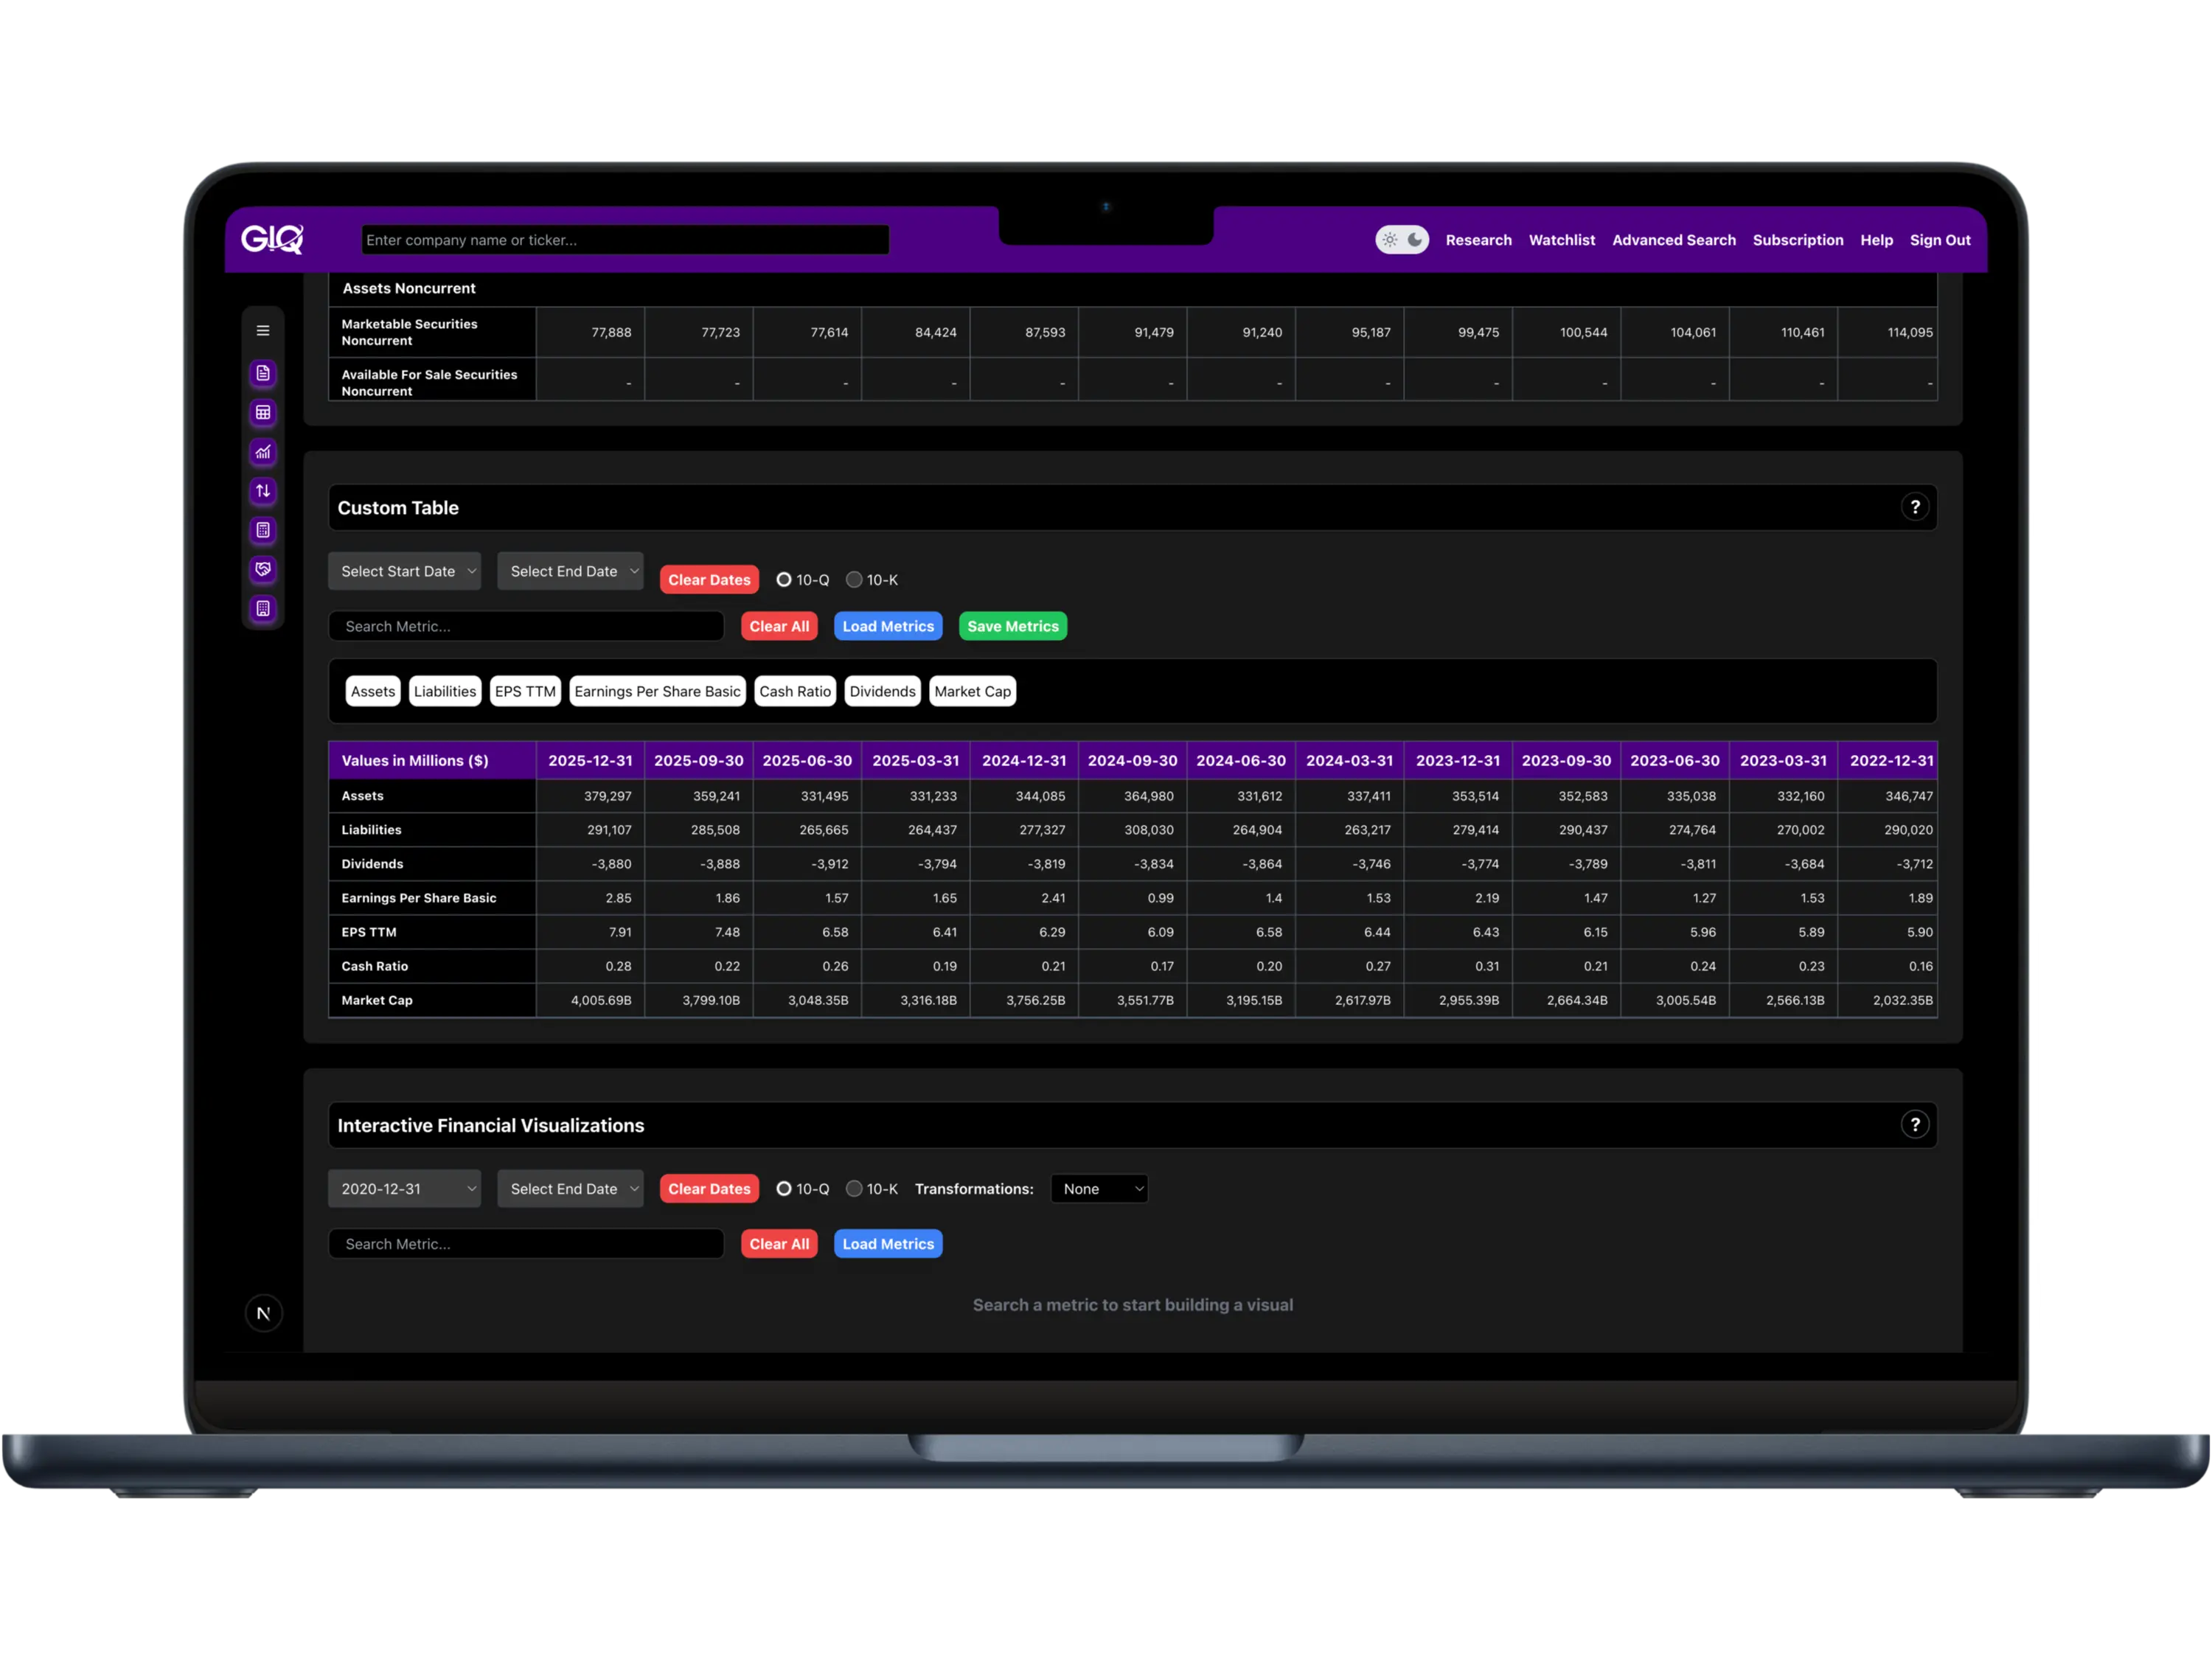
Custom Tables
Cut through the noise and focus only on the metrics that matter to you. With custom tables, you can build clean, focused views of company financials by selecting exactly which metrics to include—no clutter, no irrelevant data.
Switch between quarterly or annual filings and filter by date range to zero in on the periods that matter. Save your favorite metric sets to reuse instantly across different companies, making your research faster, more consistent, and repeatable.
Whether you're evaluating margins, cash flow, or capital structure, custom tables help you streamline your analysis and stay locked in on what matters most.
Our Mission
To save investors time, sharpen their insights, and put trustworthy SEC data at their fingertips—organized, enriched, and instantly usable.
Data You Can Trust
Every figure comes directly from SEC filings—cleaned, validated, and traceable back to its source. Our mix of algorithms and human oversight corrects known filing errors, ensuring institutional-quality accuracy for independent investors.
Our Vision
To redefine how investors research companies by making SEC filings clear, connected, and actionable.
Simple Pricing
14‑Day Free Trial Included
Founders Plan
- ★Exclusive founders rate
- ★Includes all features
- ★No ads. No distractions.
Annual Plan
- ✓Annual plan discount
- ✓Over 50 core financial metrics
- ✓Fully customizable analysis tools
- ✓Institutional ownership data
- ✓Advanced filing search
- ✓Custom watchlists
- ✓Insider transaction tracking
- ✓Interactive filing timelines
- ✓Price variance & market reaction tools
- ✓Next-day filing availability
- ✓Every number traceable to its SEC source
- ✓No ads. No distractions.
Monthly Plan
- ✓Flexible pay-as-you-go billing
- ✓Includes all features
- ✓No ads. No distractions.
FREQUENTLY ASKED QUESTIONS
Have questions?
We have answers.
GeminIQ is an investment research platform designed to help you research faster and invest smarter. We replace the need to dig through fragmented PDF filings by organizing SEC data into a seamless, interactive timeline with built-in metrics.
All of our financial data is sourced directly from official SEC filings, including 10-Q (quarterly) and 10-K (annual) reports.
Most financial tools use third-party APIs that simplify data by grouping similar metrics into broad categories. While this makes data easier to process, it strips away the specific details found in the original reports. We don't use third-party aggregators. Instead, we parse the raw 10-Q and 10-K filings directly. This allows us to present every single metric exactly as it appears in the official report, preserving the nuance that aggregated data often hides.
Unlike ROIC.ai and TIKR which rely on third-party APIs to standardize and 'group' metrics into generic categories, and going beyond BamSEC’s document-viewing capabilities, GeminIQ offers the best of both worlds. We parse 10-Q and 10-K filings directly to create a structured database of raw metrics. This means you get the auditability of a filing viewer with the analytical power of a terminal, without the data loss inherent in third-party aggregation.
We use a combination of advanced algorithms and human oversight to process the data. Our system standardizes filings to eliminate inconsistencies and aligns them to industry-standard formats. We also validate figures to correct known filing errors, providing you with institutional-quality accuracy.
We offer next-day filing availability, ensuring you have timely access to the latest financial statements and market data to make informed decisions.
We provide comprehensive historical data without the arbitrary "3-year limits, 5-year limits, etc.” found on tier pricing. Our goal is to give you the complete picture of a company's cycle, not just the recent snapshot.
GeminIQ provides over 50 calculated core financial metrics. From margins and turnover ratios, to growth rates and valuation ratios. You can easily switch between balance sheet, income statement, cash flow, equity, and comprehensive income views to see the full picture of a company's health.
Yes. This is our biggest difference. "Terminal" style sites force you to read rows of static tables. GeminIQ transforms 10-K and 10-Q data into interactive timelines. You can visualize trends, spot anomalies, and see the story behind the numbers instantly, rather than digging through endless columns of text.
Yes. Our platform includes tools for insider sentiment monitoring and institutional data monitoring, allowing you to see how company insiders and major institutions are reacting to market changes.
Absolutely. You can create customizable dashboards and watchlists, build custom tables, and use our advanced searching features to tailor the research experience to your specific strategy.
Yes, we offer a 14-day free trial with both our annual and monthly plans. This gives you full access to test our timelines, metrics, and search tools before you commit.
Both plans include all features, such as interactive timelines, price variance tools, and over 50 financial metrics, with no ads. The annual plan offers a discounted rate compared to the flexible pay-as-you-go monthly plan.
Yes. Whether you are on a monthly or annual plan, you can manage your subscription settings directly through your account.