Research Faster.
Invest Smarter.
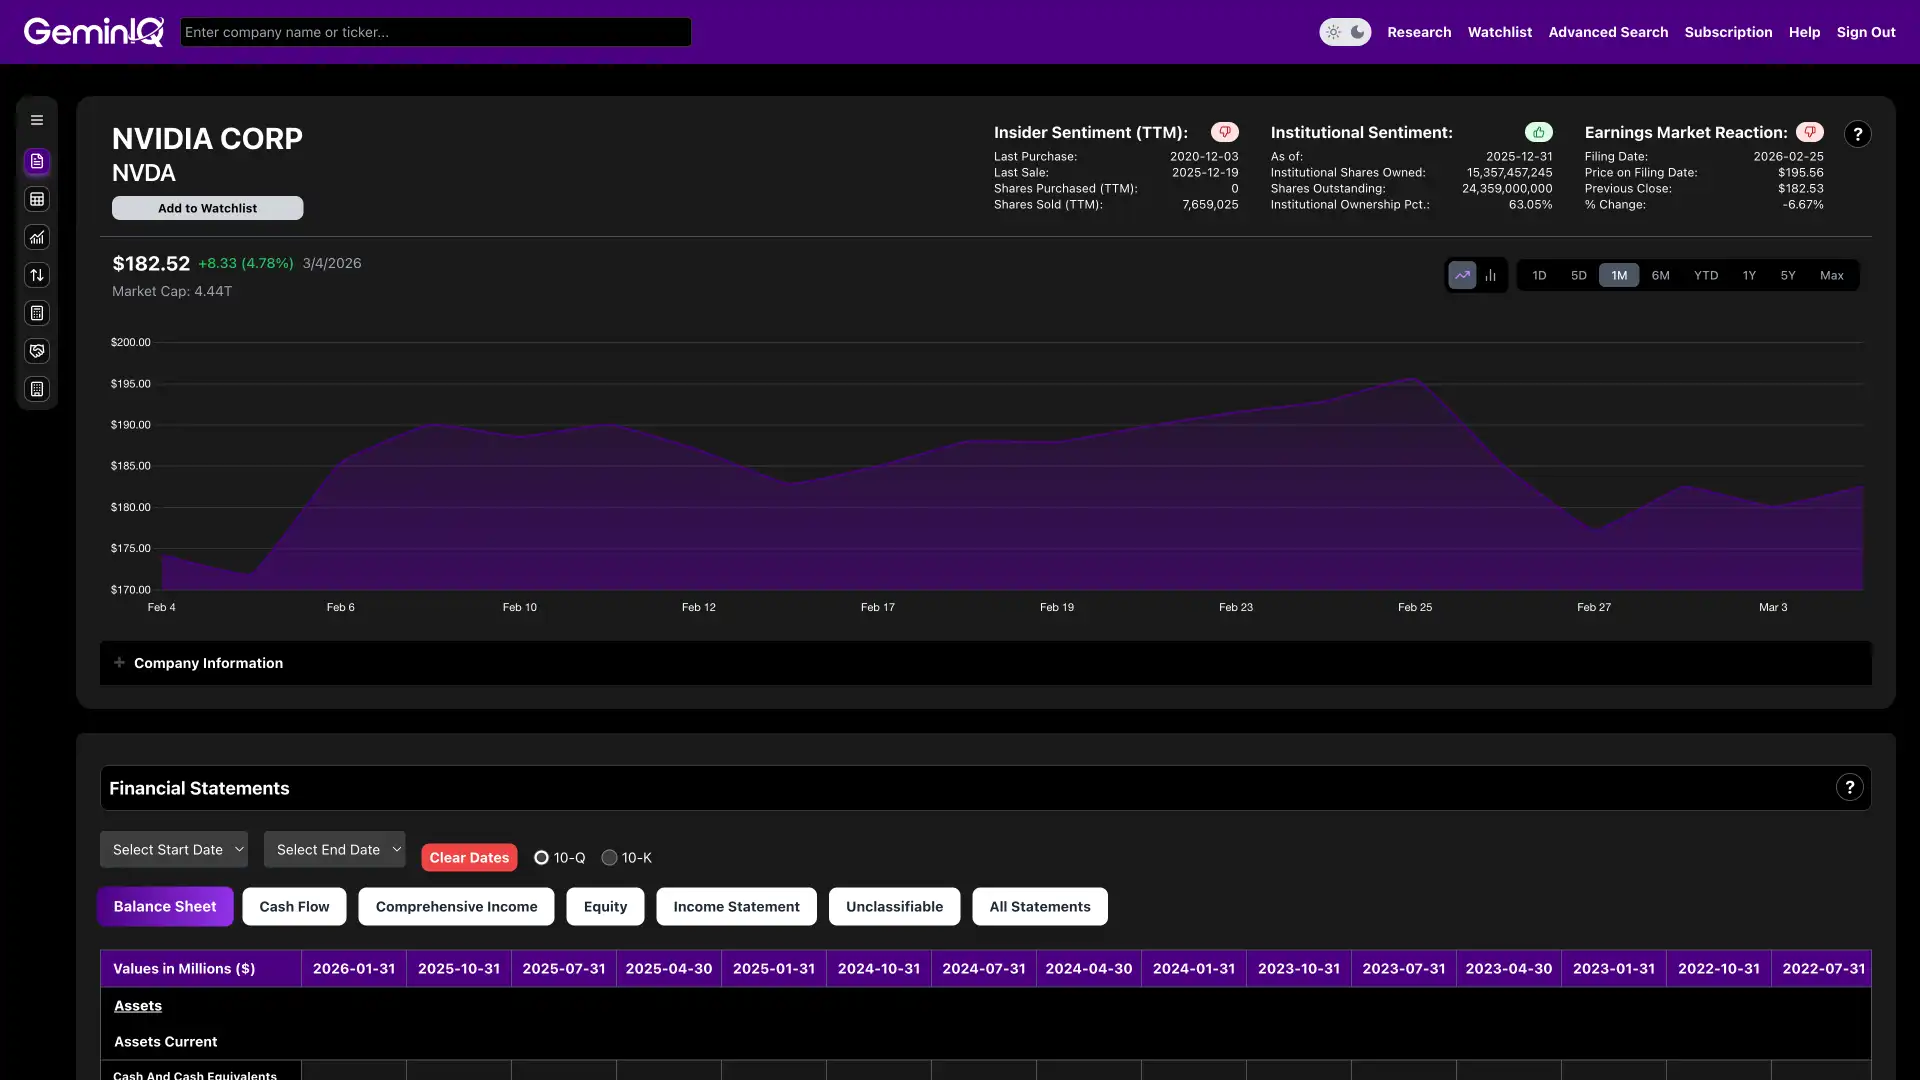
Get institutional-grade financial data delivered straight to your screen without relying on third-party APIs. We extract raw SEC filings and structure them into an interactive timeline with built-in metrics to help you spot opportunities faster.
Institutional-Grade Analysis Tools For Everyone
Invest with Confidence and Precision
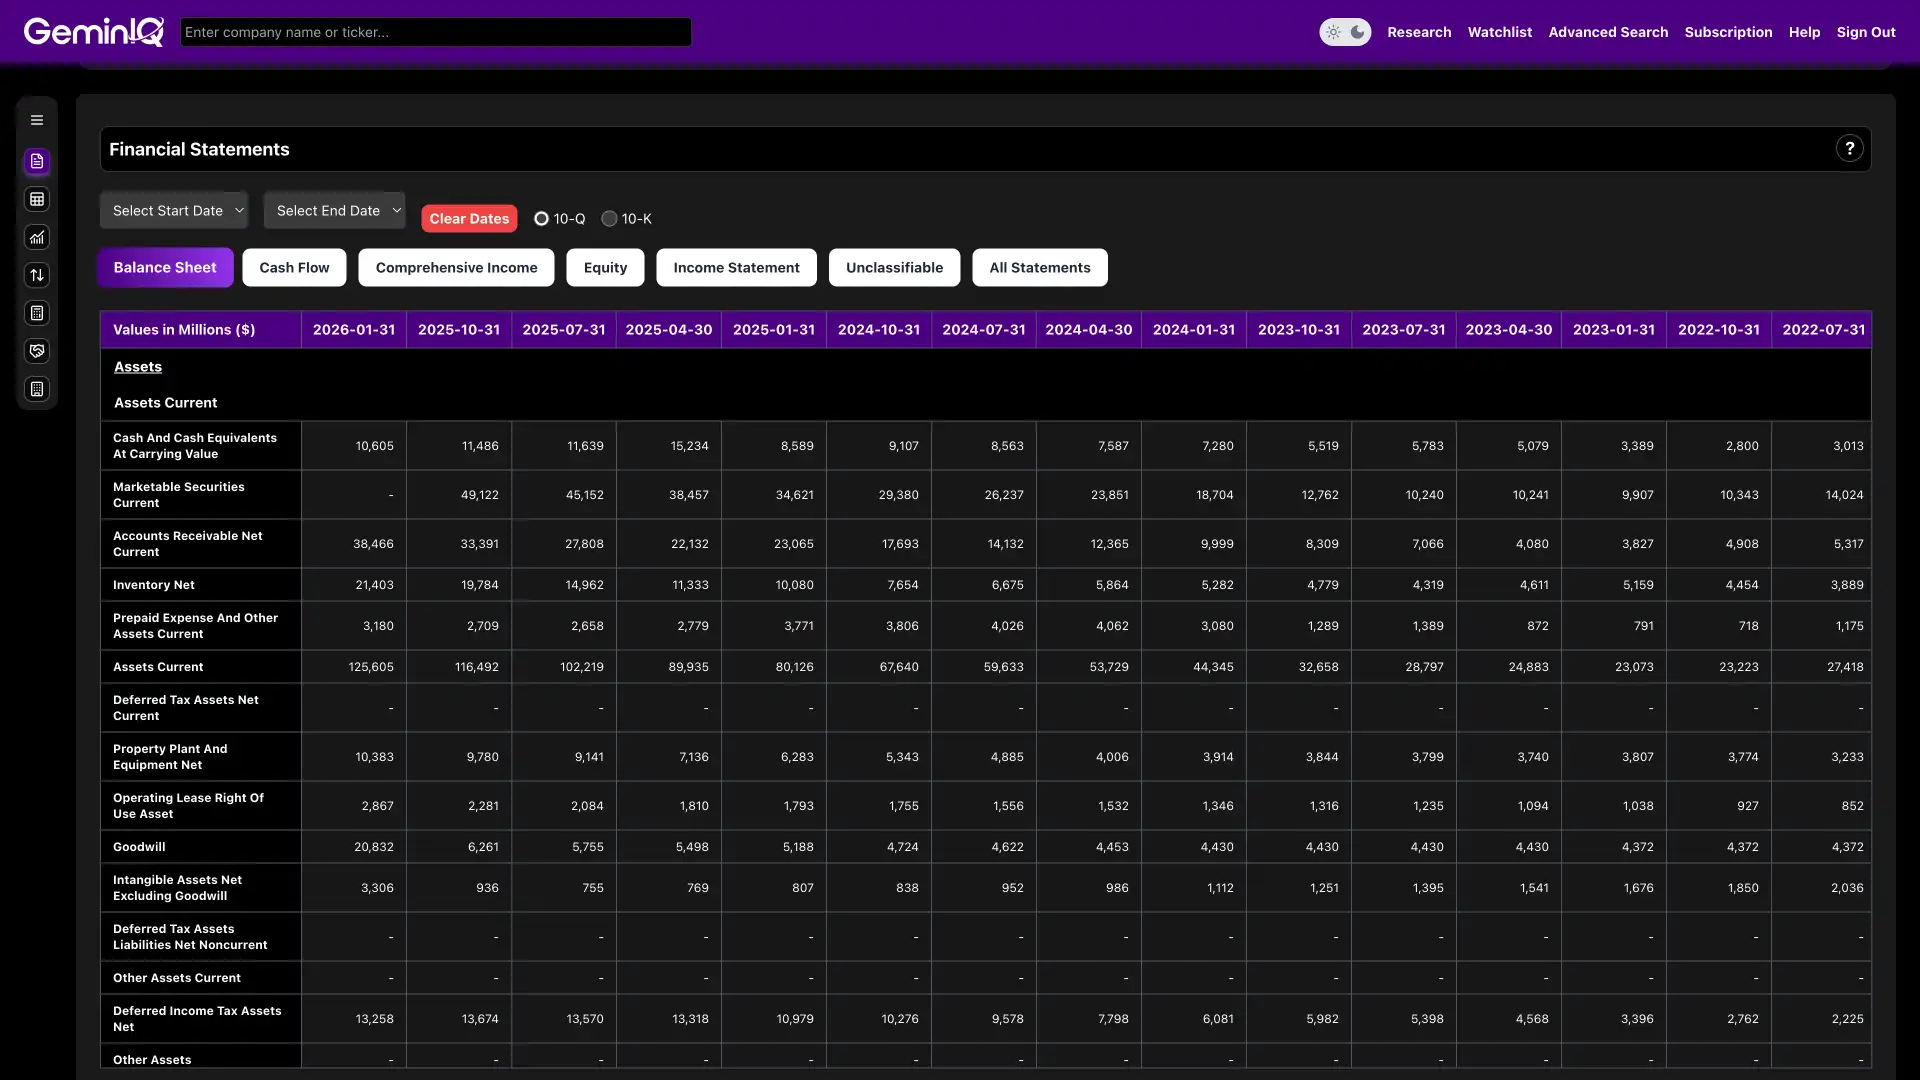
Financial Statements
View cleaned and standardized 10-Q (quarterly) and 10-K (annual) financial data, processed through our proprietary algorithms to ensure consistency, accuracy, and comparability across time periods and companies. Our process eliminates common filing inconsistencies and aligns data to industry-standard formats, ensuring you're working with reliable, ready-to-analyze numbers.
Easily switch between Balance Sheet, Income Statement, Cash Flow, Equity, and Comprehensive Income views, or see all statements in one place.
Our Mission
To save investors time, sharpen their insights, and put trustworthy SEC data at their fingertips—organized, enriched, and instantly usable.
Data You Can Trust
Every figure comes directly from SEC filings—cleaned, validated, and traceable back to its source. Our mix of algorithms and human oversight corrects known filing errors, ensuring institutional-quality accuracy for independent investors.
Our Vision
To redefine how investors research companies by making SEC filings clear, connected, and actionable.
FREQUENTLY ASKED QUESTIONS
Have questions?
We have answers.
GeminIQ is an investment research platform designed to help you research faster and invest smarter. We replace the need to dig through fragmented PDF filings by organizing SEC data into a seamless, interactive timeline with built-in metrics.
All of our financial data is sourced directly from official SEC filings, including 10-Q (quarterly) and 10-K (annual) reports.
Most financial tools use third-party APIs that simplify data by grouping similar metrics into broad categories. While this makes data easier to process, it strips away the specific details found in the original reports. We don't use third-party aggregators. Instead, we parse the raw 10-Q and 10-K filings directly. This allows us to present every single metric exactly as it appears in the official report, preserving the nuance that aggregated data often hides.
Unlike ROIC.ai and TIKR which rely on third-party APIs to standardize and 'group' metrics into generic categories, and going beyond BamSEC’s document-viewing capabilities, GeminIQ offers the best of both worlds. We parse 10-Q and 10-K filings directly to create a structured database of raw metrics. This means you get the auditability of a filing viewer with the analytical power of a terminal, without the data loss inherent in third-party aggregation.
We use a combination of advanced algorithms and human oversight to process the data. Our system standardizes filings to eliminate inconsistencies and aligns them to industry-standard formats. We also validate figures to correct known filing errors, providing you with institutional-quality accuracy.
We offer next-day filing availability, ensuring you have timely access to the latest financial statements and market data to make informed decisions.
We provide comprehensive historical data without the arbitrary "3-year limits, 5-year limits, etc.” found on tier pricing. Our goal is to give you the complete picture of a company's cycle, not just the recent snapshot.
GeminIQ provides over 50 calculated core financial metrics. From margins and turnover ratios, to growth rates and valuation ratios. You can easily switch between balance sheet, income statement, cash flow, equity, and comprehensive income views to see the full picture of a company's health.
Yes. This is our biggest difference. "Terminal" style sites force you to read rows of static tables. GeminIQ transforms 10-K and 10-Q data into interactive timelines. You can visualize trends, spot anomalies, and see the story behind the numbers instantly, rather than digging through endless columns of text.
Yes. Our platform includes tools for insider sentiment monitoring and institutional data monitoring, allowing you to see how company insiders and major institutions are reacting to market changes.
Absolutely. You can create customizable dashboards and watchlists, build custom tables, and use our advanced searching features to tailor the research experience to your specific strategy.
Yes, we offer a 7-day free trial with both our annual and monthly plans. This gives you full access to test our timelines, metrics, and search tools before you commit.
Both plans include all features, such as interactive timelines, price variance tools, and over 50 financial metrics, with no ads. The annual plan offers a discounted rate compared to the flexible pay-as-you-go monthly plan.
Yes. Whether you are on a monthly or annual plan, you can manage your subscription settings directly through your account.