Apple Stock Analysis (2026): Is It Still a Value Play or a Yield Trap?
By Chad Hartman
Published February 19, 2026 · Last updated June 14, 2026
Is Apple overvalued at 34x? Most analysts are arguing over iPhone units in China, but value investors look at the Capital Machine, not the Gadget. I used GeminIQ to audit Apple's "Capital Efficiency" in their latest 10-Q (filed Jan 30, 2026). Here is the fundamental truth behind the ticker.
Standardized Financials vs. Aggregator Lag
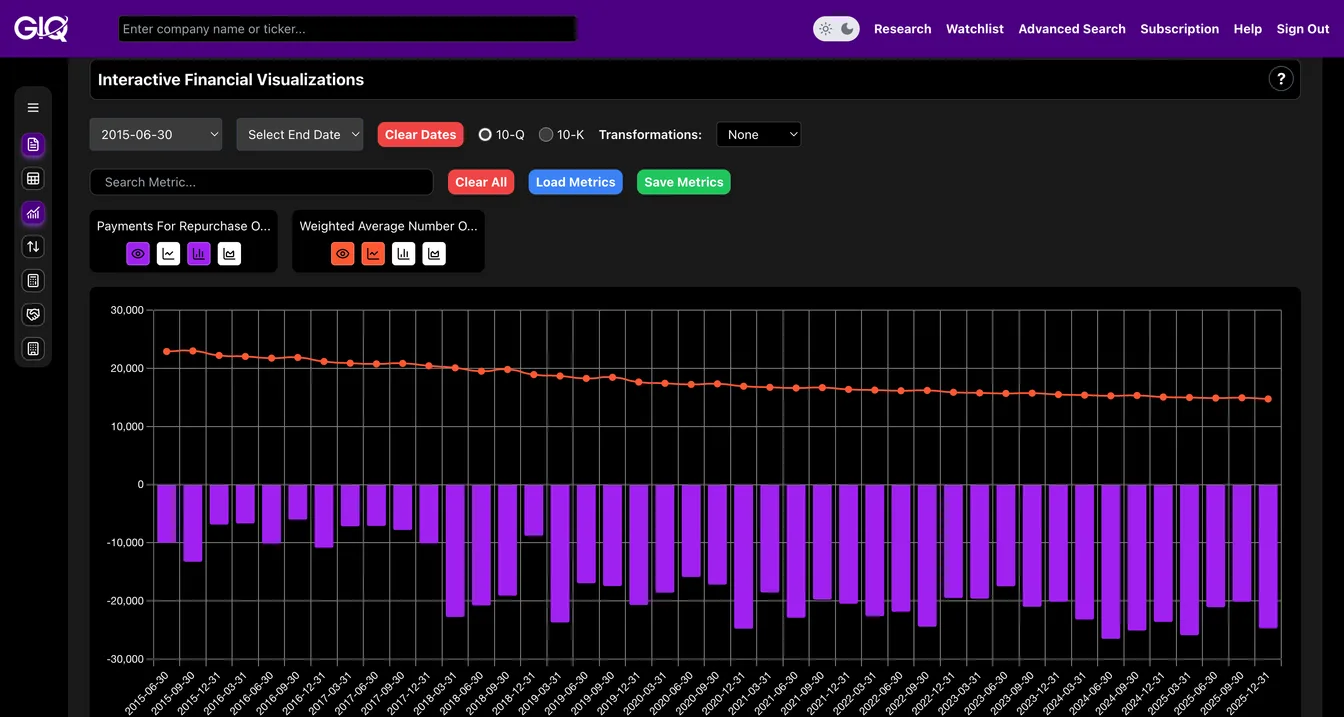
Wait, why is the buyback value negative on GeminIQ? Because we don't "massage" the data. In a raw GAAP filing, a buyback is a Cash Outflow.
The Purple Bars (Bottom): Show the massive cash outflows, $24.7B this quarter, as Apple aggressively repurchases its own stock.
The Red Line (Top): Shows the Basic Shares Outstanding steadily dropping, over 200 million shares retired just since last quarter.
The GeminIQ Edge: While aggregators might "clean" this, seeing the raw outflow proves the scale of Apple's Share Cannibal strategy.
The "Negative" Retained Earnings Alpha
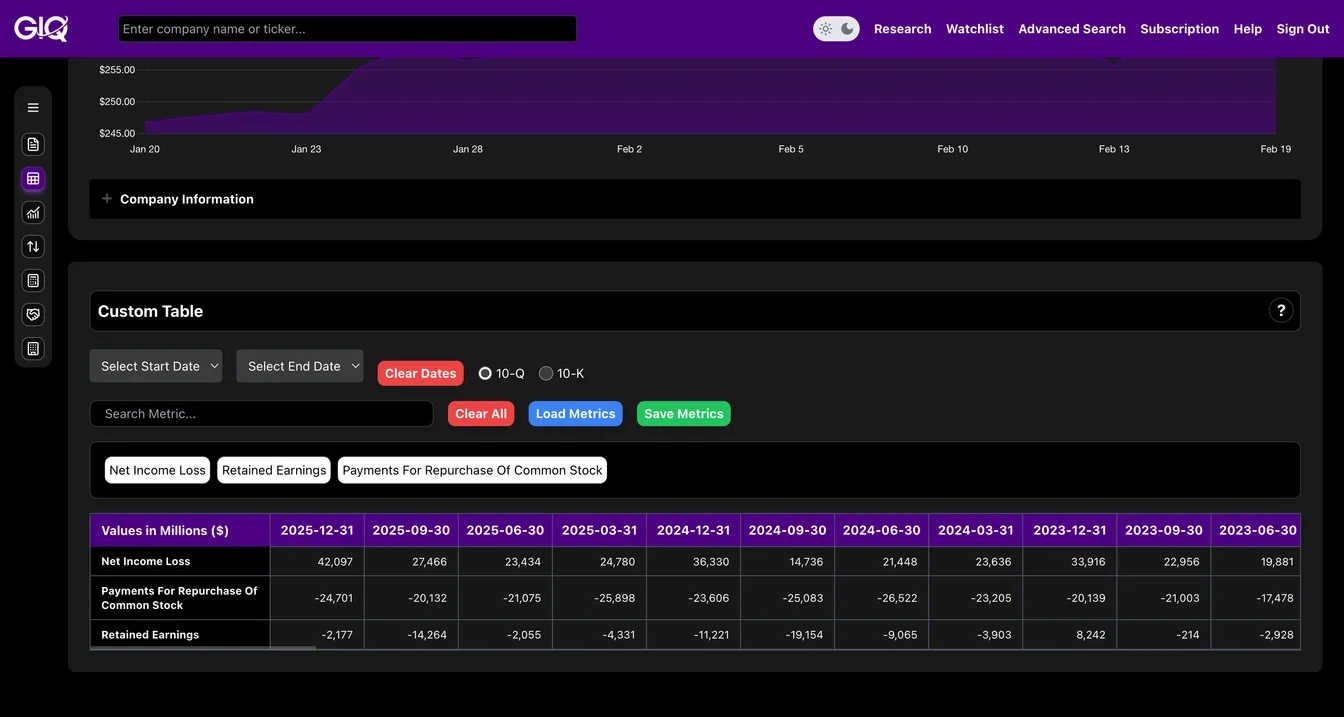
On the balance sheet, Apple shows an Accumulated Deficit of -$2.17B. Most retail sites show this as a red flag, but on GeminIQ, you see the truth: A Capital Allocation Masterclass.
Apple generates so much cash ($42.1B in Net Income this quarter) that they've returned more to shareholders than they've technically "retained" since 2012.
They are a "Self-Liquidating" fortress, mathematically increasing your ownership stake every quarter.
Verifying the Moat with ROIC
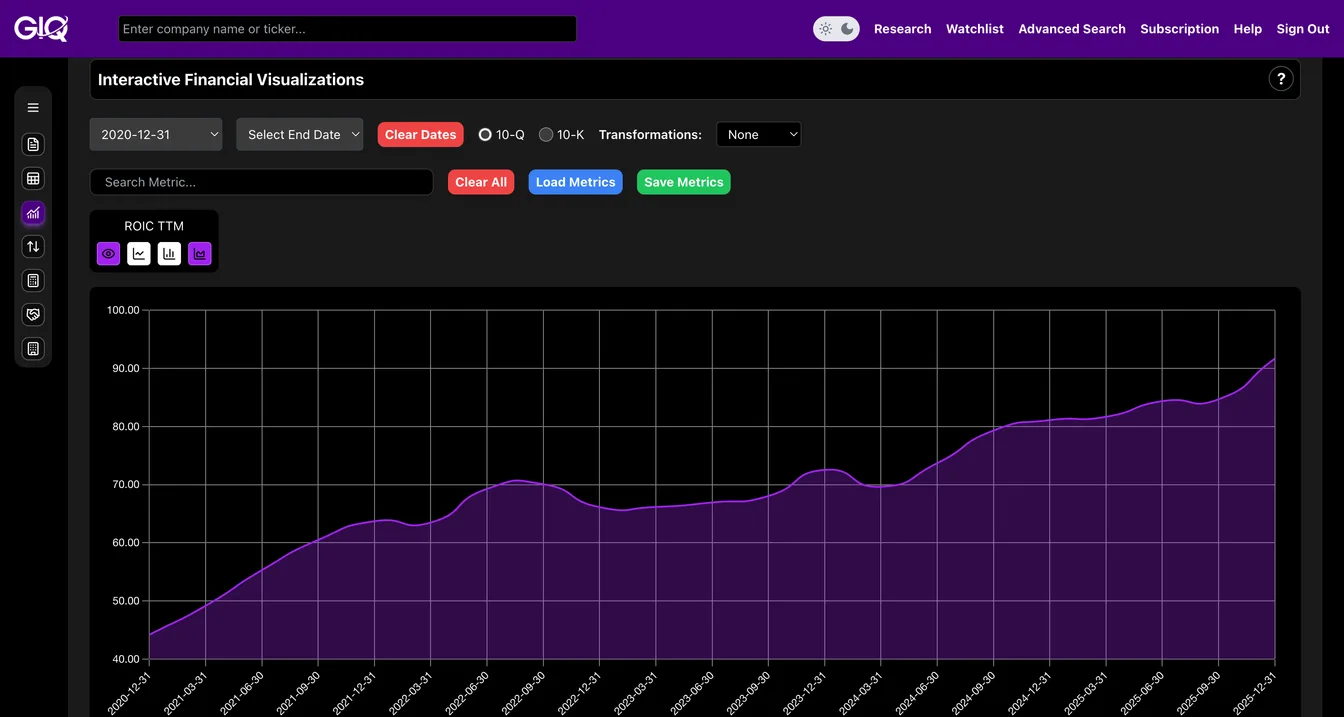
Take a look at the Return on Invested Capital (ROIC), Apple's ROIC (TTM) is sitting at an elite 91.68%.
Management is turning $1 of investment into nearly $1 of profit, year after year.
GIQ Tip: This is a core pillar of Intrinsic Value. As long as ROIC stays elite, the "Apple Machine" is working.
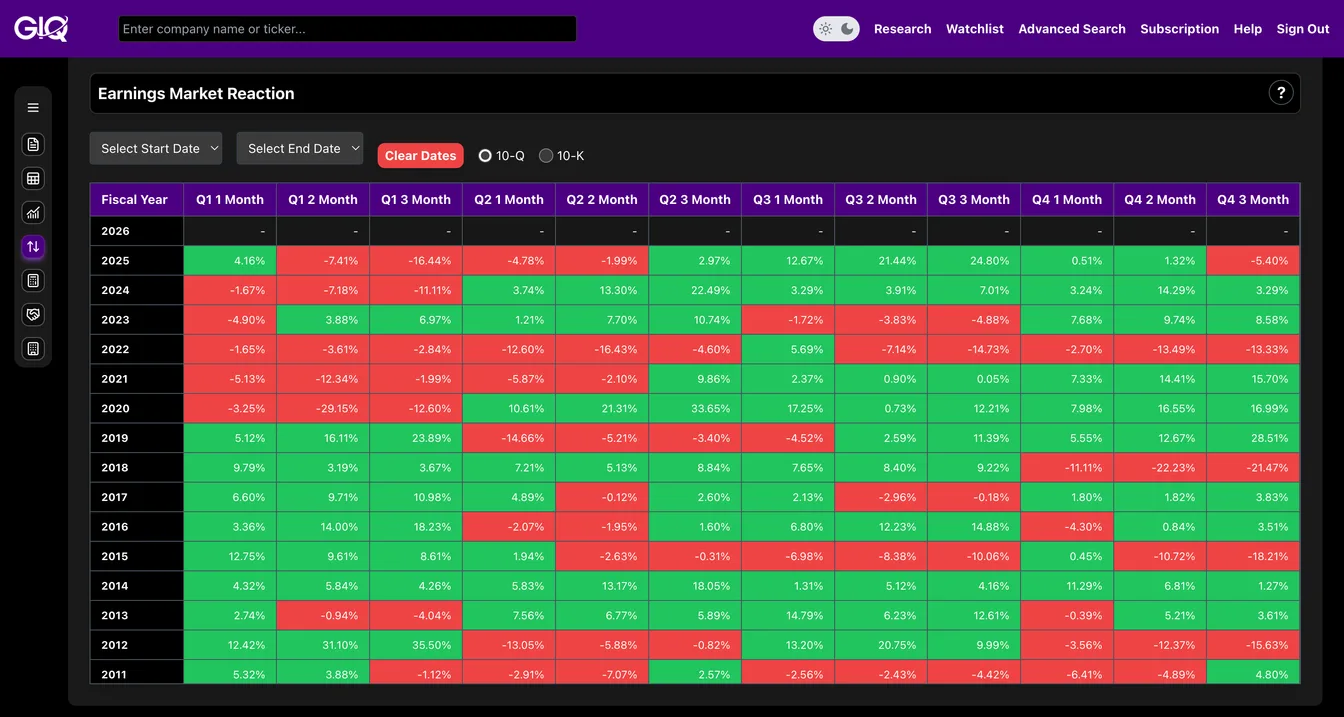
Timing the Entry (Behavioral Variance)
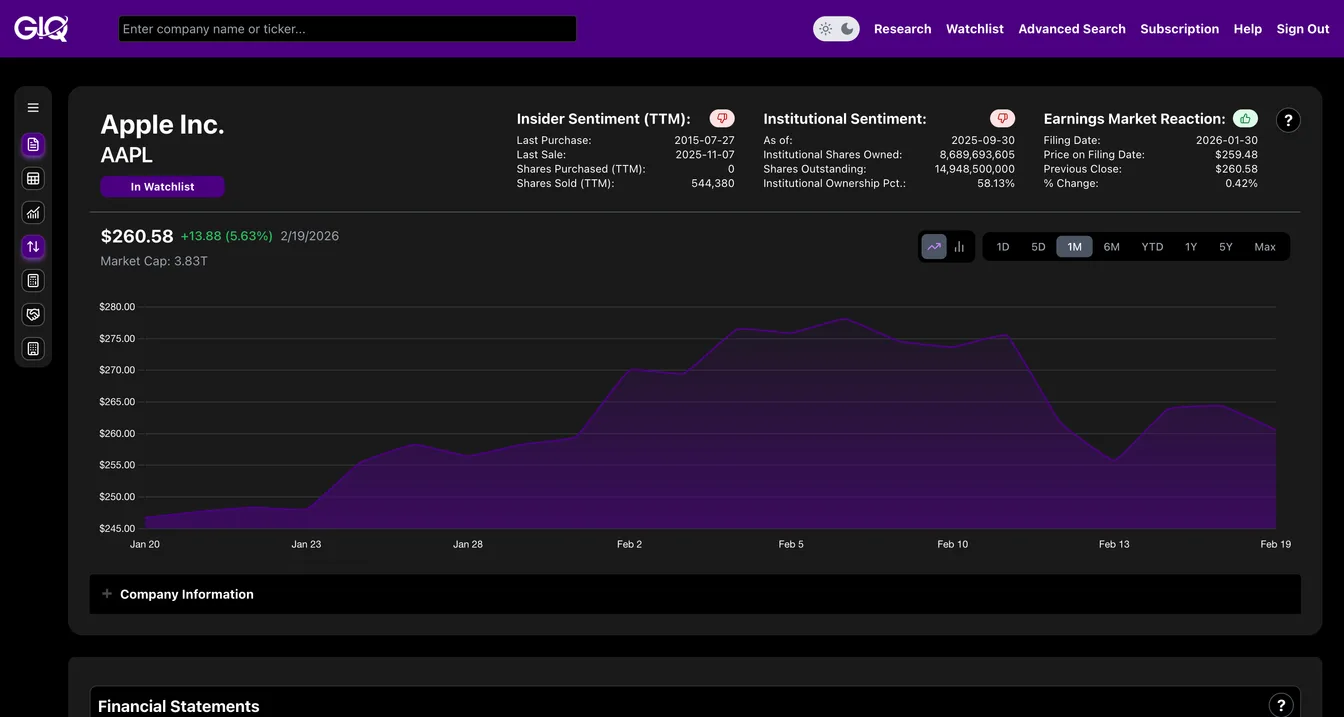
GeminIQ's Earnings Market Reaction Heat Map shows that during Q1, $AAPL historically drifts negatively until Q2.
The Data: History suggests waiting for Q2 often yields a better Margin of Safety than buying after the release of the Q1 financials.
Research faster. Invest smarter.
Most financial websites rely on third-party aggregators that simplify or process data before you ever see it. We built GeminIQ because we believe you deserve a better fundamental analysis tool—one that goes beyond basic price charts and processed numbers. We extract our data directly from SEC 10-K and 10-Q filings to ensure that when you look at a balance sheet or a cash flow statement, you are seeing the numbers exactly how the company reported them. GeminIQ turns raw 10-K and 10-Q filings into traceable financial statements, calculated metrics, charts, screeners, and watchlists for US public company research. Our goal is to give you the tools to verify the narrative for yourself using clean, traceable data. Start researching now at GeminIQ.
Related Blogs
- See why the Apple numbers on most platforms don’t match the actual 10-K
- See how NVIDIA’s 66% ROIC and buyback engine compares to Apple’s capital machine
- See how Alphabet’s $324B retained earnings fortress compares to Apple’s accumulated deficit
Disclaimer: The content in this blog is for educational and entertainment purposes only and does not constitute financial, legal, or tax advice. Investing involves risk, including the loss of principal. The views expressed are my own and not intended as financial advice or a guarantee of future performance.