Amazon ($AMZN): Is the $19 Billion Hidden Expense Eating Your Returns?
2026-02-20
Amazon ($AMZN) is posting massive operating cash flows, but value investors know that "Cash Flow" doesn't always equal shareholder value. I used GeminIQ to audit Amazon’s cash flow statement in their latest 10-K (filed Feb 2026). If you are looking into identifying hidden stock dilution in SEC filings, you have to look past the top-line revenue and dig into how they pay their employees. Here is the fundamental truth behind the ticker.
The Stock-Based Comp Value Killer
Wait, why does Amazon’s Operating Cash Flow look so high on popular aggregators? Because third-party sites often ignore the reality of Non-Cash Add-Backs. To understand GAAP vs non-GAAP earnings discrepancies, you have to look at Stock-Based Compensation (SBC).
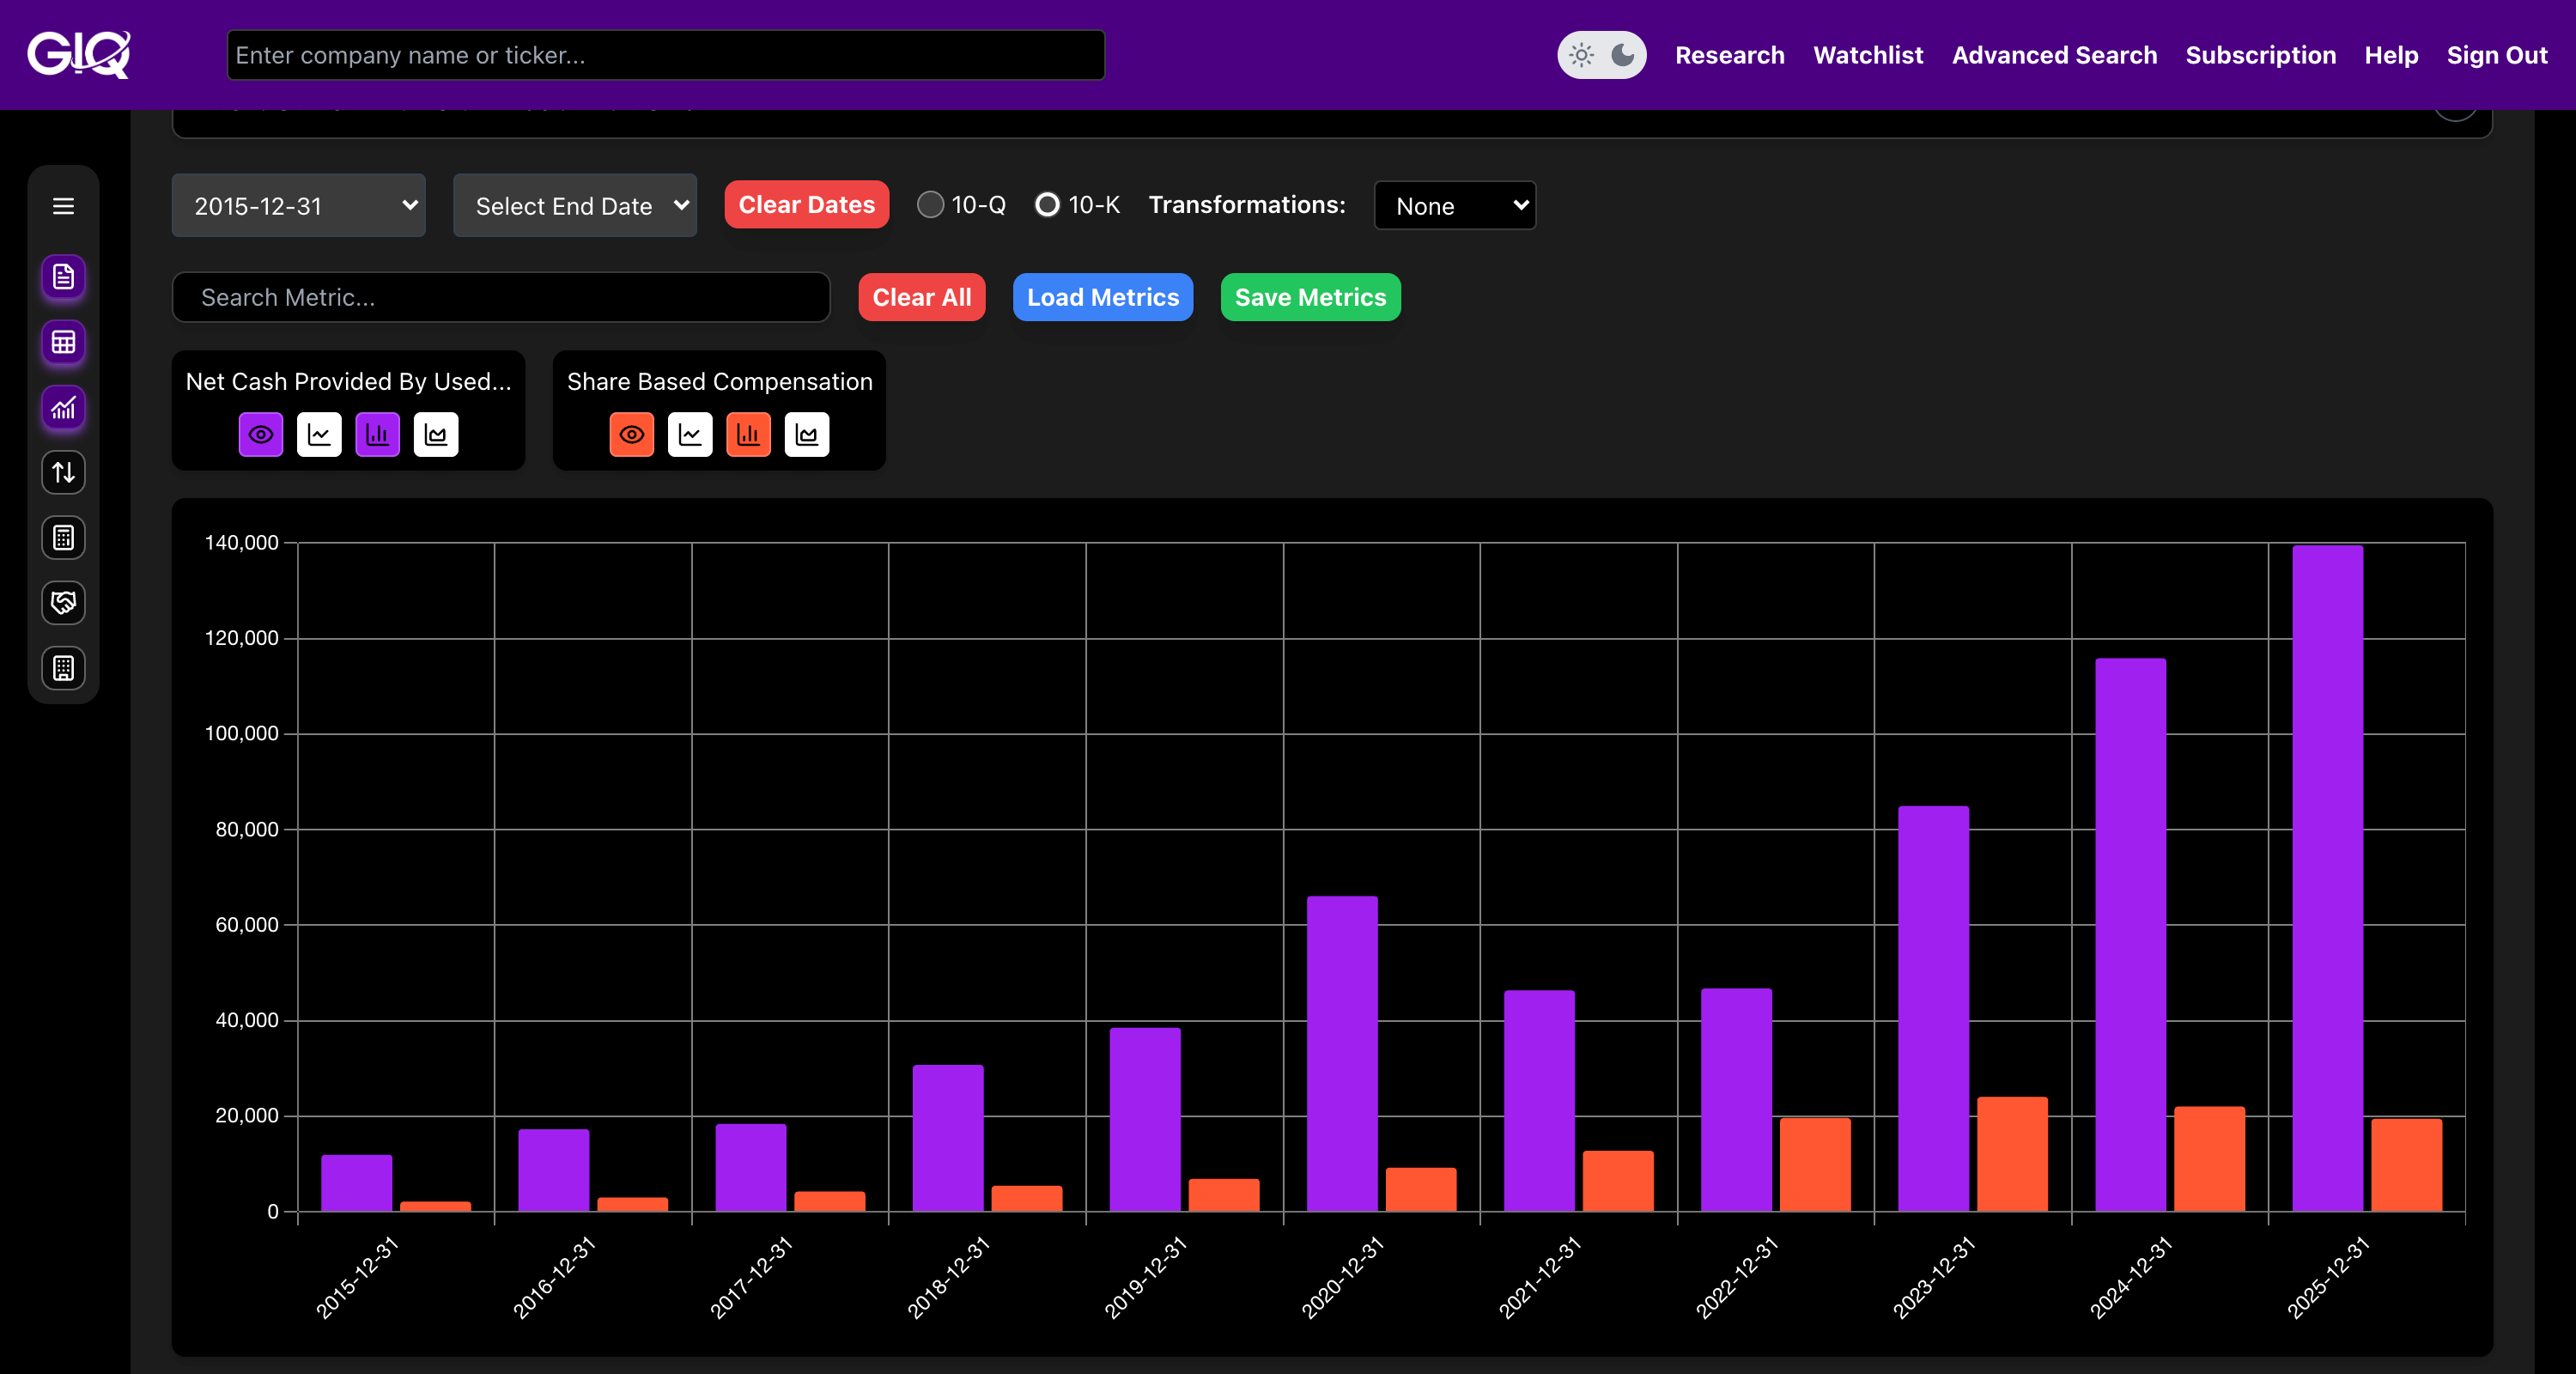
The Purple Bars (Bottom): Amazon’s Net Cash from Operations is an impressive $139.5 Billion for the twelve trailing months (TTM).
The Red Bars (Top): Their Stock-Based Compensation (SBC) TTM is a massive $19.5 Billion.
The GeminIQ Edge: Mainstream aggregators just show the massive cash flow. GeminIQ lets you isolate the SBC line item, proving that nearly 14% of their operating cash flow is actually just paying employees in stock, a massive, hidden cost to your ownership stake.
The Dilution Reality (Shares Outstanding)
You might think tech giants are buying back enough stock to offset this. However, if you are looking for a reliable stock-based compensation analysis tool, you must track the raw share count.
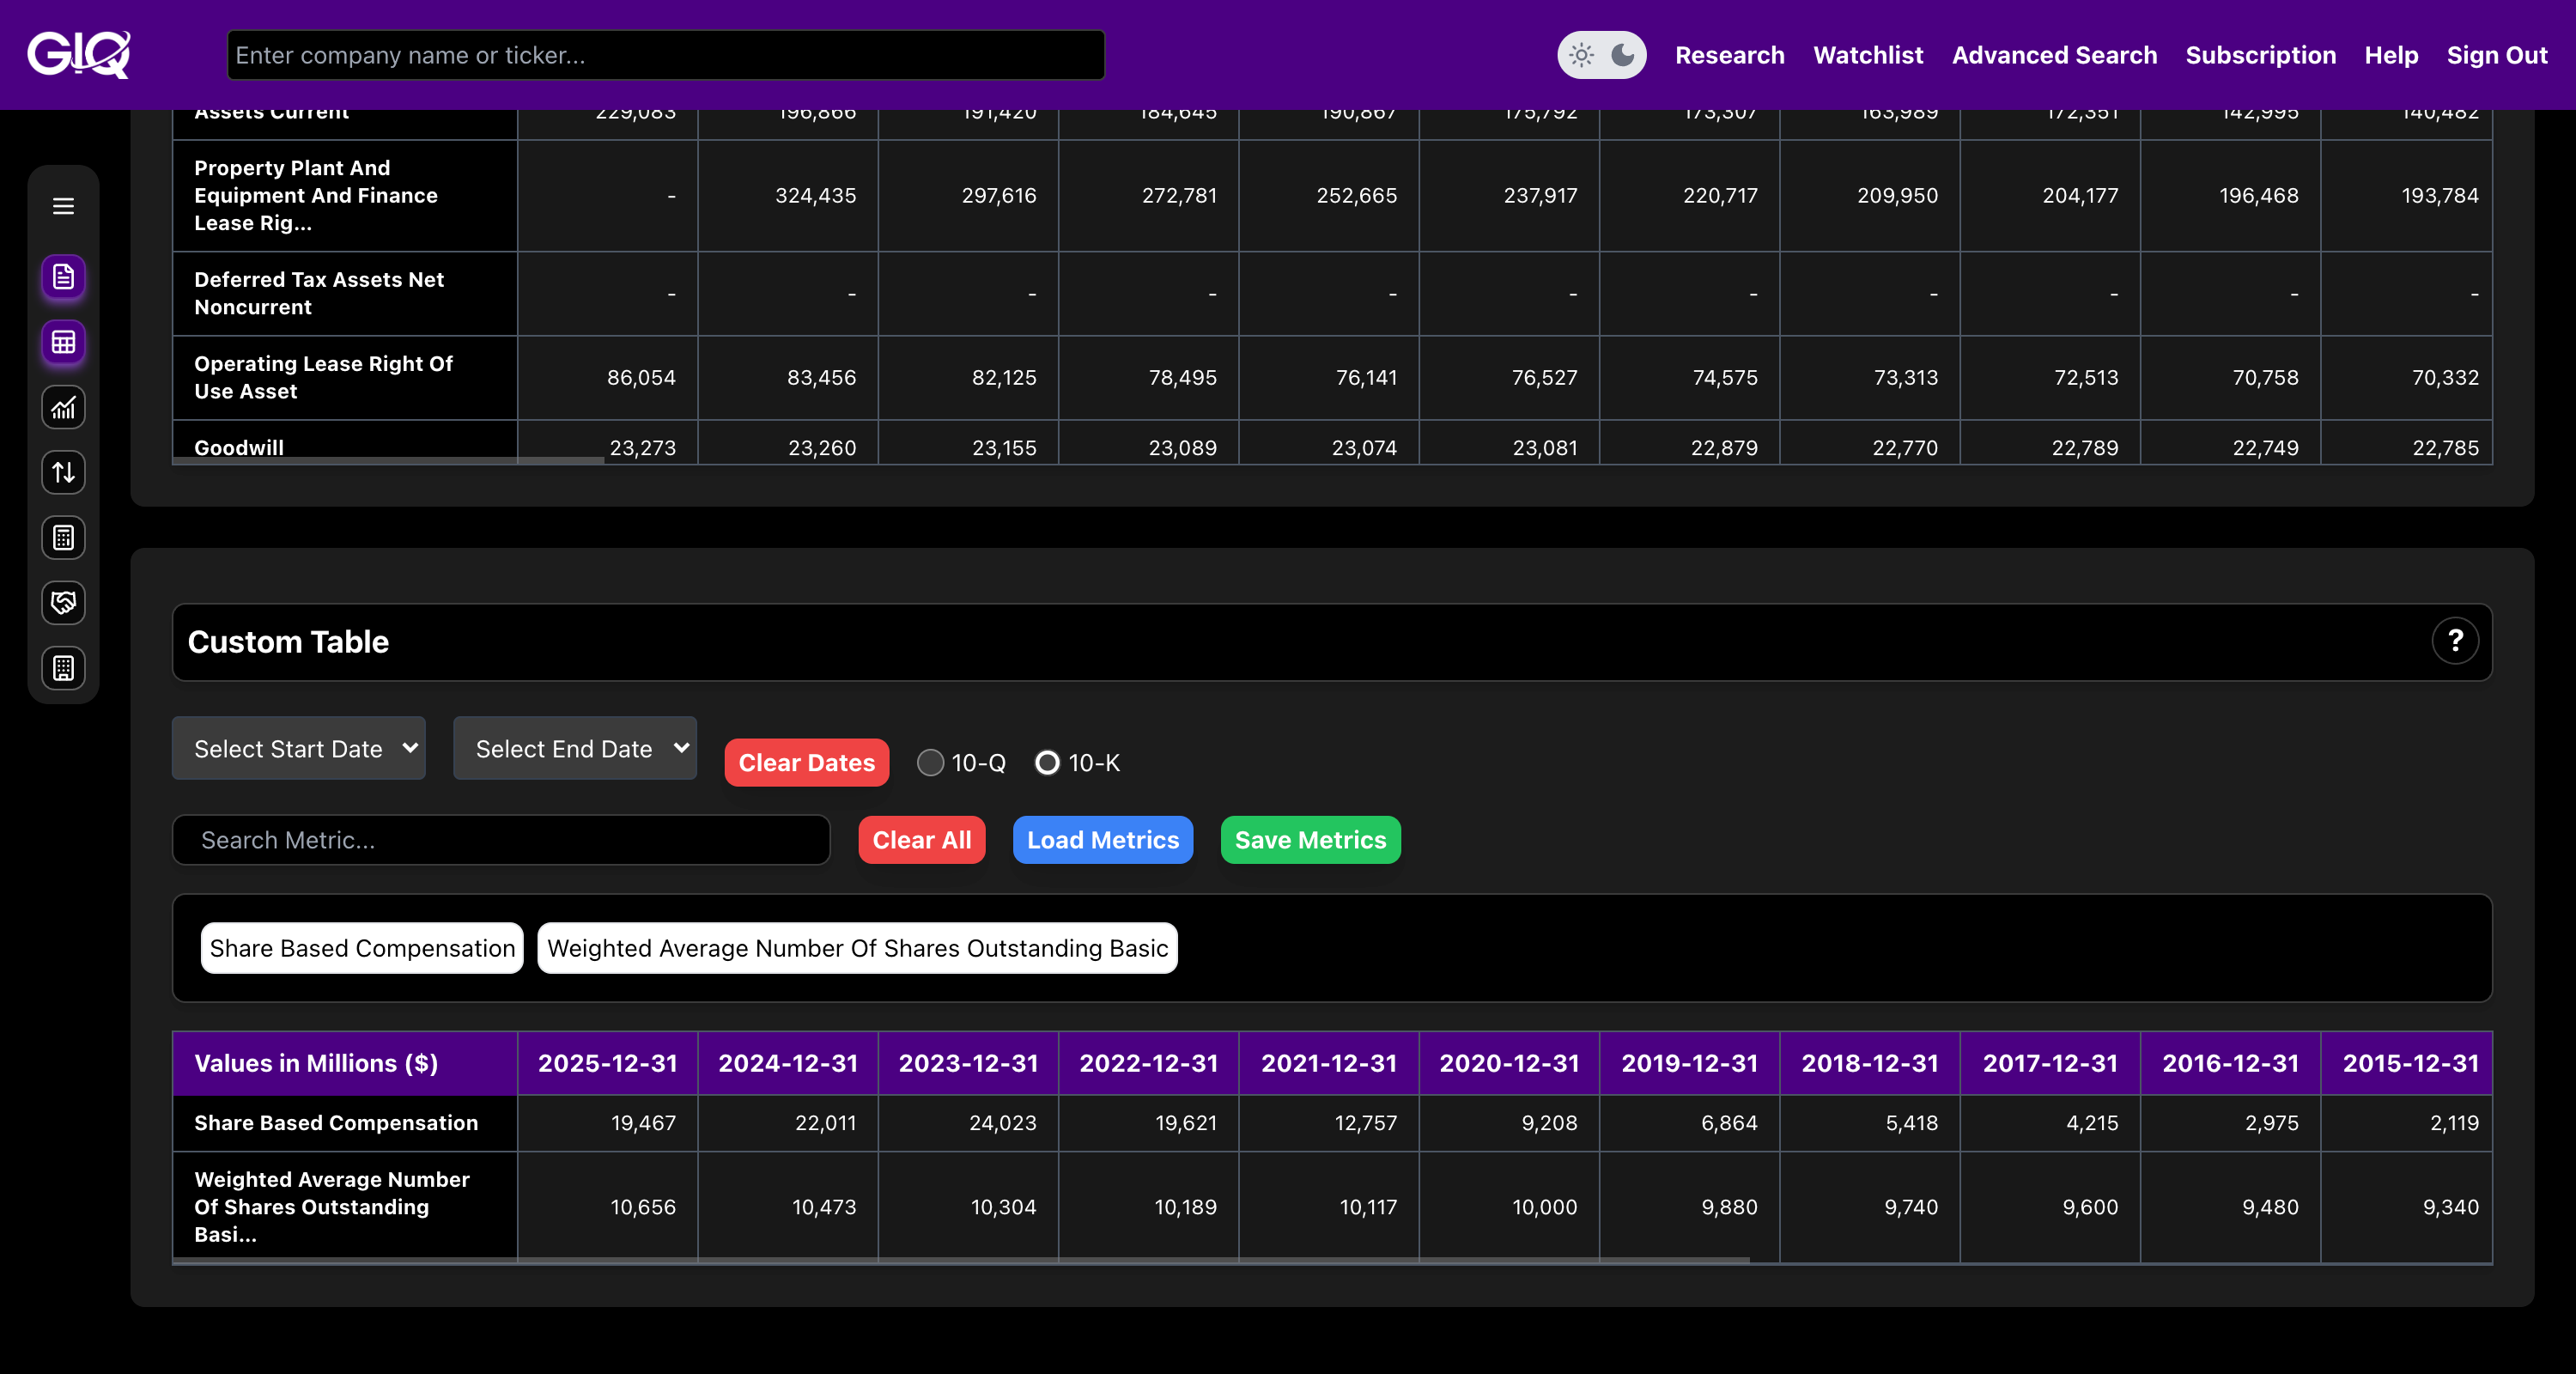
On GeminIQ, we see Amazon’s Basic Shares Outstanding actually increased from 10.47 Billion (Dec 2024) to 10.66 Billion (Dec 2025).
They are a "Dilution Machine”, while they generate incredible revenue, they are mathematically shrinking your slice of the pie every quarter to fund their talent pool.
Verifying the Moat with Smart Money
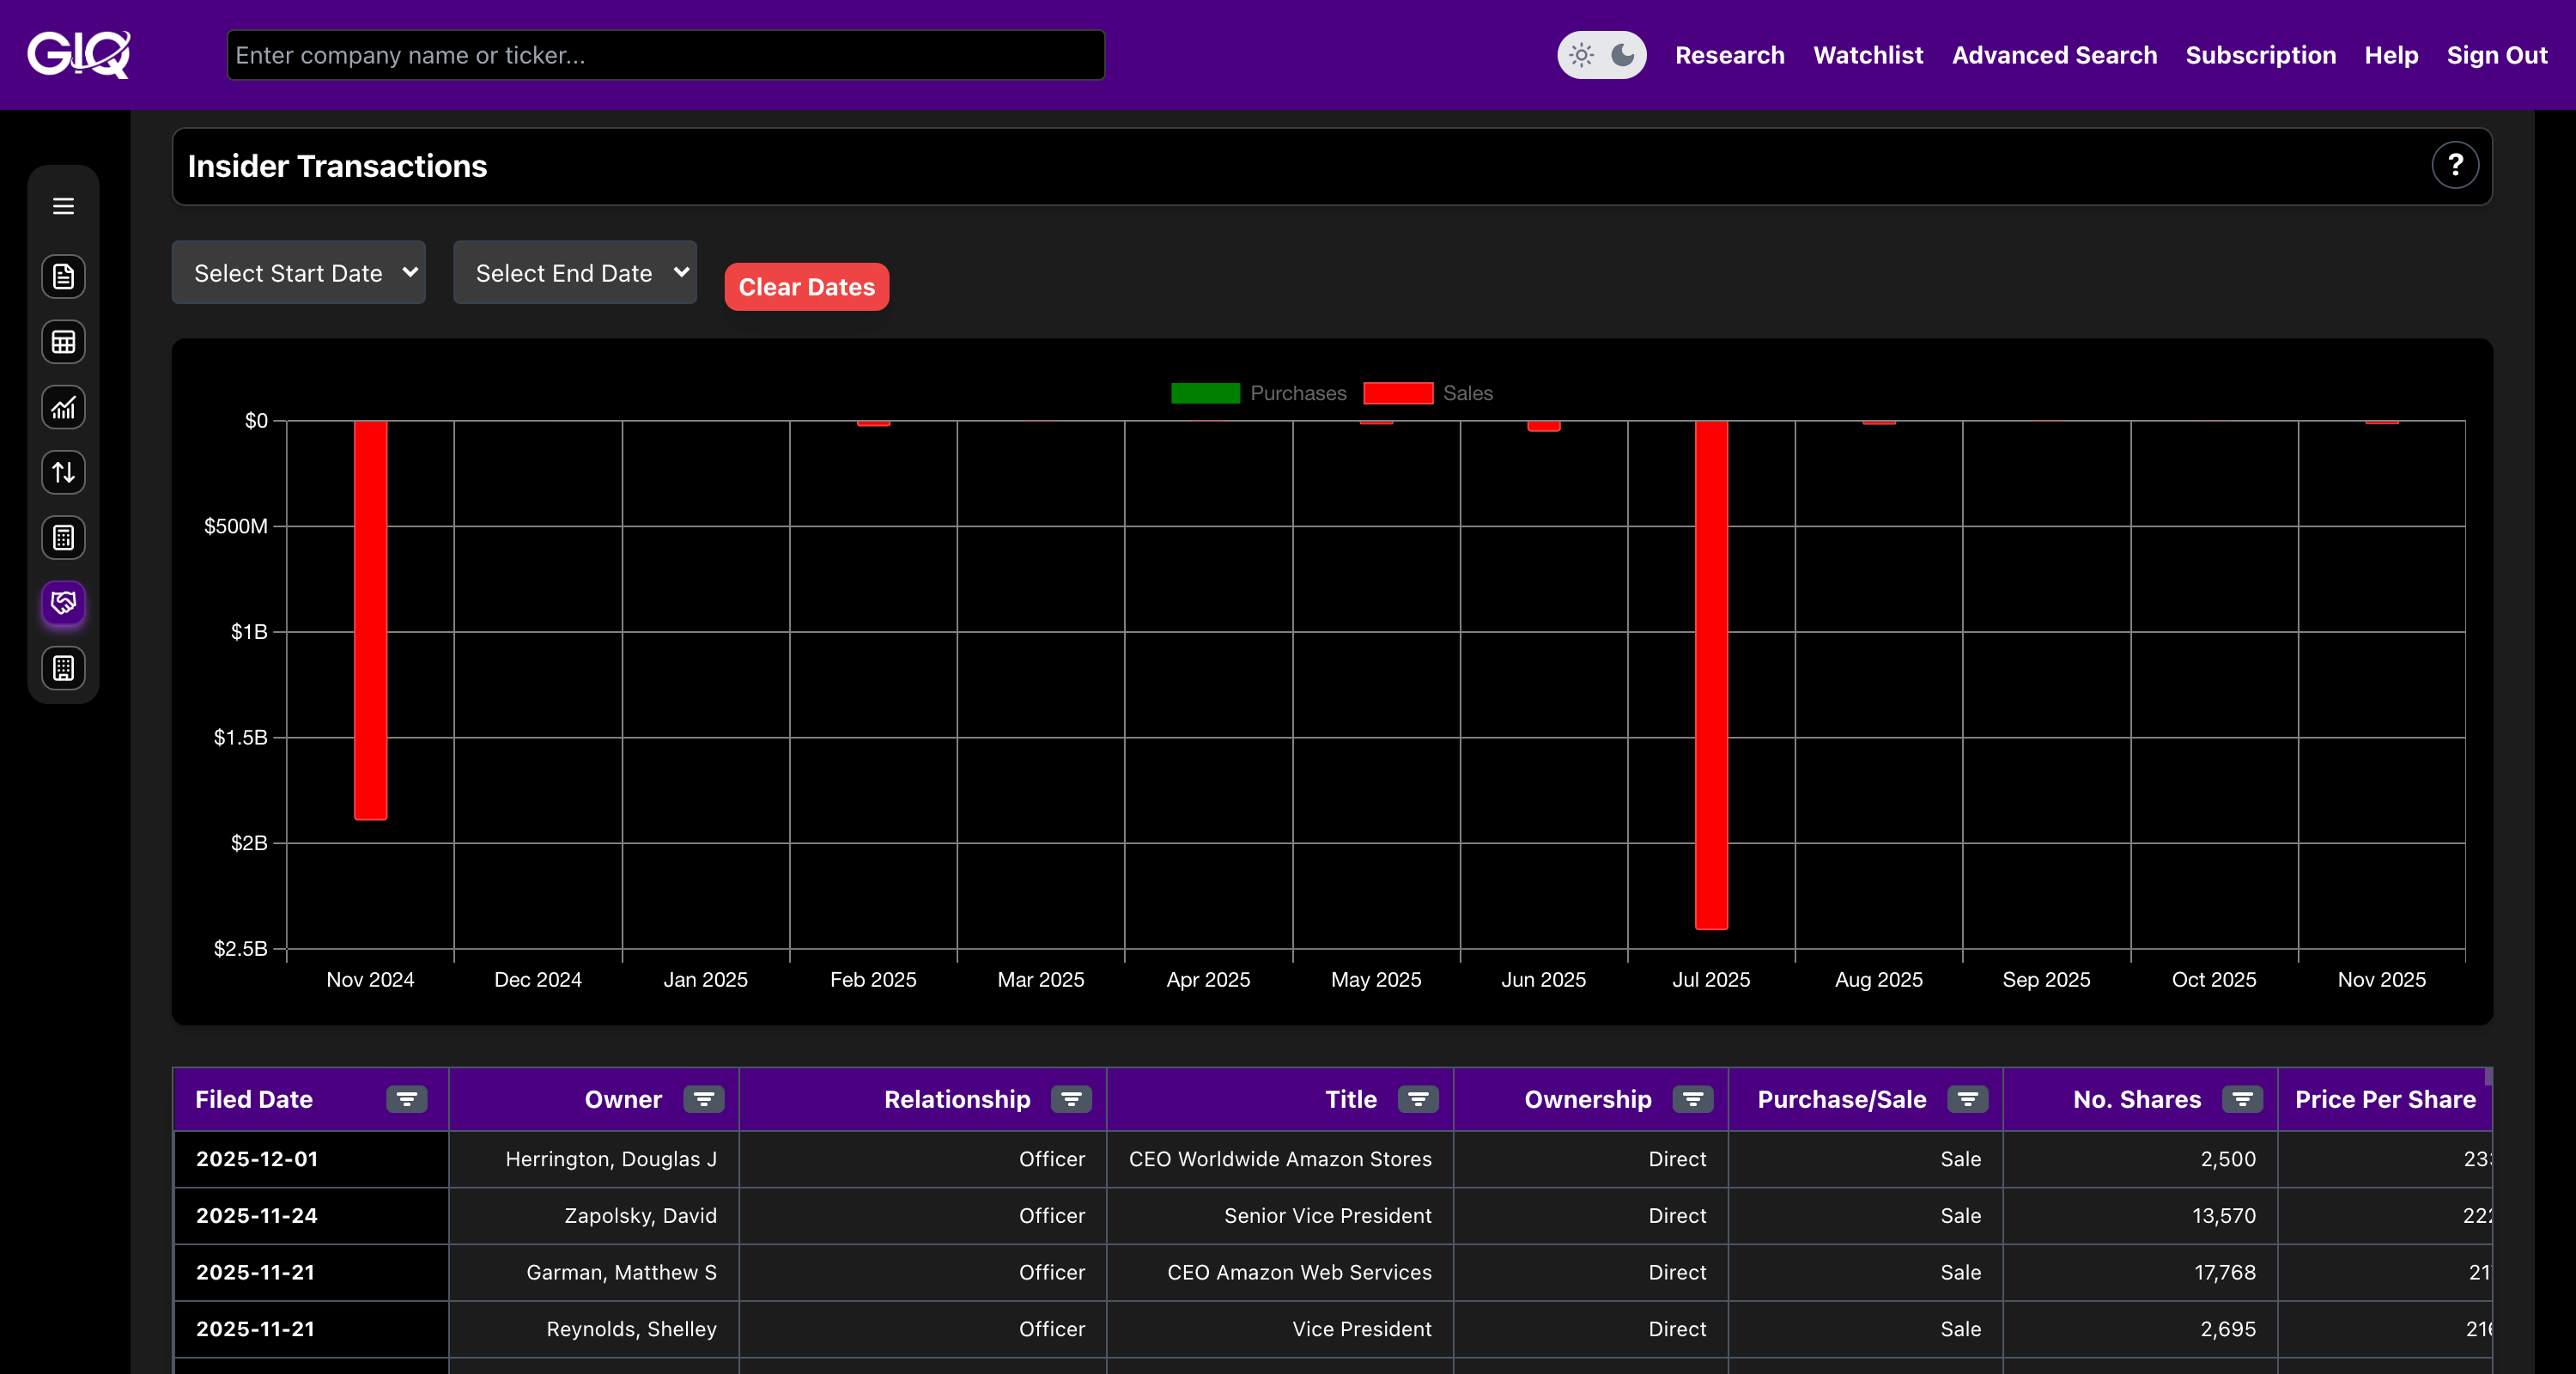
If the company is paying out $19.5 Billion in stock to employees and executives, what are those insiders doing with it? We use GeminIQ to track the divergence.
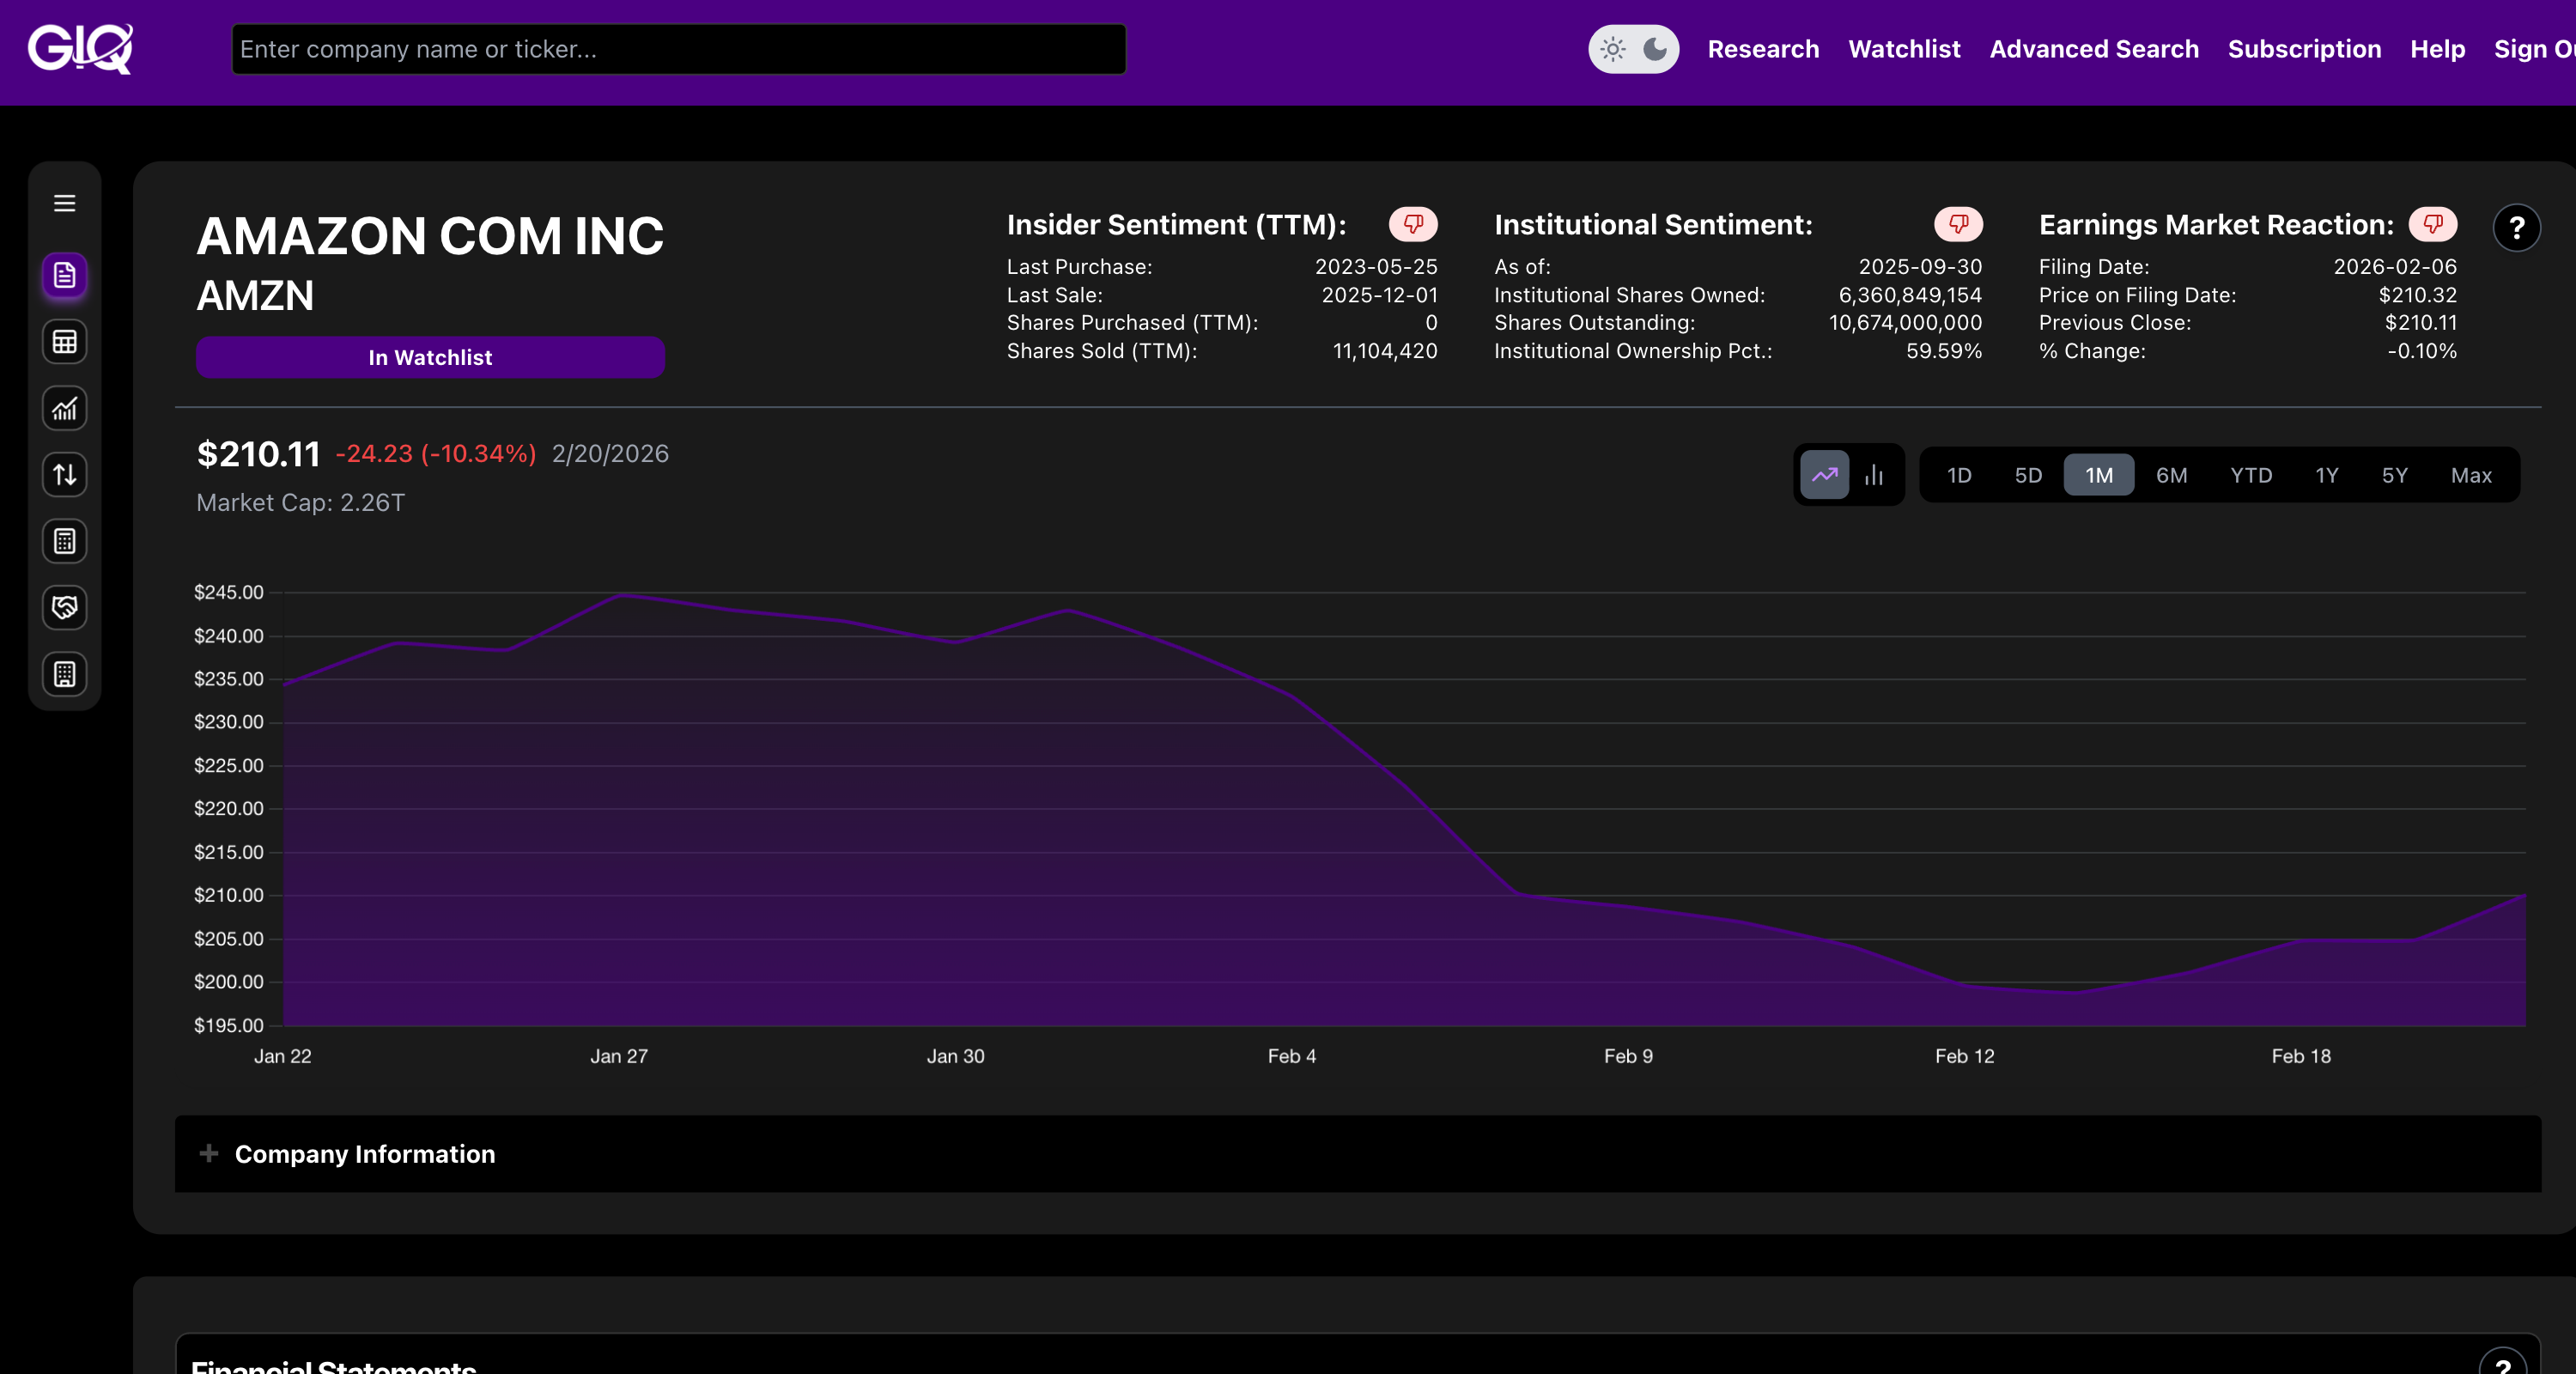
Insider Sentiment: When executives receive massive SBC grants, tracking their open-market sales becomes critical. The sentiment shows consistent distribution.
GIQ Tip: Knowing how to calculate true free cash flow means subtracting SBC. When the "Smartest People in the Room" are aggressively cashing out their stock awards rather than holding, you need to factor that into your true valuation.
Timing the Entry (Behavioral Variance)
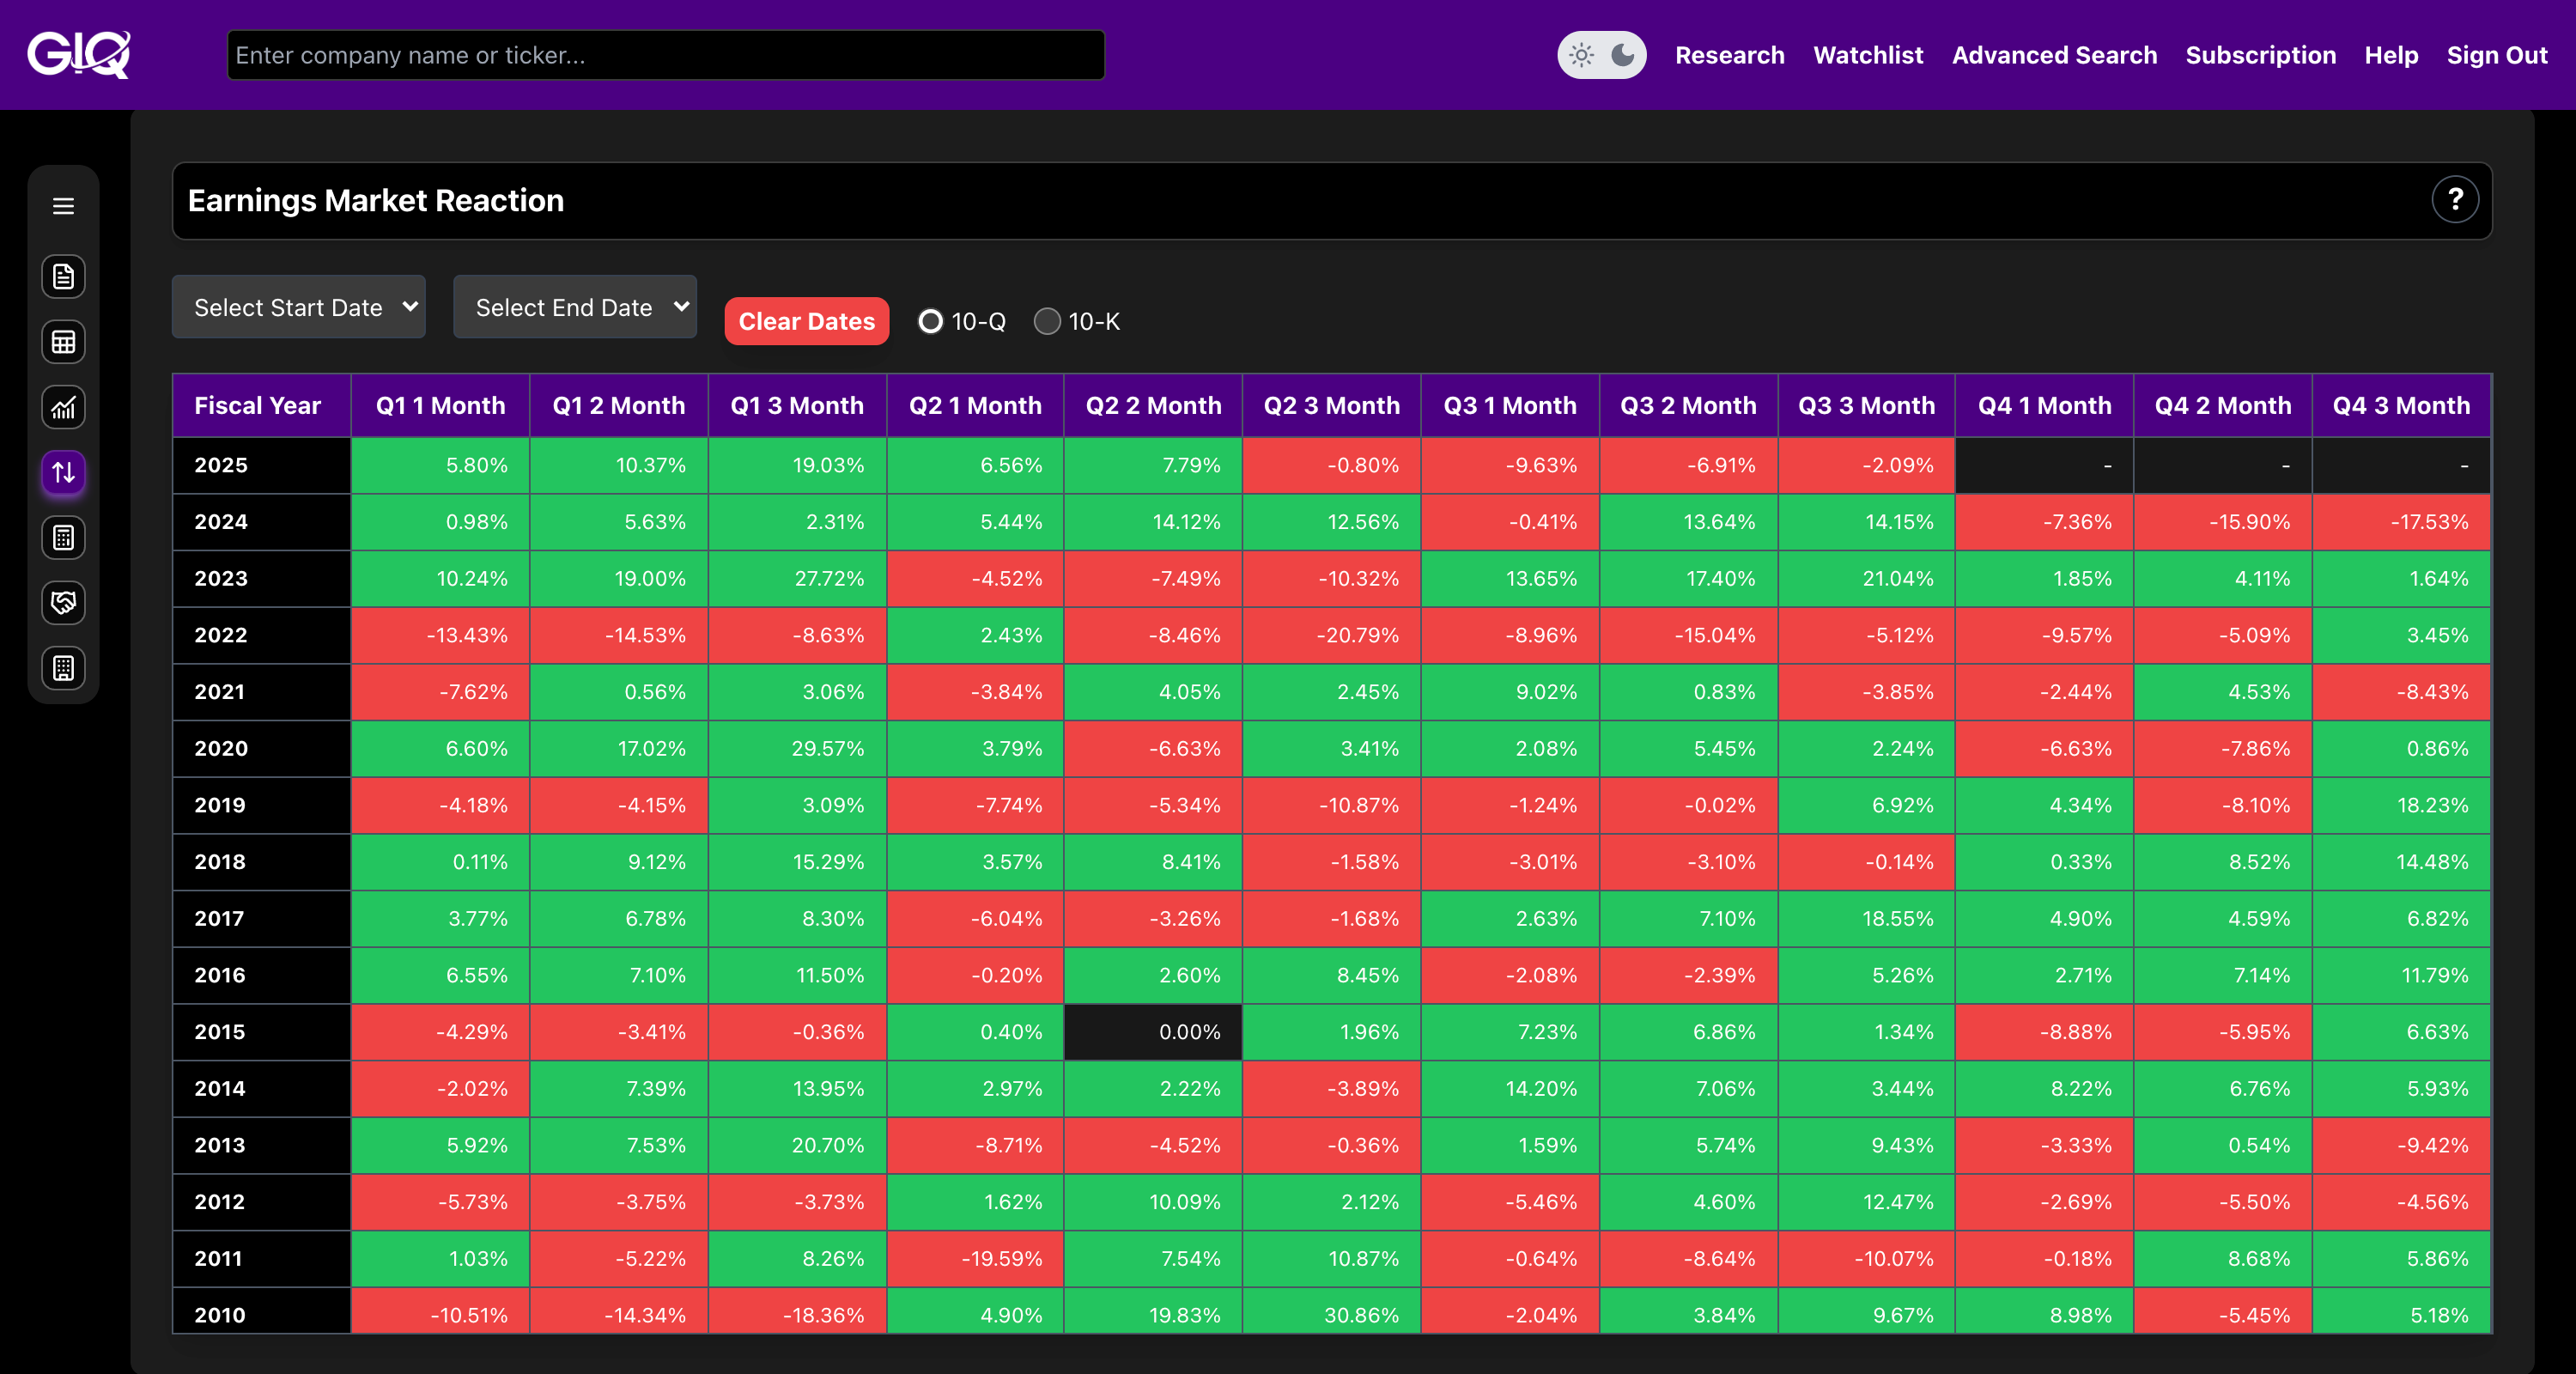
Should you buy the "earnings beat" when they report massive cash flow? For a true margin of safety, we use post-earnings drift historical analysis. GeminIQ's Earnings Market Reaction Heat Map shows how the market digests this hidden dilution over time.
The Data: In Q3 2025, AMZN dropped 9.6% in the first month (M1) post-earnings, stabilizing by month three (M3).
Strategy: History suggests that Wall Street initially celebrates the top-line beat, but the stock often drifts lower as analysts factor in the $19.5 Billion SBC dilution reality. Waiting for this drift provides a better Margin of Safety.
Research faster. Invest smarter.
Most financial websites rely on third-party aggregators that simplify or process data before you ever see it. We built GeminIQ because we believe you deserve a better fundamental analysis tool—one that goes beyond basic price charts and processed numbers. We extract our data directly from SEC 10-K and 10-Q filings to ensure that when you look at a balance sheet or a cash flow statement, you are seeing the numbers exactly how the company reported them. Start researching now at GeminIQ.com.
Disclaimer: The content in this blog is for educational and entertainment purposes only and does not constitute financial, legal, or tax advice. Investing involves risk, including the loss of principal. The views expressed are my own and not intended as financial advice or a guarantee of future performance.