Costco ($COST): The 3.8% Margin Business Earning 42% on Capital
2026-04-19
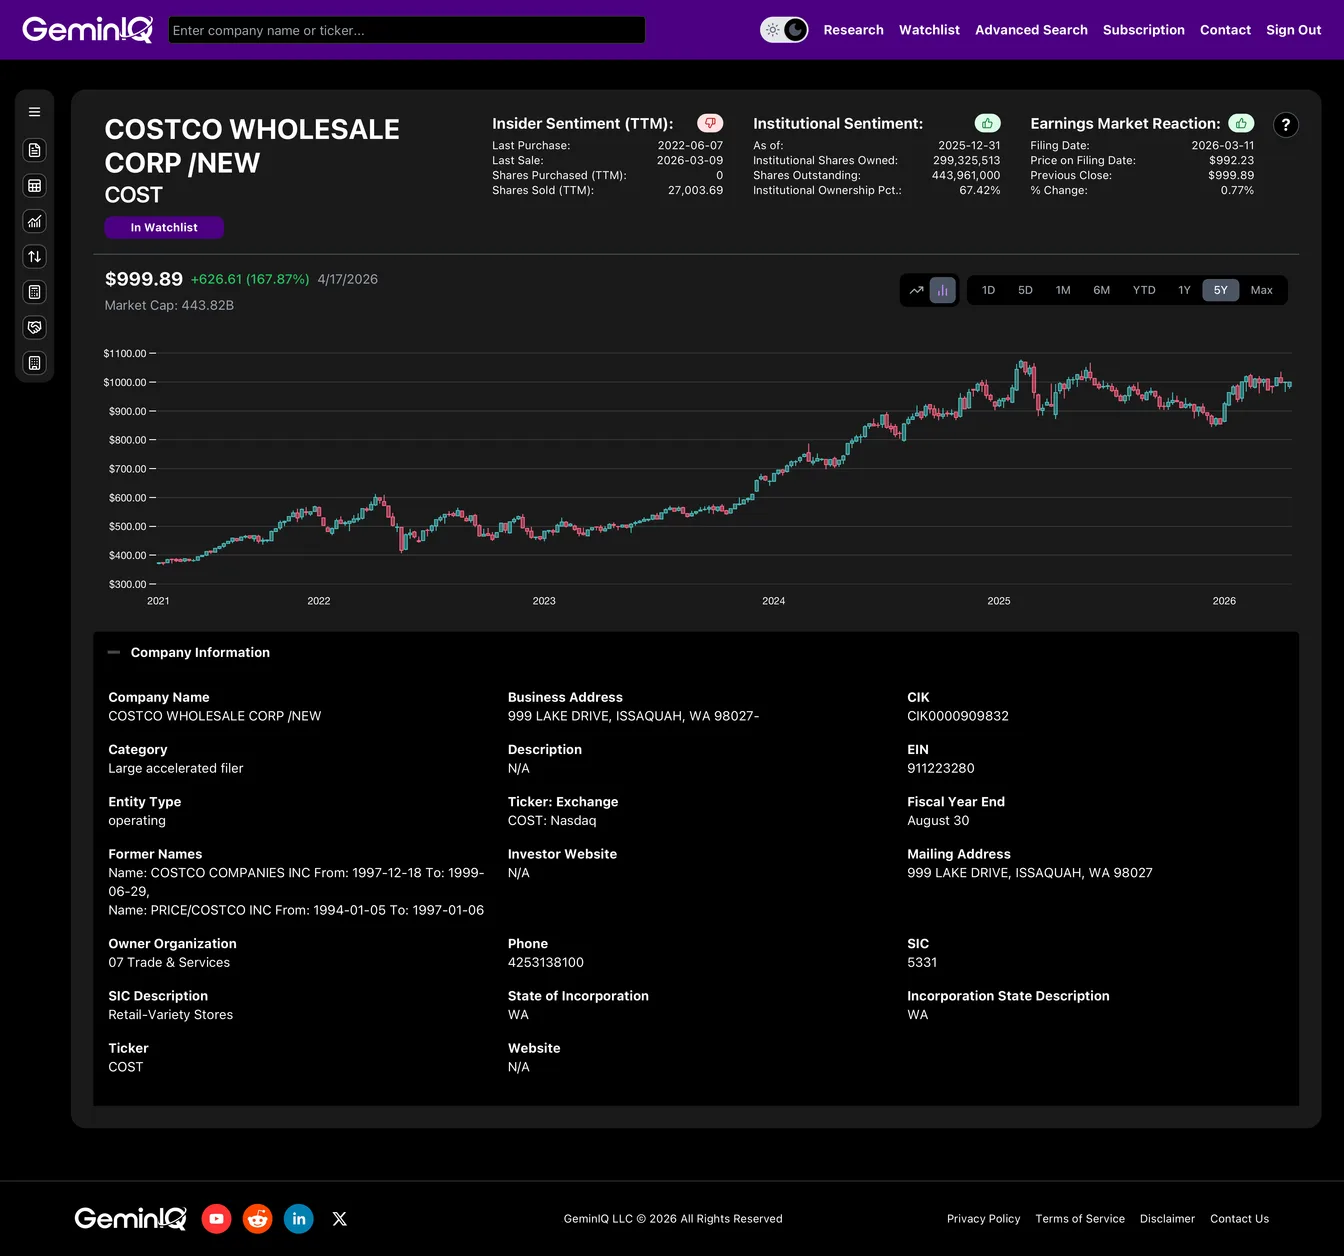
Costco Wholesale Corporation ($COST) just dropped its Q2 FY2026 10-Q (filed March 11, 2026), and the surface-level headlines look identical to every other quarter: thin margins, relentless same-store sales coverage, and another round of debate over whether the stock deserves a 50x P/E. Every financial commentator on TV frames Costco as a "low-margin grocer" and argues the premium valuation is irrational.
But standard financial media is looking at the wrong line. I used GeminIQ to audit the raw SEC data—cross-referencing the Income Statement, the Balance Sheet, Cash Flow, Insider Form 4s, and 13F Institutional Holdings. The real story is that Costco isn't a retailer at all. It is a subscription business wearing a warehouse as a disguise, and the raw filings reveal one of the most capital-efficient business models on the entire S&P 500. Here is the fundamental, data-driven truth behind the ticker.
The 12.9% Gross Margin "Trap"
If you screen Costco against any other major retailer, it looks structurally broken. Walmart operates at roughly 24% gross margin. Target sits in the high 20s. Even commodity grocers like Kroger clear 20%+. Costco, by contrast, posts a 12.87% gross margin TTM—almost half of its closest competitors.
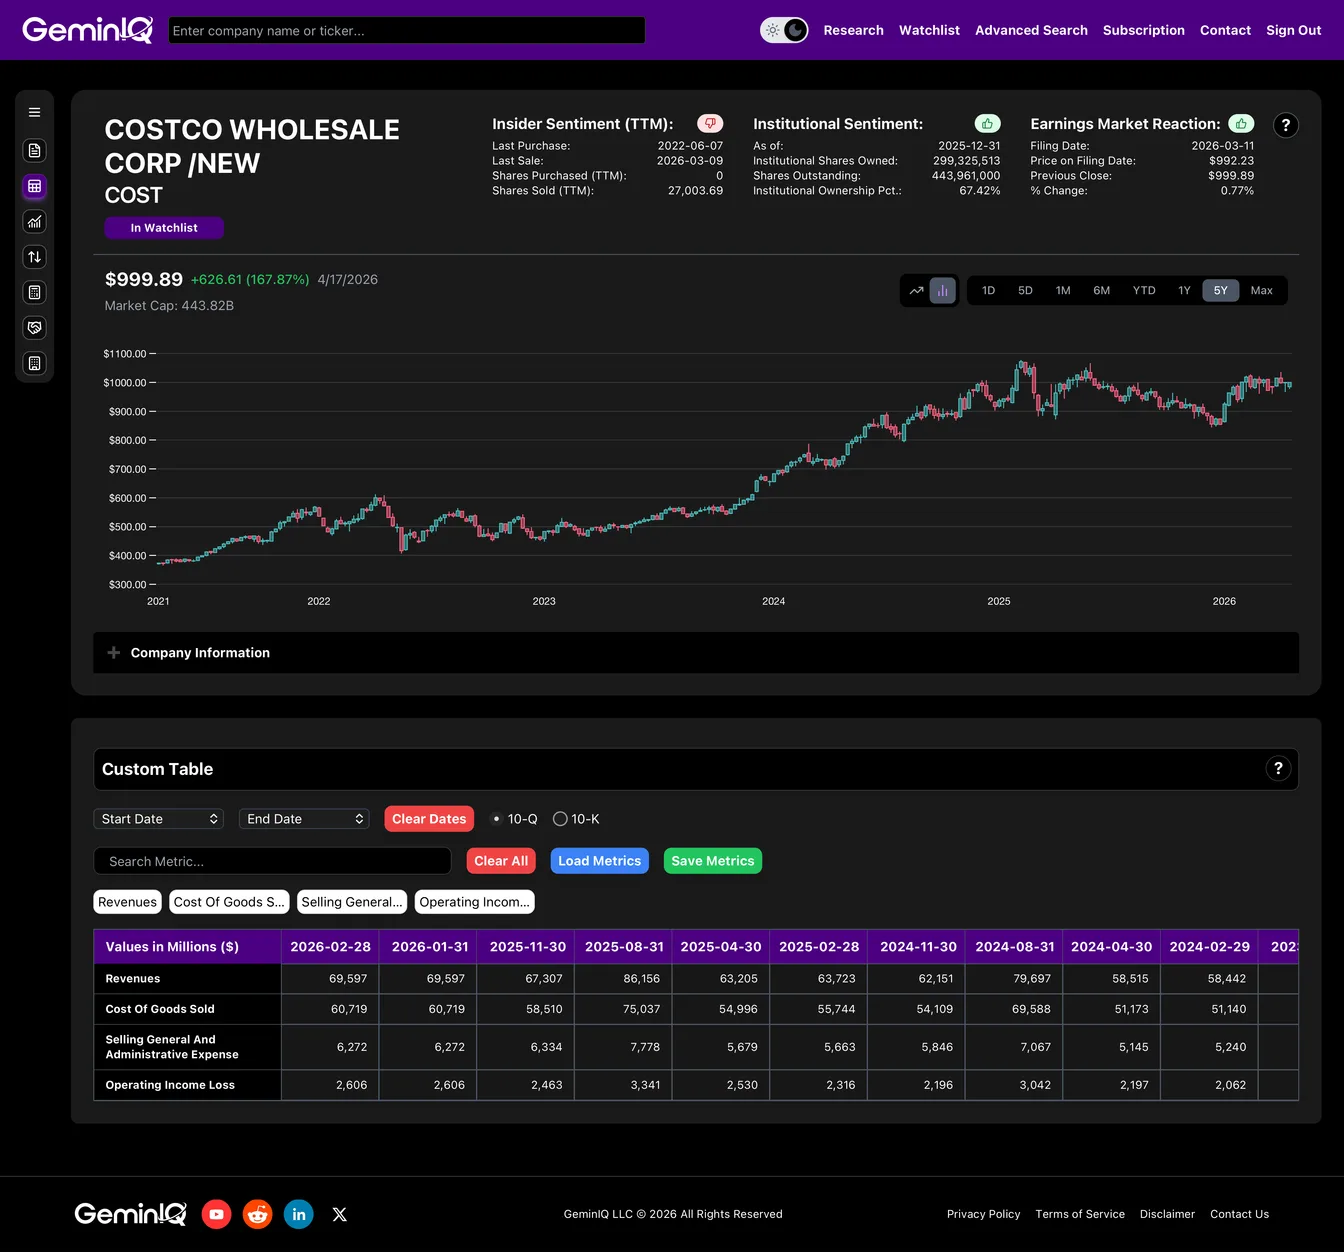
The Data: On the Q2 FY26 10-Q, Costco posted $69.60 Billion in quarterly Revenues against $60.72 Billion in Cost of Goods Sold, leaving just $6.27 Billion in SG&A and $2.61 Billion in Operating Income for the quarter. On a TTM basis, revenue climbs to $292.66 Billion, operating income to $11.02 Billion—good for a 3.76% operating margin.
The GeminIQ Edge: A standard screener flags this as a red flag. By pulling the raw Income Statement quarter-by-quarter via GeminIQ's Custom Table, we can see Costco is intentionally running the thinnest possible gross margin. This isn't weakness—it's the moat. Management prices merchandise at near-breakeven specifically to drive the metric that actually matters: member renewals. The merchandise business is a loss-leader for the real product.
The ROIC Paradox (The Real Engine)
Here is where the screener lies completely. A 3.76% operating margin business should, mathematically, earn a pedestrian return on capital. Instead, Costco is earning a staggering return that dwarfs nearly every other mega-cap in the market.
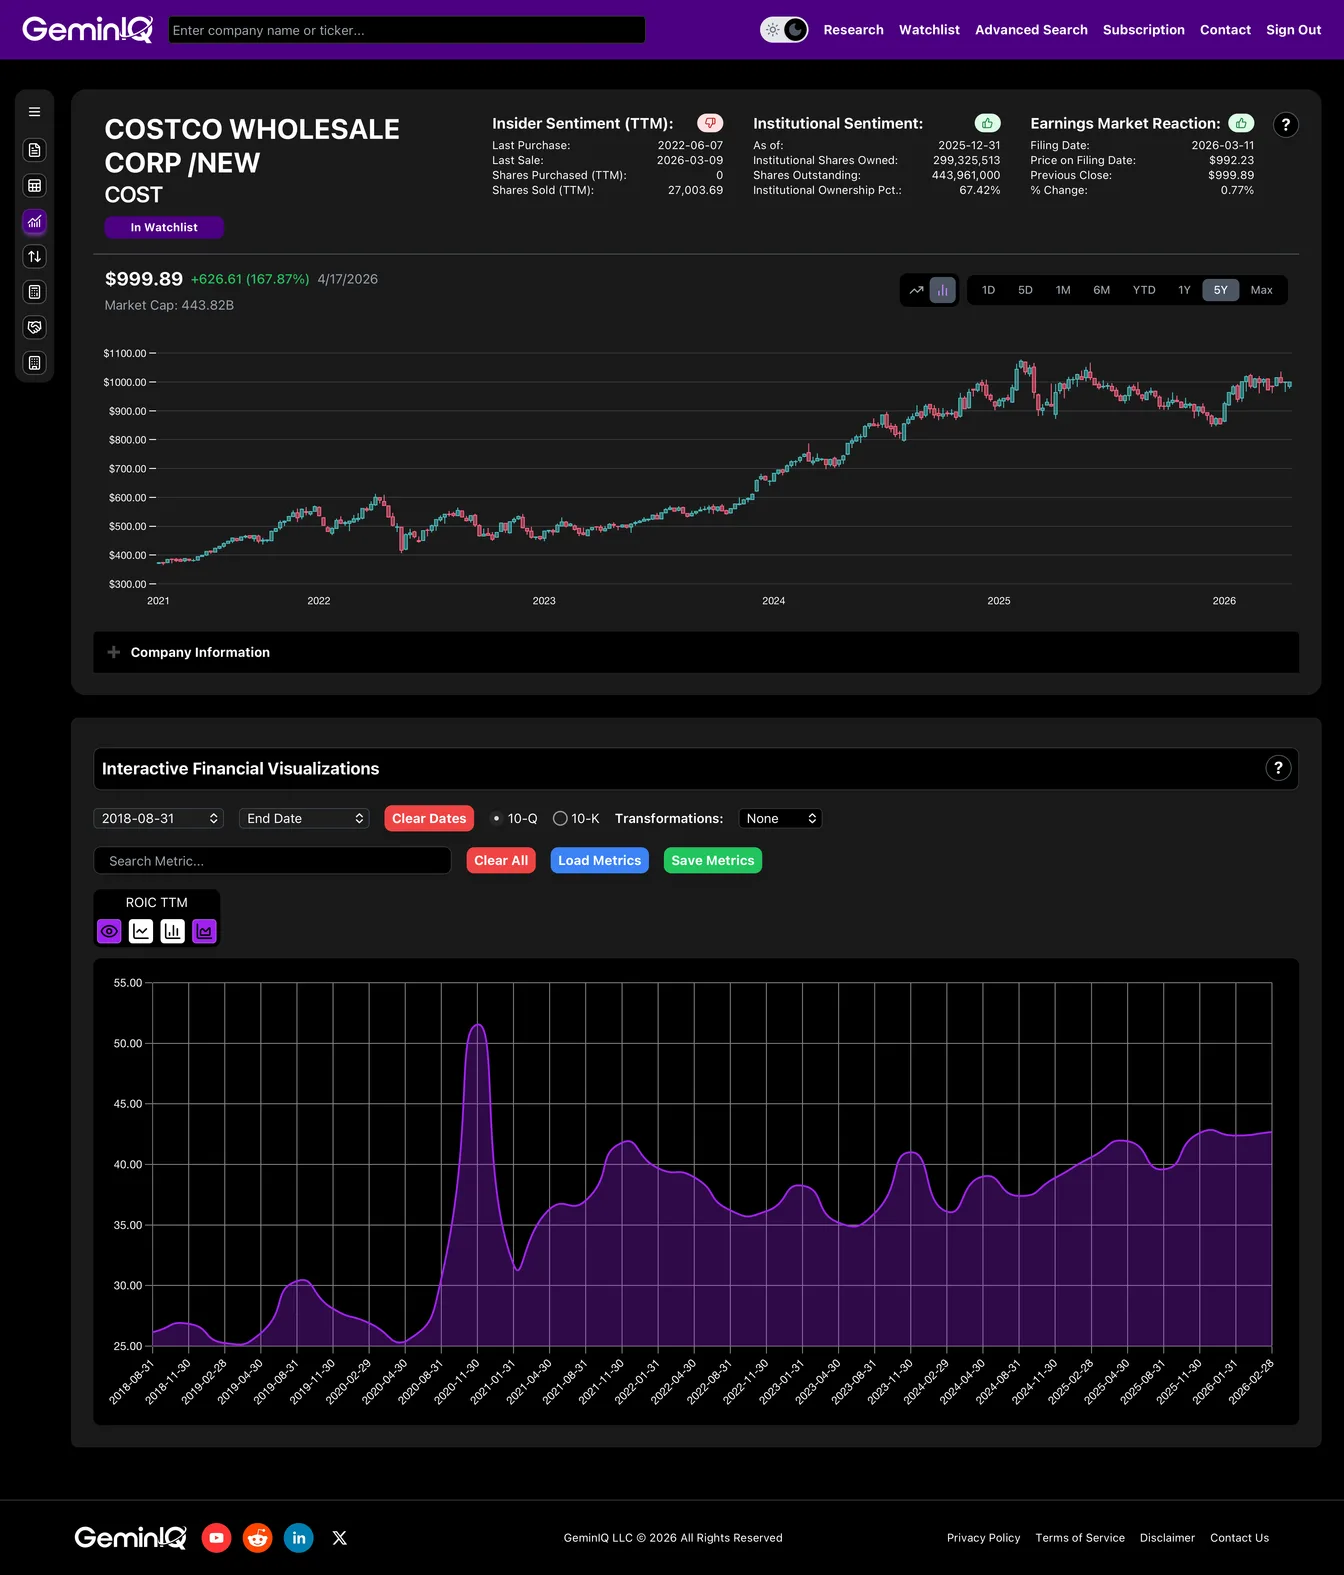
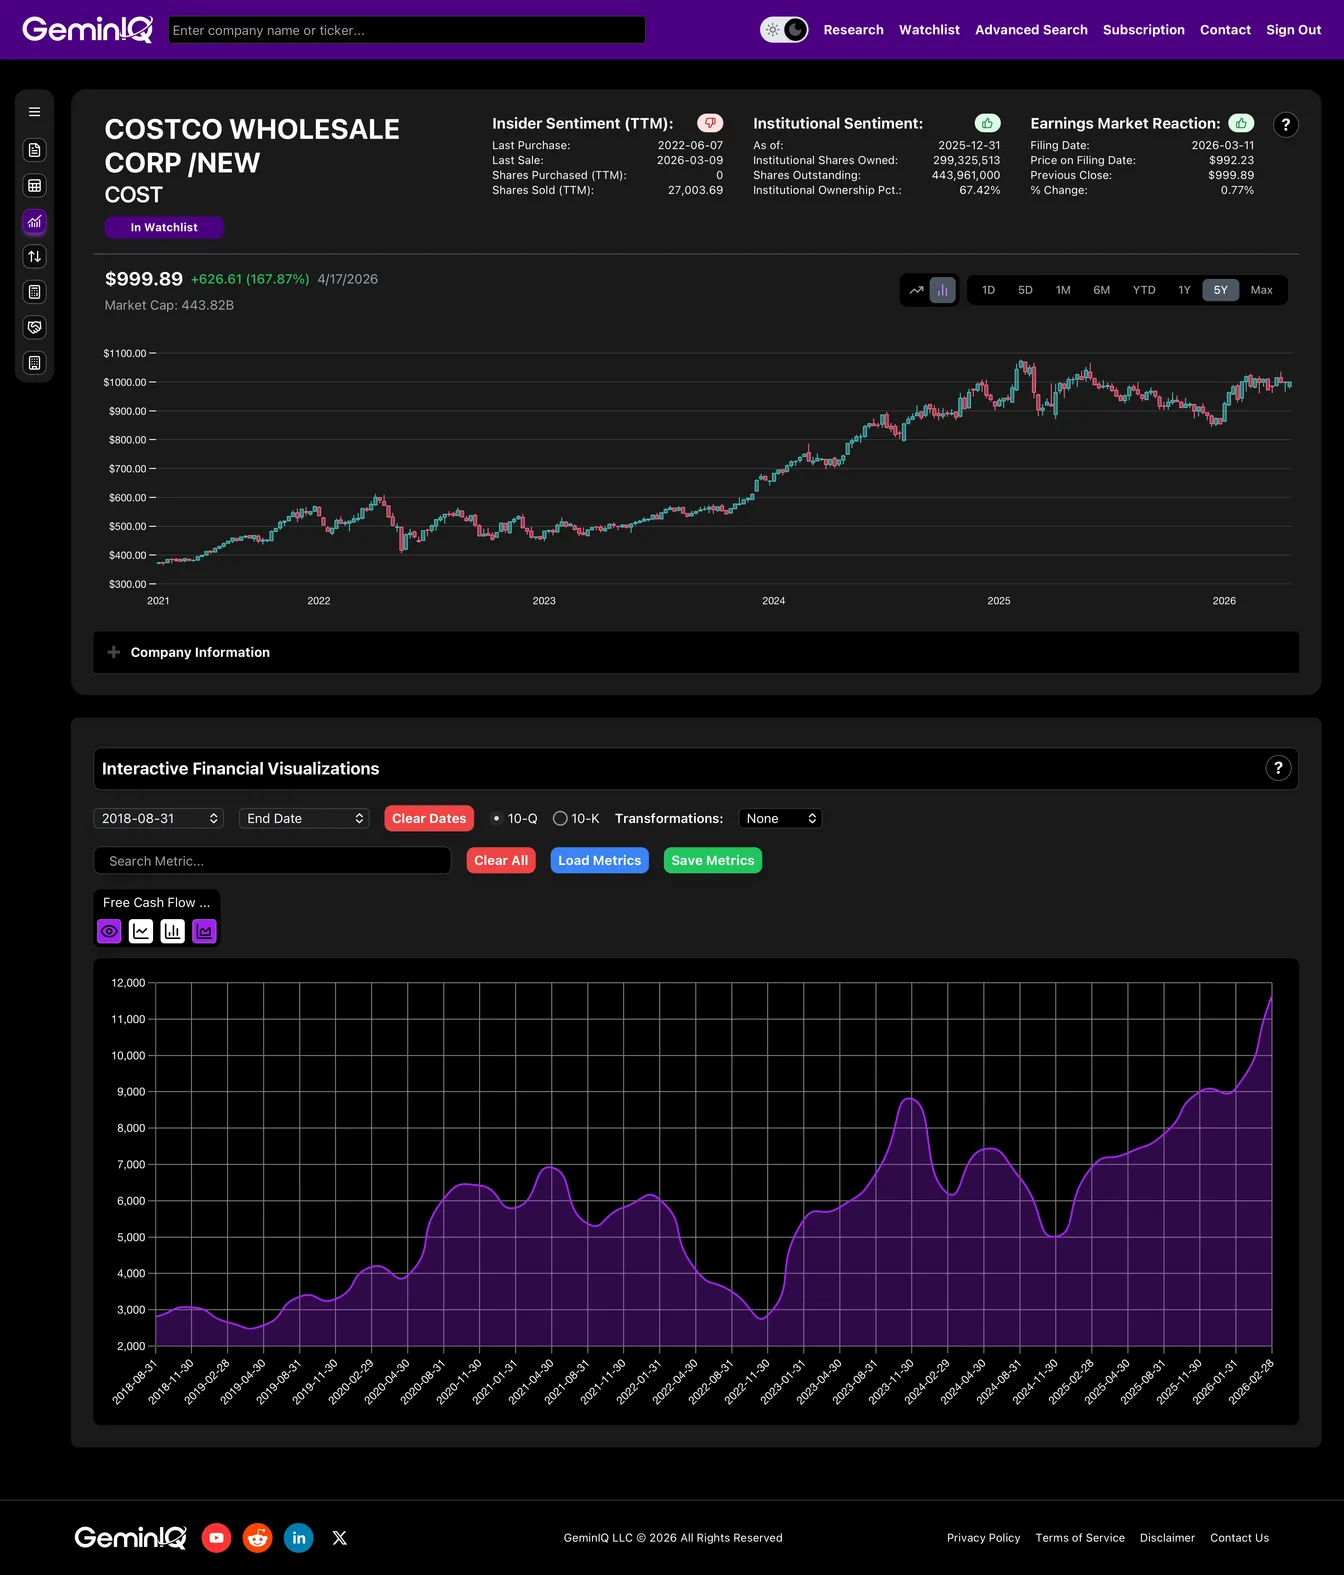
The Data: Using GeminIQ's raw balance sheet and income statement, Costco is operating on roughly $20 Billion in Invested Capital while generating a TTM Return on Invested Capital of 42.68%. Return on Equity comes in at 29.32%. For context, that ROIC beats Microsoft, crushes Walmart, and rivals the capital efficiency of software-only businesses. The visualization shows ROIC has been running consistently in the 35-45% range for years, with a pandemic-era spike above 50% in late 2020 when inventory turned at a historic pace.
The GeminIQ Edge: Standard aggregators show you the 3.76% operating margin and ignore the capital base. By auditing raw NOPAT against Invested Capital in GeminIQ's Interactive Financial Visualizations, we can see exactly how the trick works: Costco doesn't need much capital because the members are funding the operation. Suppliers are paid on 30+ day terms using inventory that already sold. Members pay upfront. The capital base stays microscopic relative to the revenue flowing through it.
The $3.1 Billion Float (Warren Buffett's Favorite Word)
So where does the ROIC come from? The balance sheet tells you exactly.
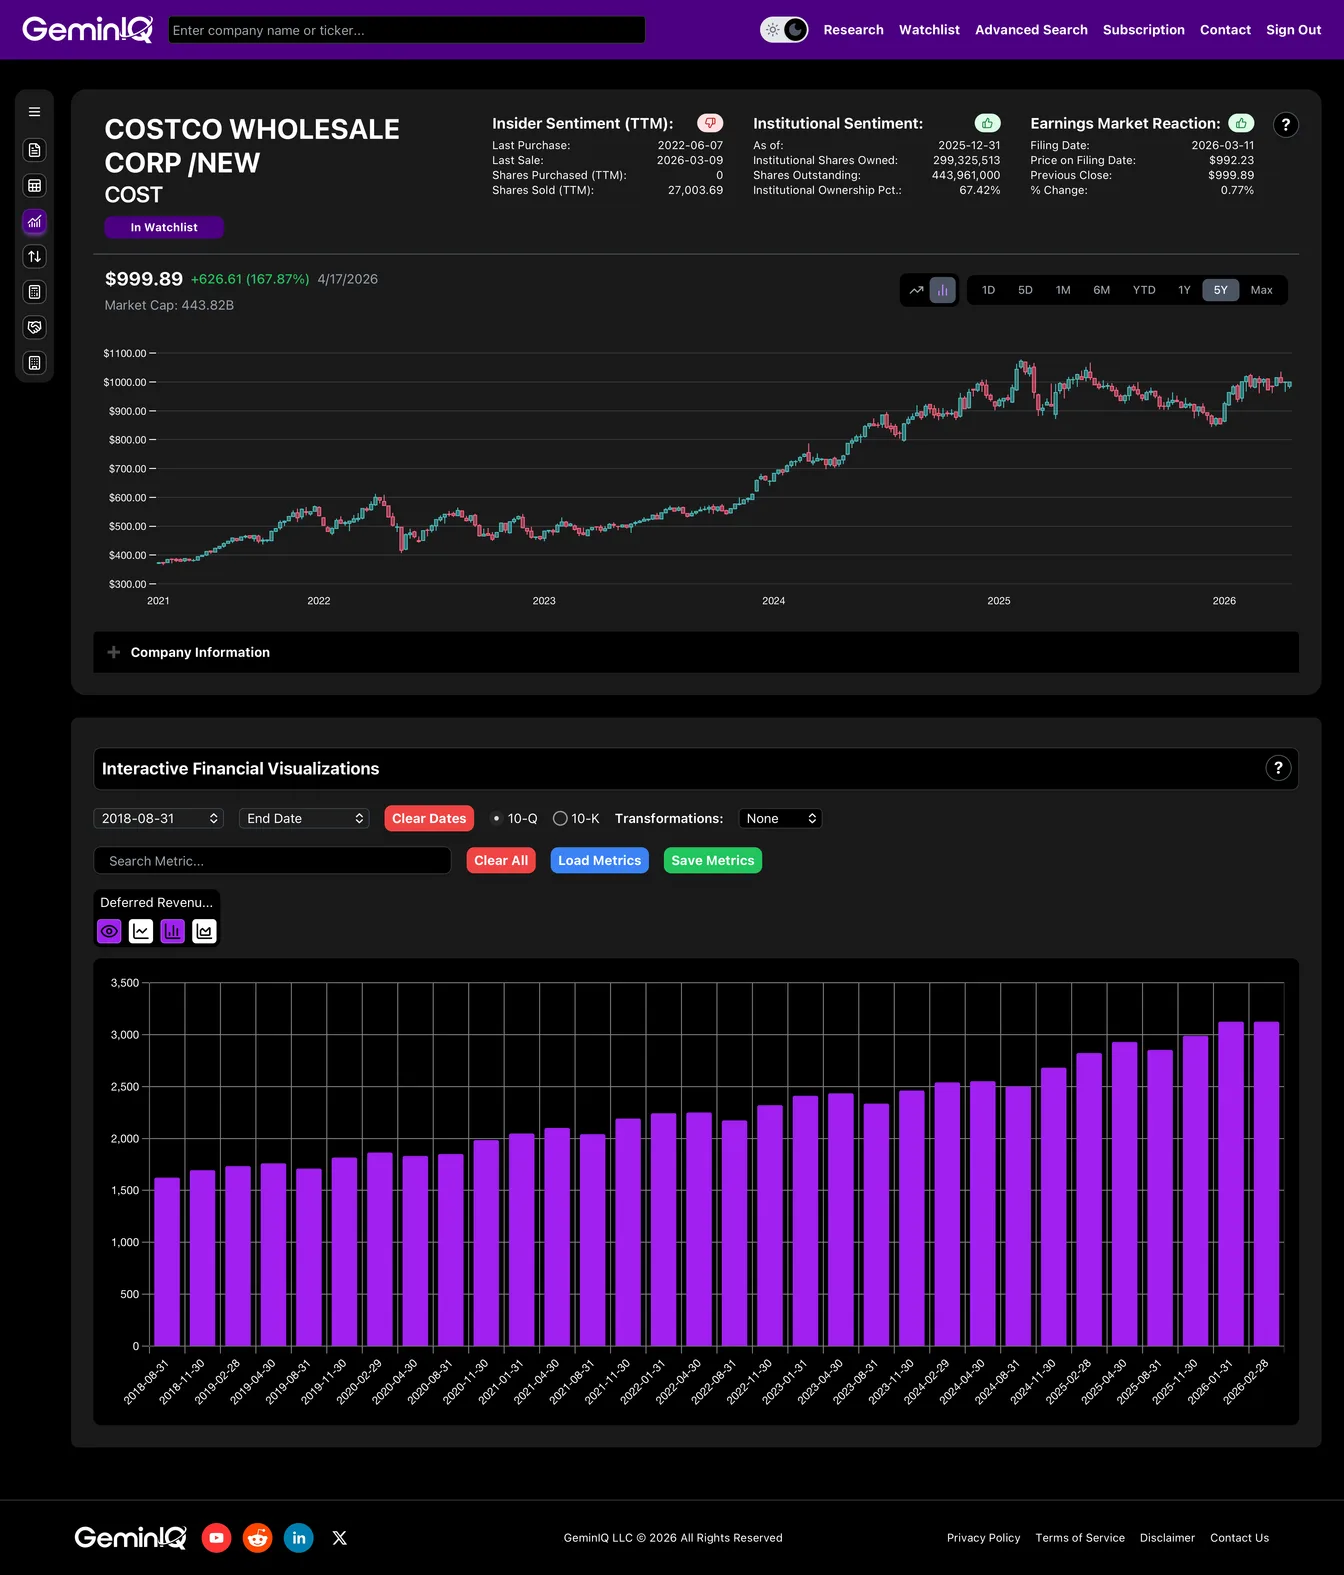
Scroll down the Q2 FY26 10-Q liabilities section and you find a line that most retail investors never click on: Deferred Membership Fees. This is the annual membership payment members have already handed over—in cash, upfront—that Costco has not yet recognized as revenue. It is, in accounting terms, a liability. In economic terms, it is free capital.
The Data: Deferred Membership Fees on the balance sheet have grown from roughly $1.6 Billion in FY2018 to $3.13 Billion in Q2 FY26. That is nearly a doubling of the interest-free cash float members are fronting to Costco over the last eight years. Every year, that pile grows. Costco earns interest on it sitting in Treasuries (contributing to the $589M in Interest Income on the TTM Income Statement) while the merchandise business breakeven pays for the staff and the lights.
The GeminIQ Edge: Most financial sites never surface deferred membership fees as a distinct metric. By auditing the raw Balance Sheet quarter-over-quarter in GeminIQ, you can see the float compound every single quarter for eight straight years. This is the same mechanism Warren Buffett describes when he praises insurance "float"—members are Costco's policyholders, and they just keep sending bigger checks.
The Cash Machine (Free Cash Flow)
The membership float doesn't just sit pretty on the balance sheet—it flushes through the cash flow statement in ways the GAAP P&L never captures.
The Data: Costco generated $11.64 Billion in Free Cash Flow TTM through Q2 FY26, well above its $8.68 Billion in reported Net Income. The cash flow materially exceeds the accounting earnings because of two factors the screeners miss: the growing deferred membership liability and the payables float on inventory.
The GeminIQ Edge: Pull the raw Operating Cash Flow against Capital Expenditures and the ratio tells the story. Retailers traditionally convert 60-70% of net income to free cash flow because of CapEx burdens and inventory builds. Costco is converting at 134% of Net Income to FCF. That's software-economics cash conversion on a hard-goods retailer balance sheet.
Timing the Entry (The Q2 10-Q Pattern)
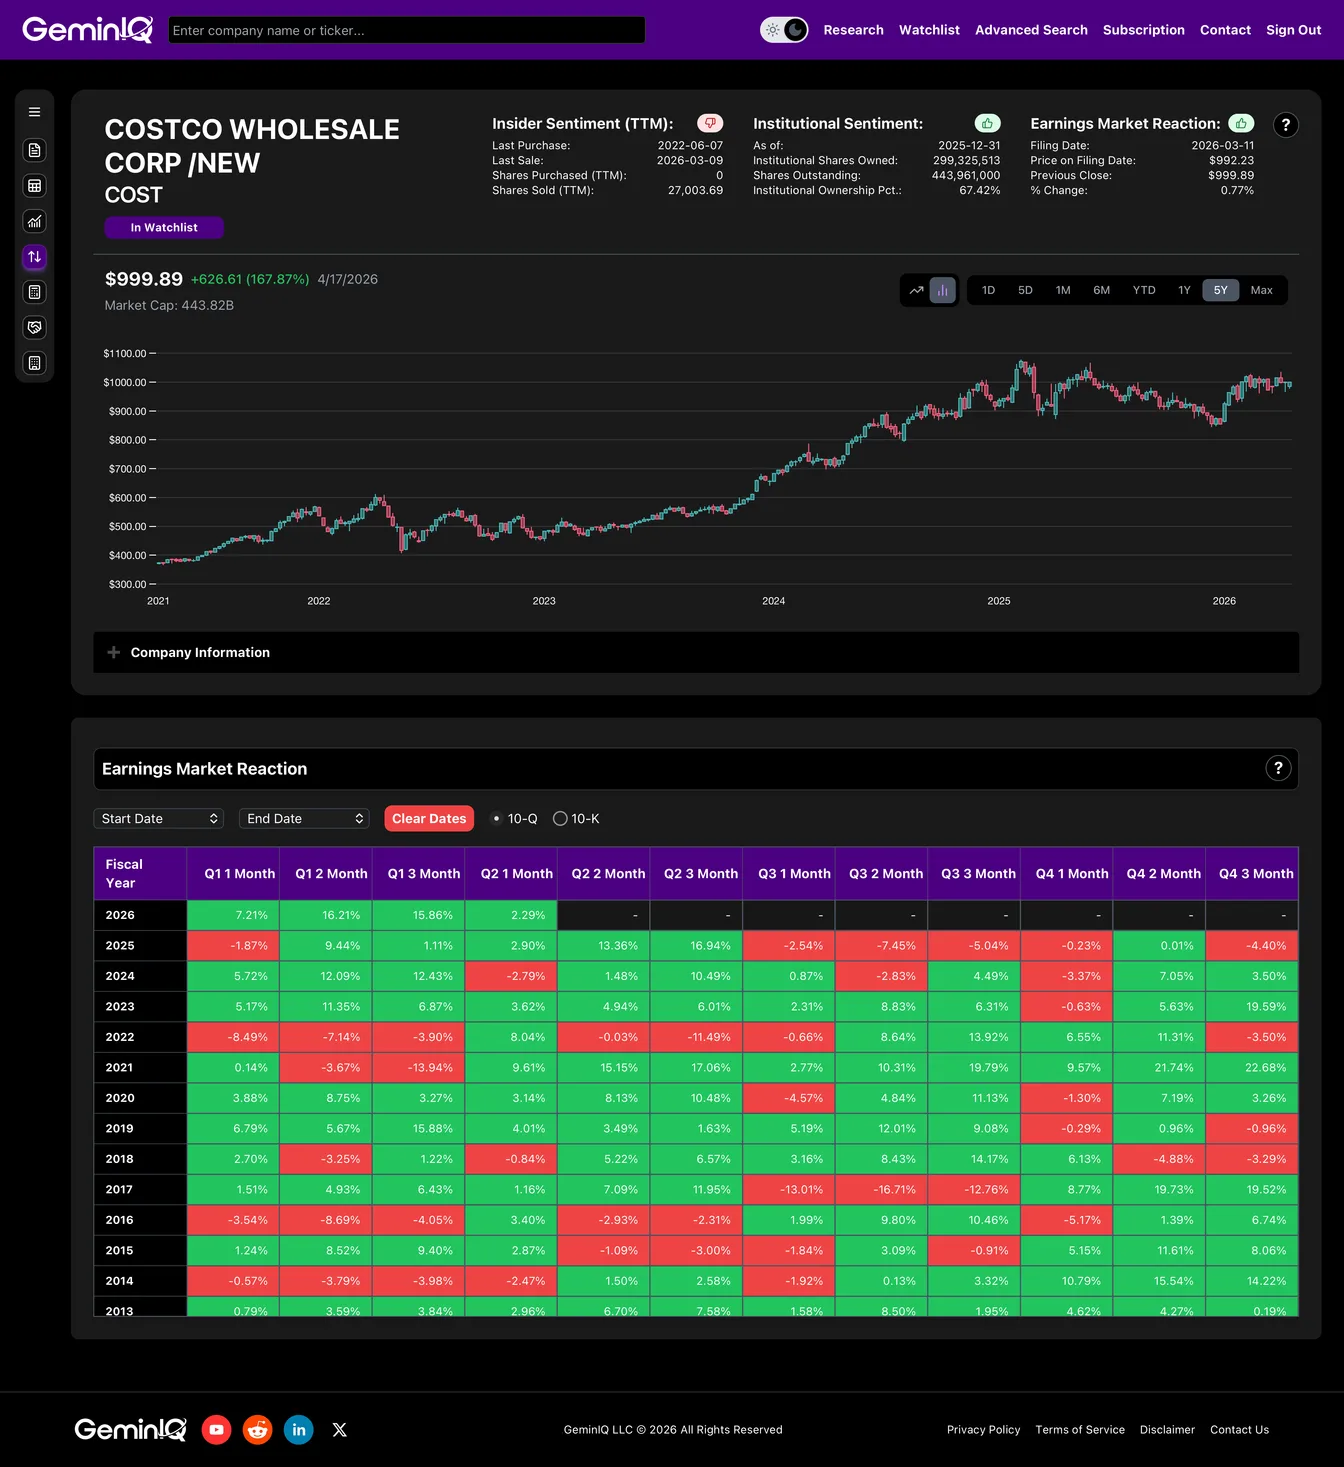
So should you buy $COST at an all-time high and a 51.7x P/E? The price tag looks expensive, but the Earnings Market Reaction Heat Map reveals a strong historical tailwind specifically for the Q2 filing.
The Data: Over the last 5 years, Costco's Q2 10-Q has been one of the most consistently positive filings on the calendar. The stock averages +3.94% in Month 1, +6.98% in Month 2, and +7.80% in Month 3 after the Q2 filing drops. This current cycle (March 11, 2026 filing) is already tracking the pattern with a +2.29% move in Month 1.
Strategy suggests the Q2 filing historically acts as a catalyst rather than a "sell the news" event—likely because the data captures holiday-period member renewals, which is the single most important number in the entire Costco thesis. Waiting for a broader market dip is reasonable at 51x earnings, but historical data does not support the "overvalued, wait forever" playbook. The cash machine keeps compounding regardless of the multiple.
The Insider Exit (The One Red Flag)
The thesis is strong, but a good analyst never ignores the reality check. What are the people actually running Costco doing with their own money?
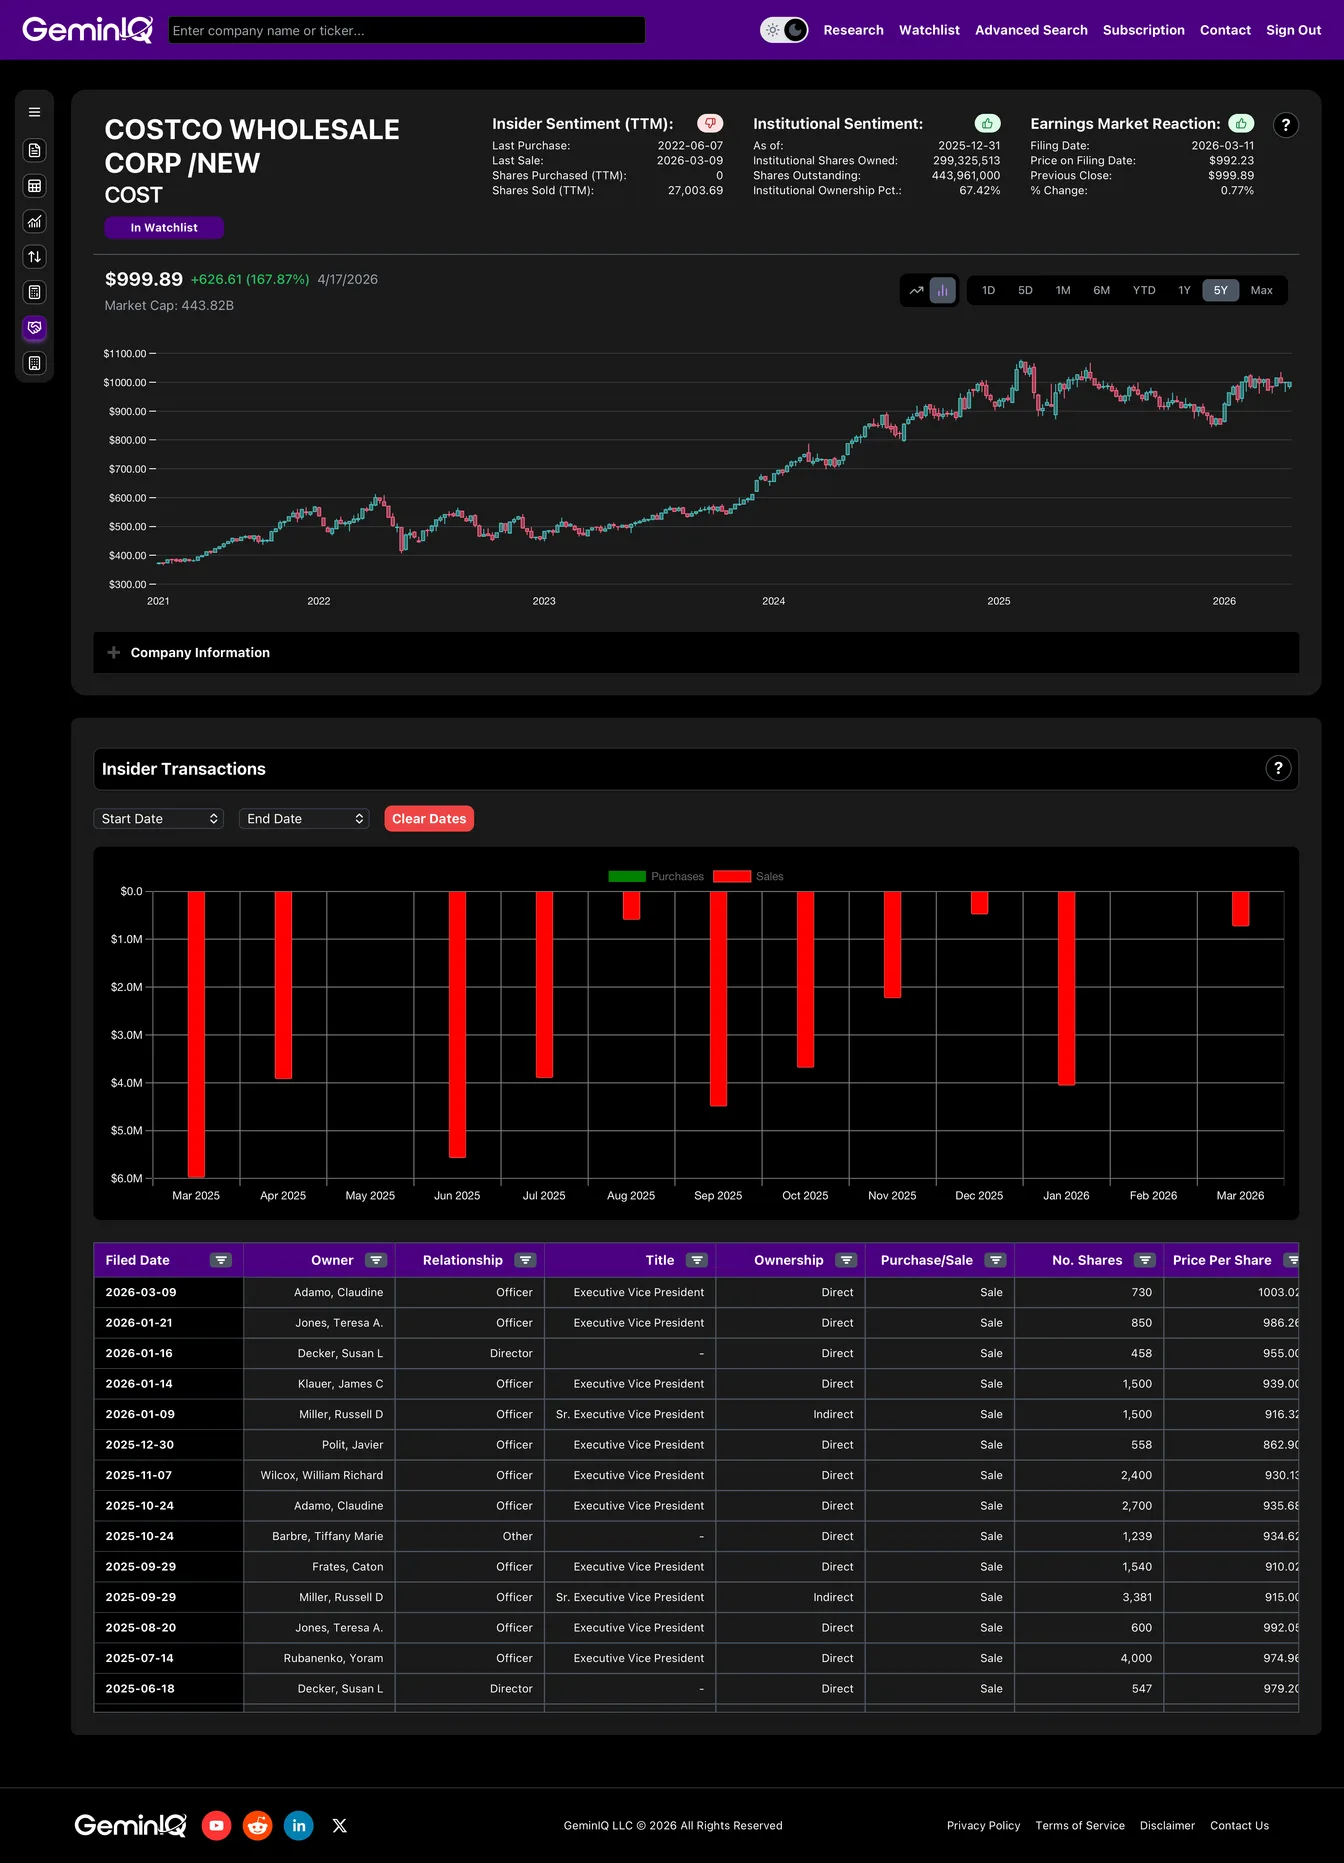
The Data: GeminIQ's raw Form 4 feed shows that since the stock crossed $900, Costco insiders have executed an uninterrupted stream of sales transactions against zero open-market purchases. EVP-level selling dominates the tape: Adamo (multiple sales at $935-$1,003), Miller (3,381 shares at $915 and 1,500 more at $916), Klauer (1,500 shares at $939), Wilcox (2,400 shares at $930), Rubanenko (4,000 shares at $975), and Jones across multiple filings.
The GeminIQ Edge: Looking at the 10-year insider history, Costco insiders have always sold more than they buy (standard behavior for a mature mega-cap with heavy RSU compensation). But the pace since the stock crossed $900 is notable—zero green "Buy" bars on the chart, unbroken red "Sale" bars every month. At 51.7x earnings, the people with the clearest view of the business are cashing out—not betting against the business, but refusing to add conviction at the price.
The Institutional Accumulation (Smart Money Quietly Crowding In)
One final data point that gets ignored by the mainstream narrative: while insiders are selling, institutions are doing the opposite.
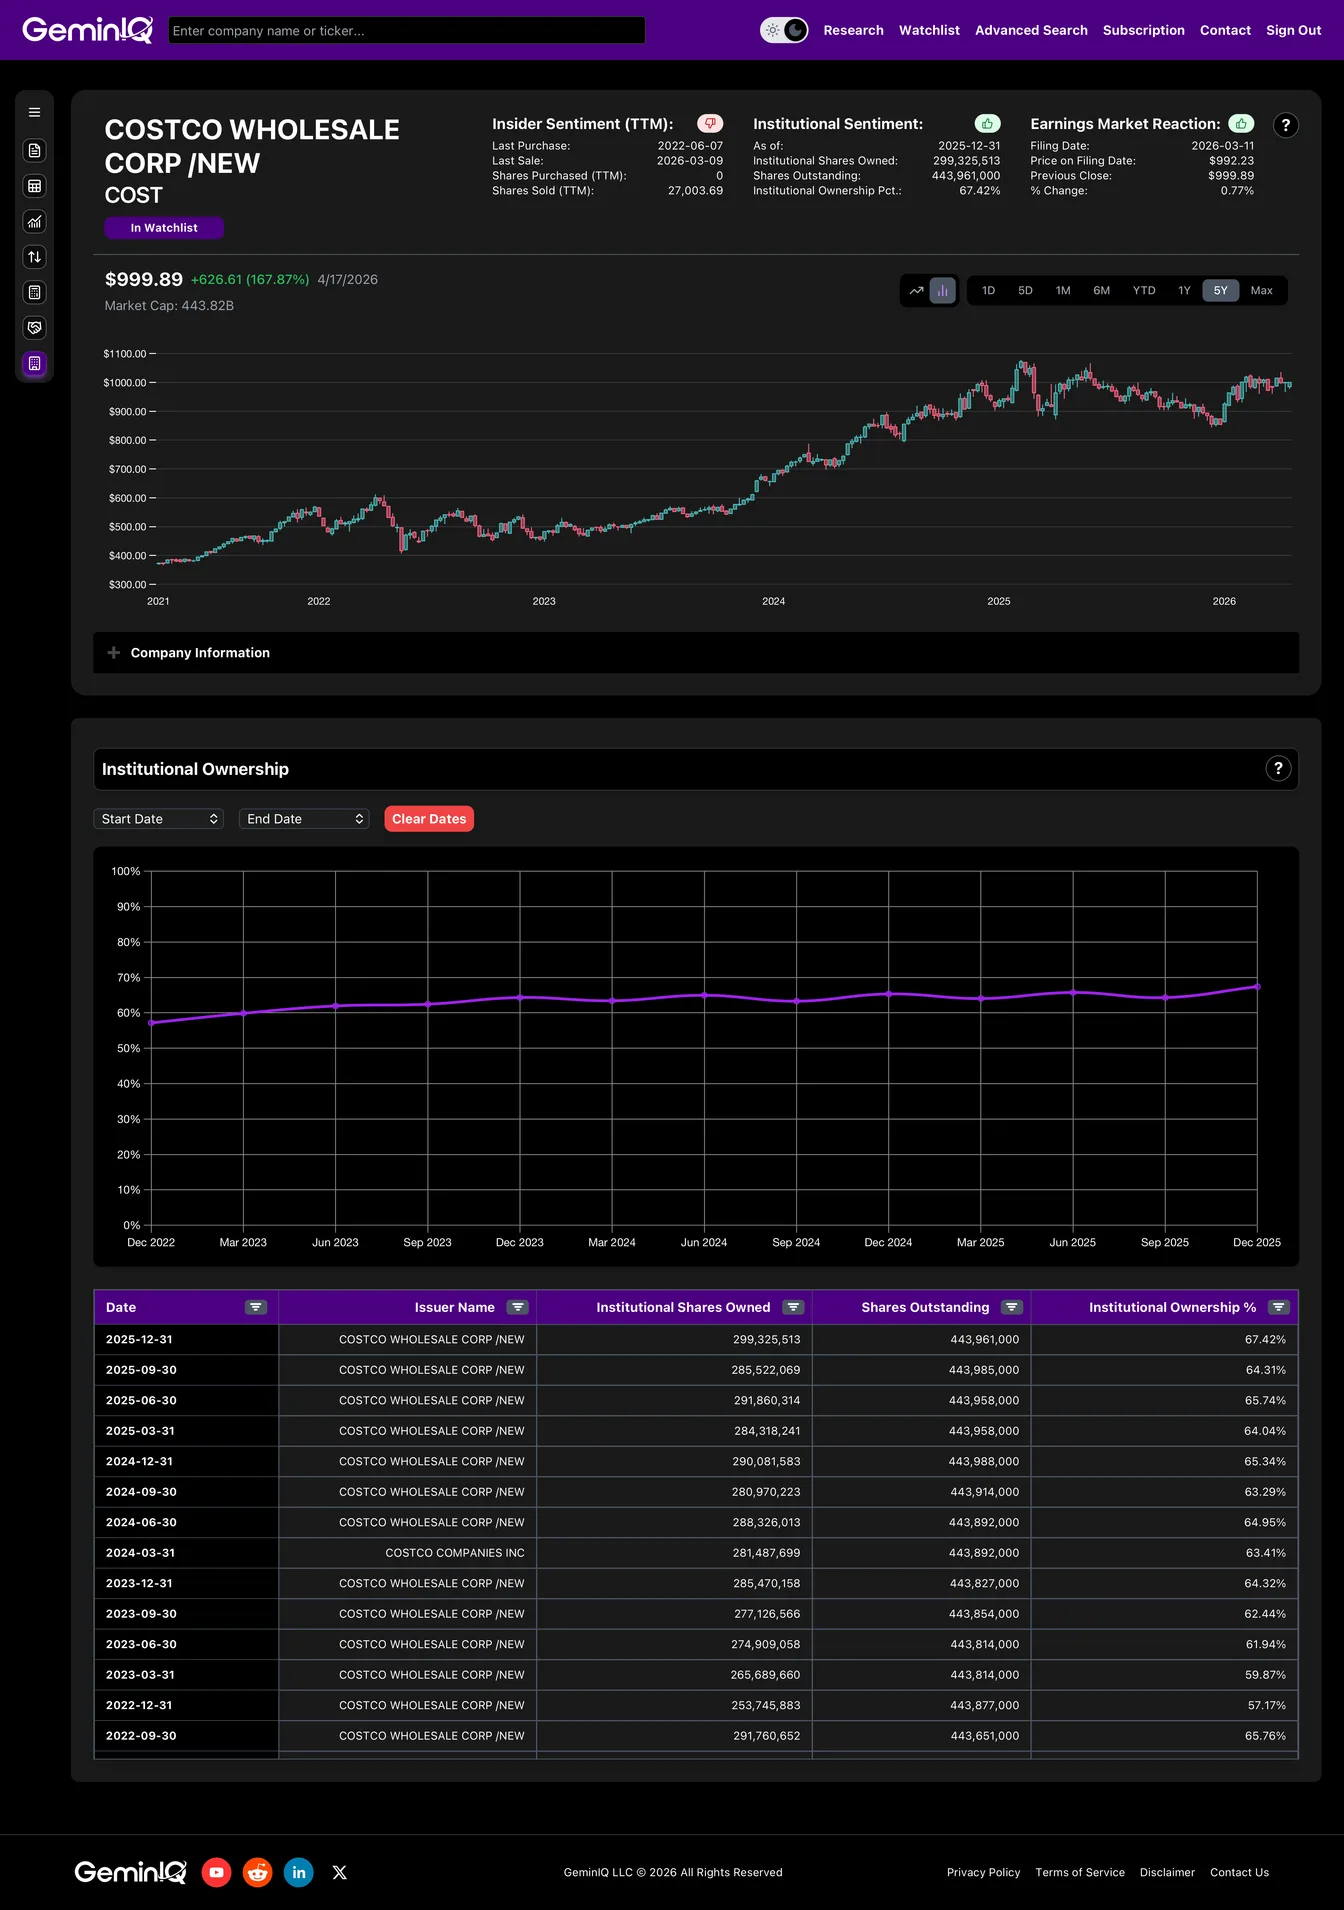
The Data: GeminIQ's 13F Institutional Holdings tracker shows total institutional ownership has climbed from roughly 57% in late 2022 to 67.42% at the December 2025 filing deadline—a steady, multi-year accumulation into the stock. Over the same window, share count has been essentially flat, meaning this is genuine net buying, not passive index flow from share issuance.
The GeminIQ Edge: Standard financial sites only display the most recent percentage—they don't show you the trajectory. By auditing the 13F holdings quarter-by-quarter in GeminIQ, we can see the divergence: insider EVPs are taking chips off the table while 13F filers have quietly added 46 million shares over three years. For comparison, mega-cap peers like Delta (83%) and United (86%) carry higher absolute institutional ownership, but very few of them show Costco's sustained accumulation pattern at these valuations. Smart money is still buying a 51x P/E grocer. That's worth paying attention to.
Research faster. Invest smarter.
Most financial websites rely on third-party aggregators that simplify or process data before you ever see it. We built GeminIQ because we believe you deserve a better fundamental analysis tool—one that goes beyond basic price charts and processed numbers. We extract our data directly from SEC 10-K and 10-Q filings to ensure that when you look at a balance sheet or a cash flow statement, you are seeing the numbers exactly how the company reported them. Our goal is to give you the tools to verify the narrative for yourself using clean, traceable data. Start researching now at GeminIQ.com.
Disclaimer: The content in this blog is for educational and entertainment purposes only and does not constitute financial, legal, or tax advice. Investing involves risk, including the loss of principal. The views expressed are my own and not intended as financial advice or a guarantee of future performance.