Airline Sector Stock Analysis: Altman Z-Score Stress Test for Delta, United, and American (2026)
By Chad Hartman
Published April 8, 2026 · Last updated June 14, 2026
If you are evaluating the airline sector in 2026, you already know the market is facing a massive "standards reset." With corporate travel budgets tightening and consumers becoming hyper-selective with their discretionary income, top-line revenue is rapidly becoming a vanity metric.
But how do you spot the real winners when mature companies are all operating in the exact same, highly cyclical macroeconomic environment?
Welcome to the airline sector. When you look at giants like Delta Air Lines (DAL), United Airlines (UAL), and American Airlines (AAL), their core business models are practically identical. To find the alpha in a capital-heavy industry, you aren't analyzing for growth; you are analyzing for survival. You can't just look at high-level valuations; you have to run a strict stress test on their balance sheets.
Here is how a real analyst uses GeminIQ to strip away the PR spin, uncover the debt bloat, and rank the airline titans.
Phase 1: The Valuation Disconnect
Investing in a vacuum is a massive risk. In GeminIQ, our workflow starts by creating a custom Watchlist to aggregate Delta, United, and American Airlines side-by-side.
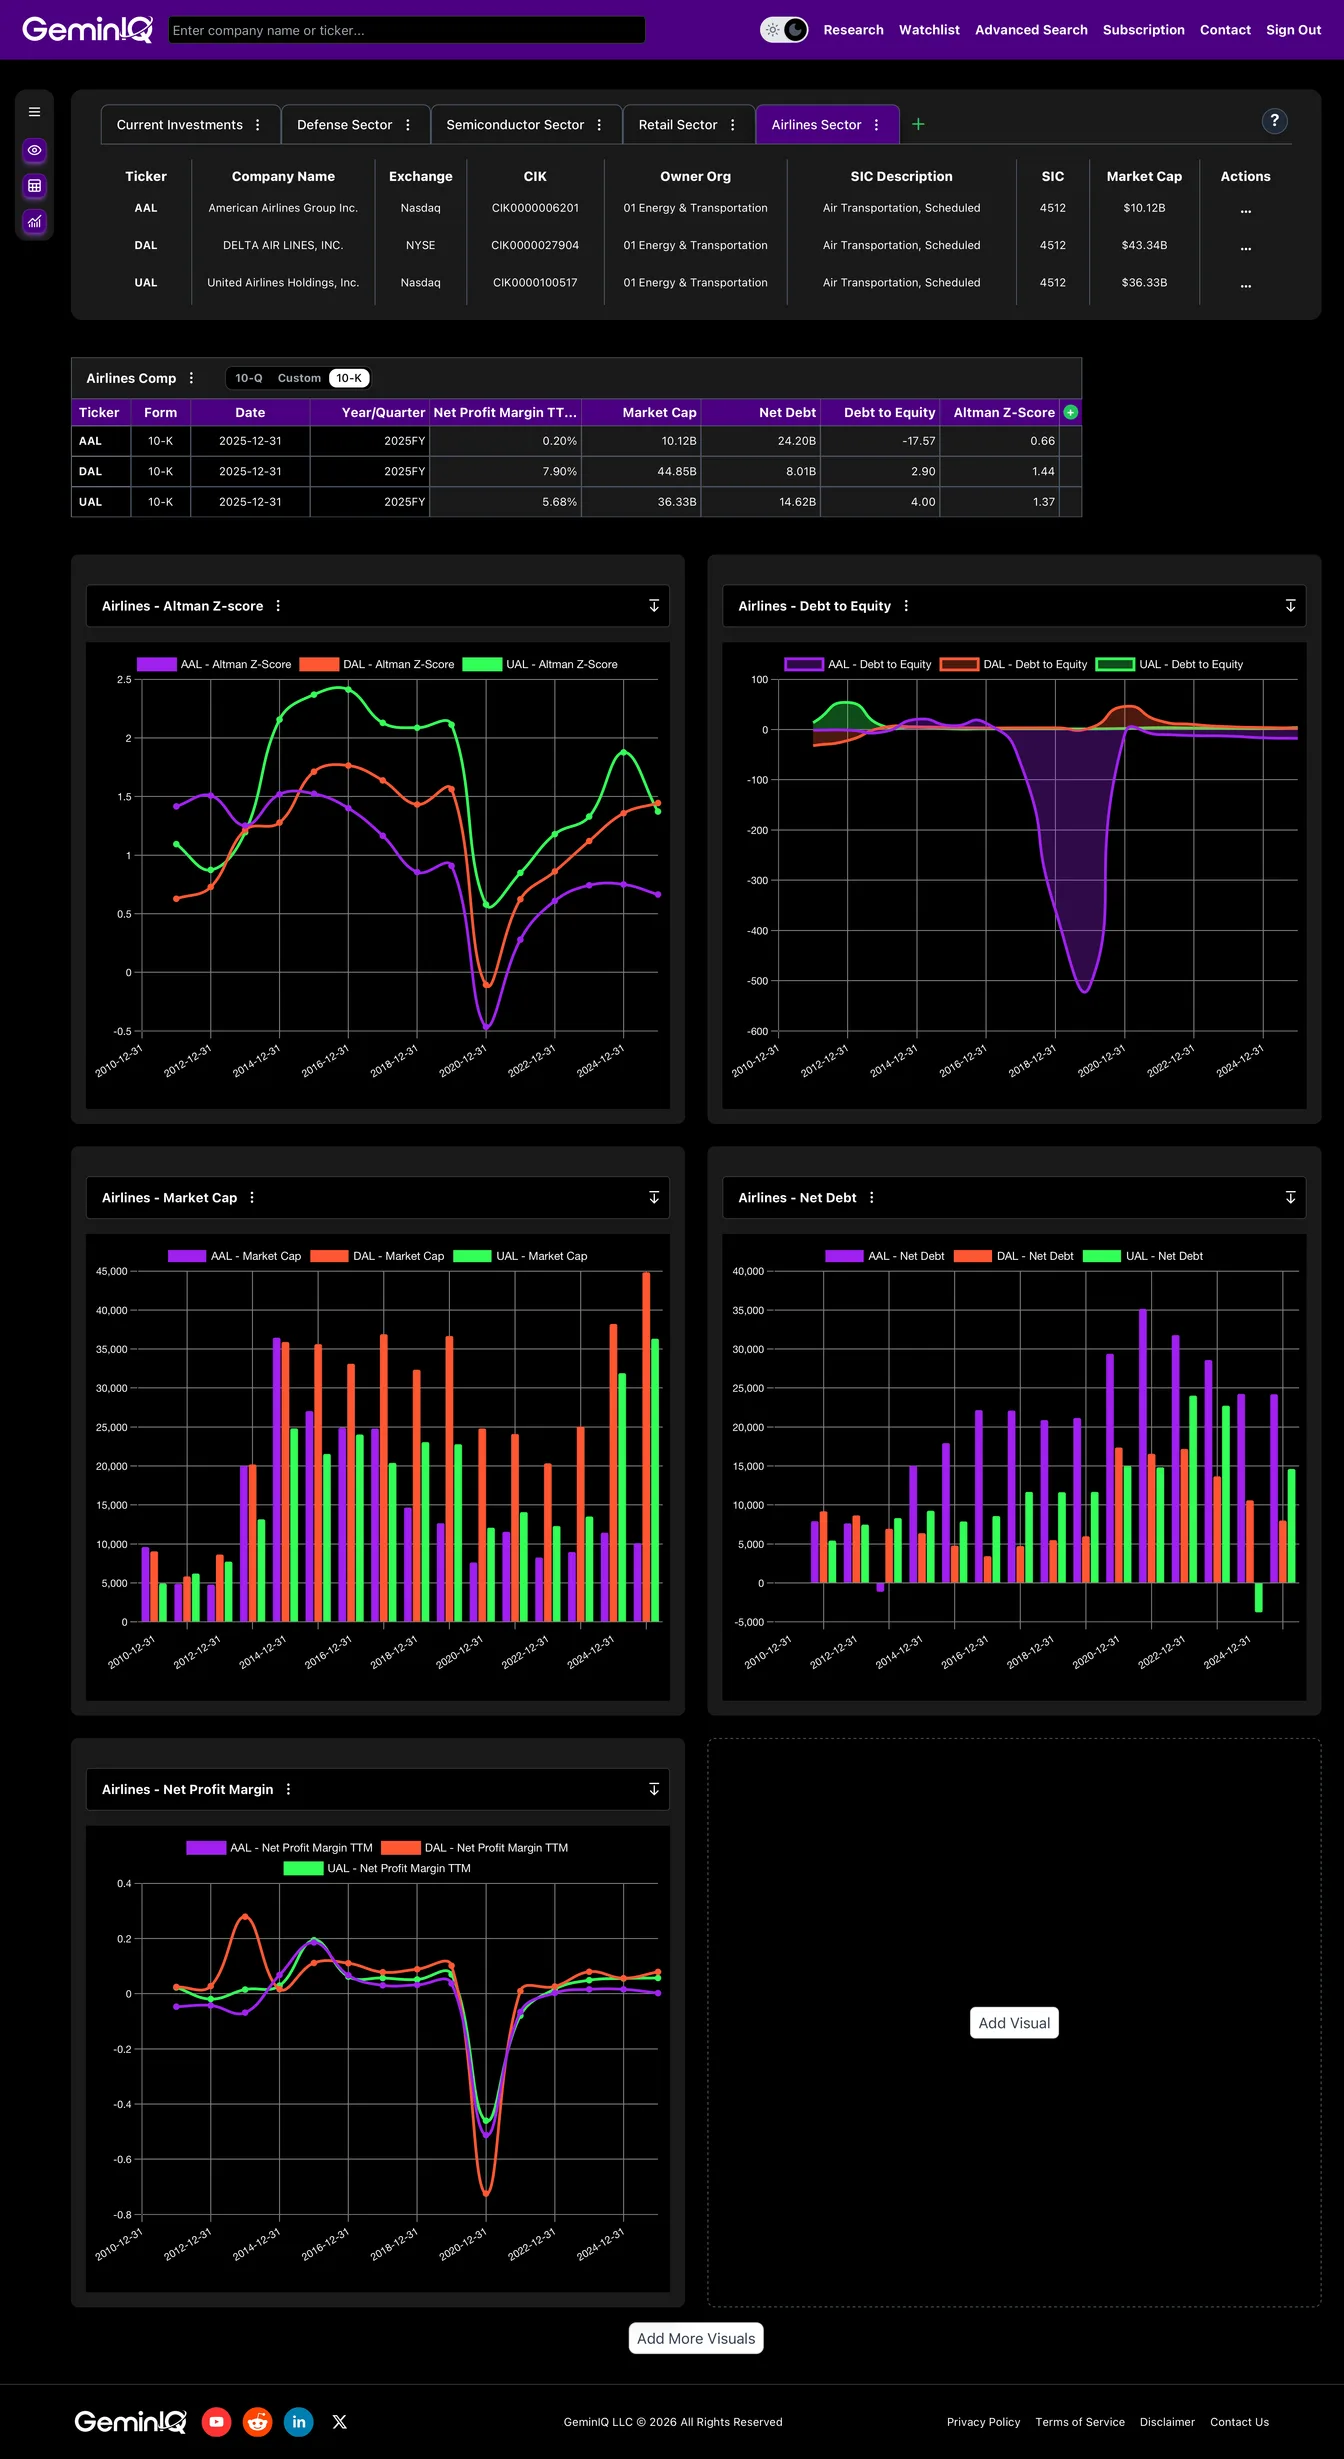 GeminIQ custom Watchlist displaying Delta (DAL), United (UAL), and American Airlines (AAL) side-by-side.
We start by pulling up the Calculated Metrics tab to compare fundamental performance. Immediately, a massive disconnect emerges in how the market is valuing these operations:
- The Leaders: At the end of 2025, Delta led the pack with a commanding $44.85 billion market cap, fueled by a healthy 7.90% net profit margin. United follows closely with a $36.33 billion valuation and a 5.68% margin.
- The Value Trap: American Airlines stands out entirely. It is trading at a heavily discounted $10.12 billion market cap, barely scraping by with an anemic 0.20% net profit margin.
 GeminIQ custom comps table.
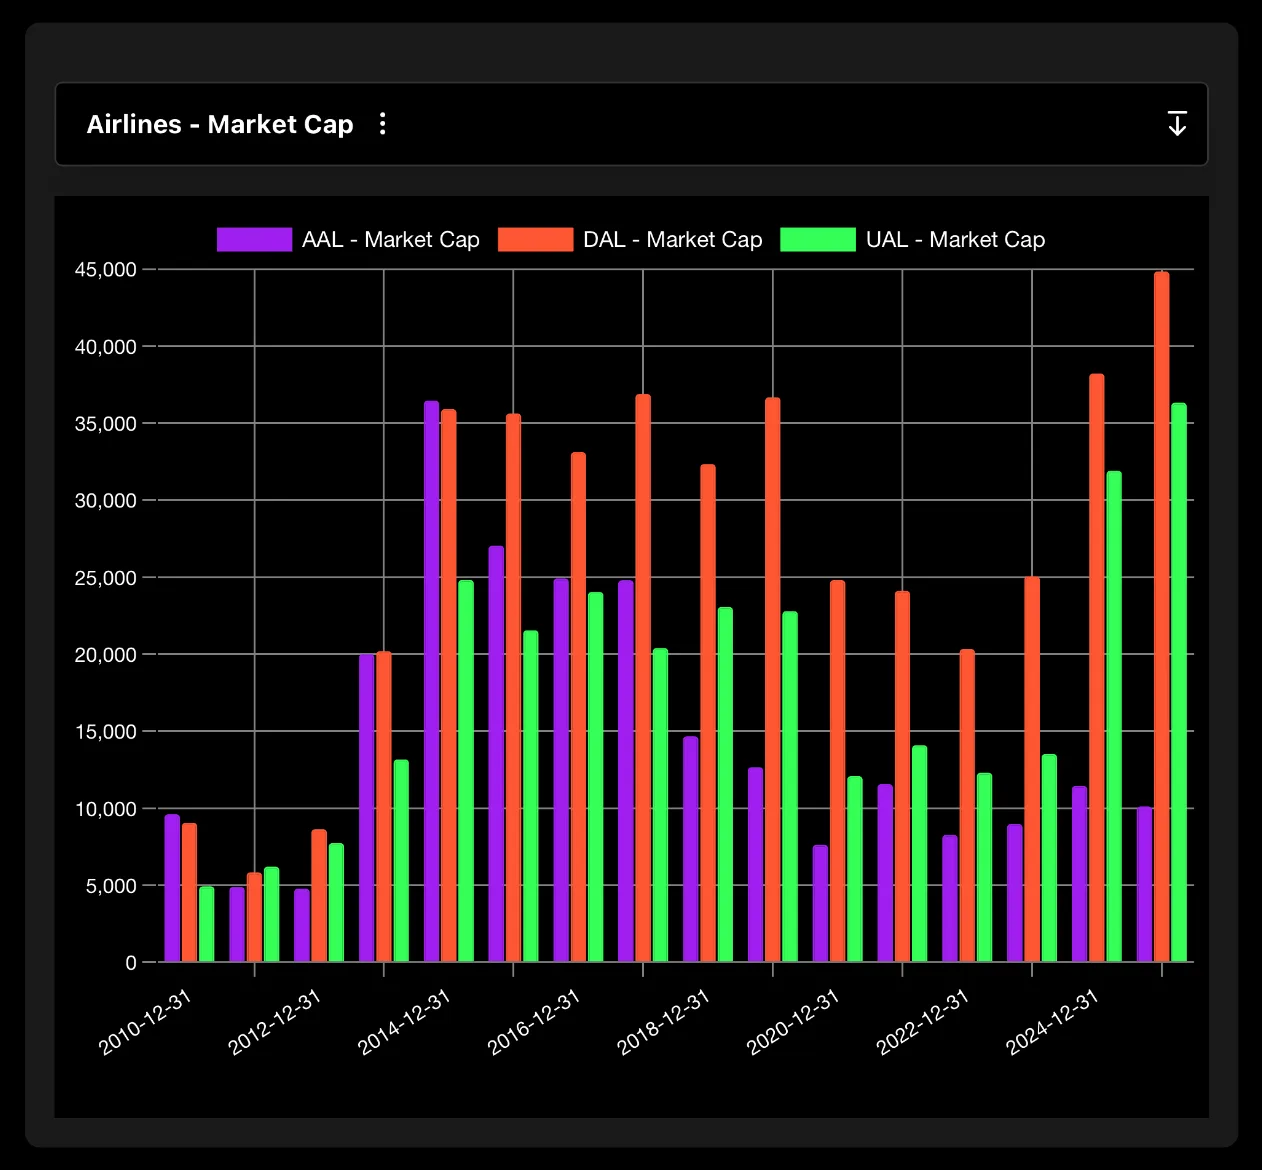 GeminIQ calculated metrics showing Market Cap across the airline tickers.
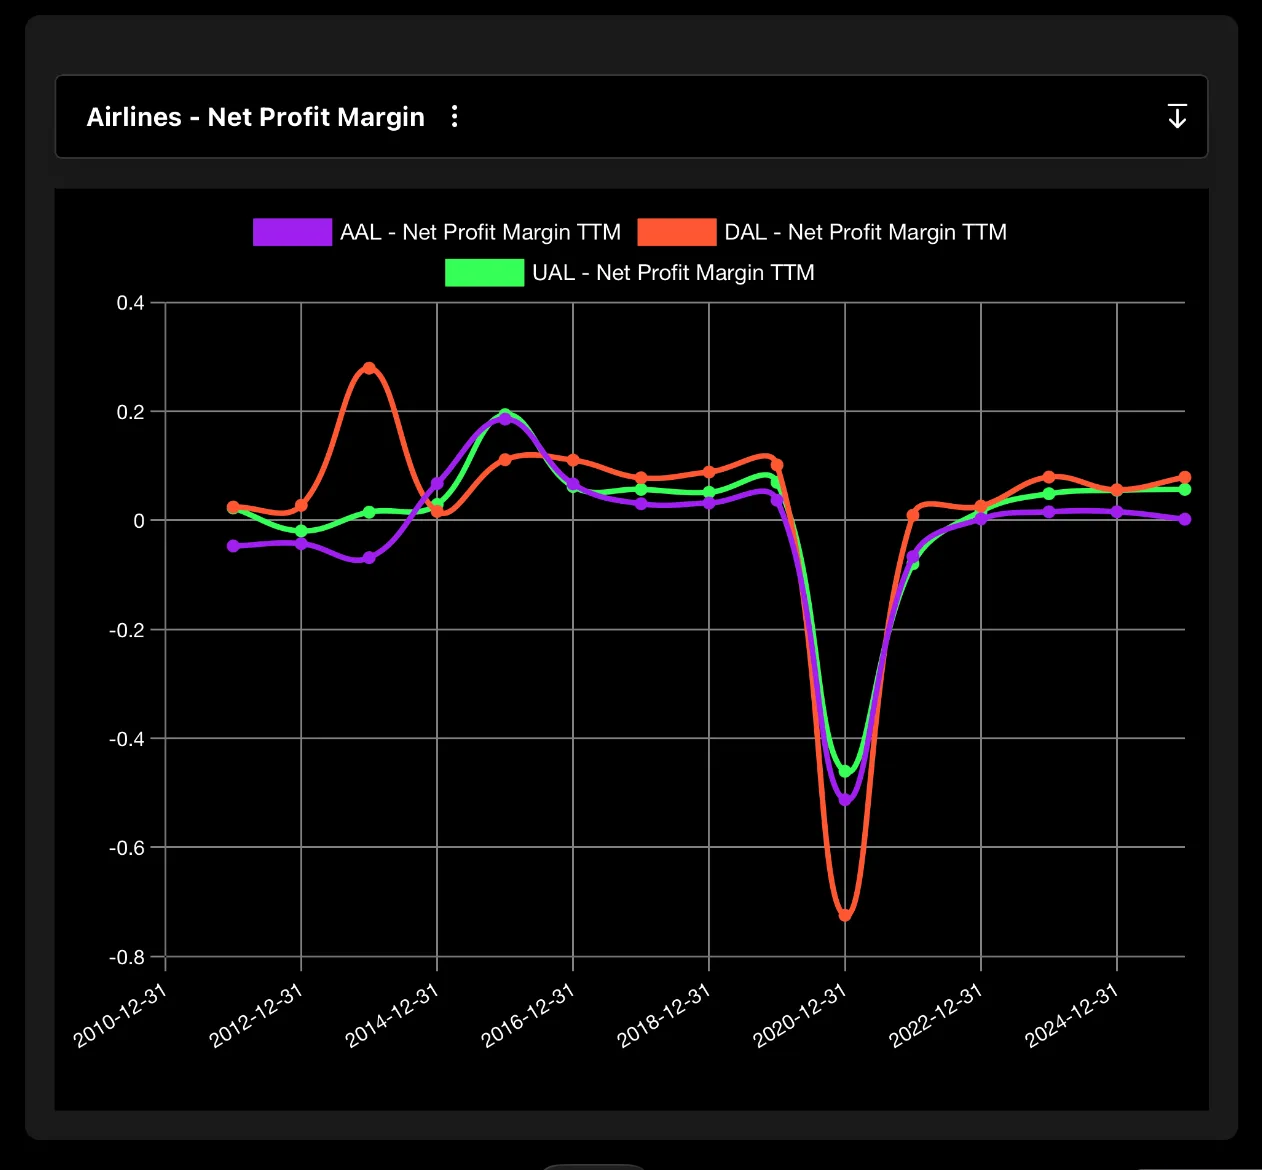 GeminIQ calculated metrics showing Net Profit Margin (TTM) across the airline tickers.
If we only looked at a standard stock screener, a novice investor might assume American Airlines is a highly discounted "value play" waiting for a rebound. But a good analyst knows that a heavily suppressed market cap usually means the market is pricing in a massive underlying liability.
Phase 2: The Debt Bloat
We pivot our dashboard away from profitability and look at capital structure. In the airline industry, planes are financed with massive amounts of leverage. By looking at the Net Debt and Debt-to-Equity ratios, the reason for American Airlines' discounted valuation becomes terrifyingly clear.
- Delta & United: Delta and United are managing their capital responsibly. Delta carries just $8.01 billion in net debt, operating with a manageable 2.90 Debt-to-Equity ratio. United carries $14.62 billion in net debt (a 4.00 Debt-to-Equity ratio).
- The Laggard: American Airlines is operating with a completely broken capital structure. American Airlines is sitting on a staggering $24.20 billion in net debt. Worse, they have completely wiped out their equity base, operating with negative equity. Because their equity is less than zero, their Debt-to-Equity calculation breaks the model entirely, registering at a highly distressed -17.57.
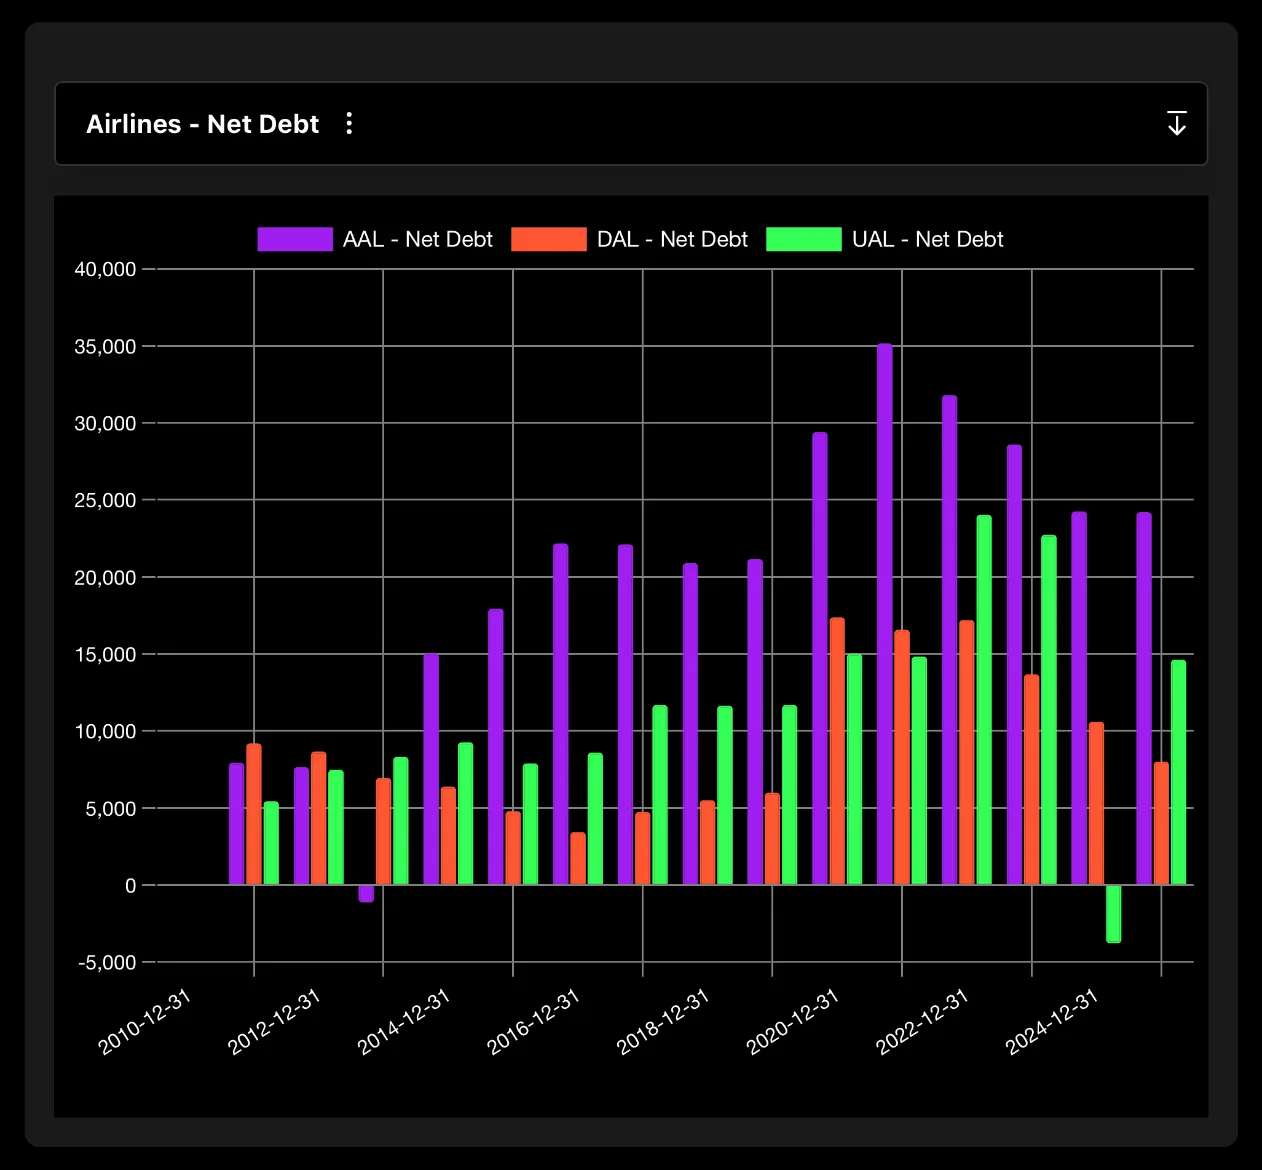 GeminIQ custom view comparing Net Debt across the airline tickers.
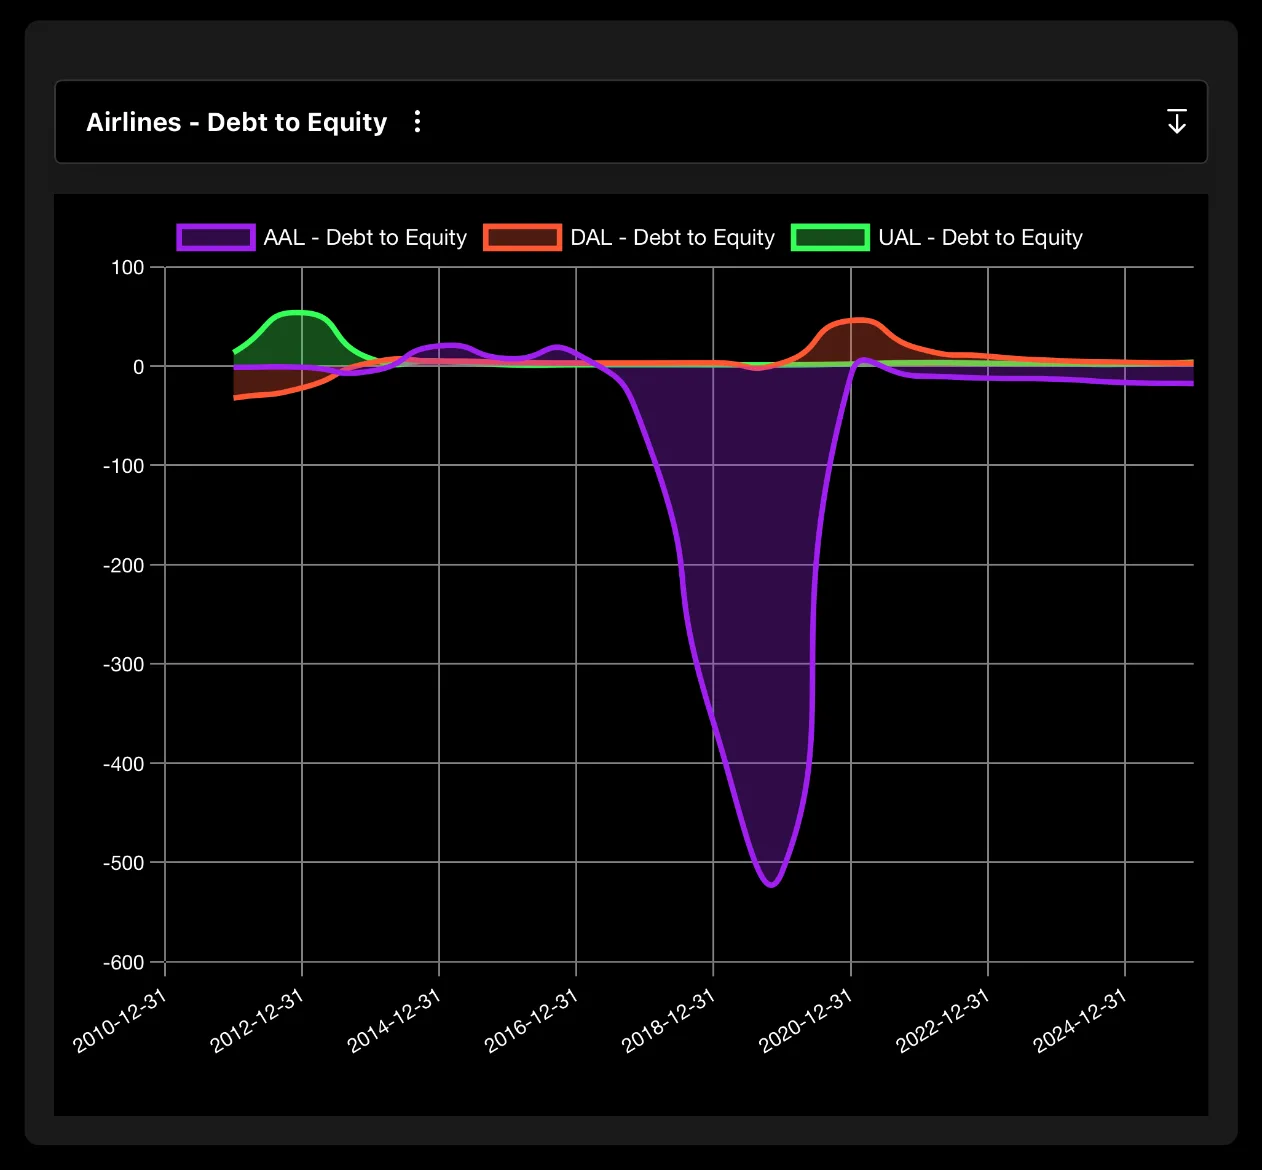 GeminIQ custom view comparing Debt-to-Equity ratios across the airline tickers.
American Airlines isn't just flying passengers; they are operating a highly leveraged debt vehicle trying to outrun its interest payments.
Phase 3: The Altman Stress Test
To see exactly how dangerous AAL's debt load is, we use GeminIQ to run an Altman Z-Score analysis.
The Altman Z-Score is a legendary financial model used to predict corporate distress. Any score above 3.0 is safe. A score between 1.8 and 3.0 is the "gray zone." Anything below 1.8 indicates severe financial distress and high risk.
- Delta and United: While the entire airline sector is capital intensive, Delta and United manage to keep their heads above water, posting Z-Scores of 1.44 and 1.37, respectively.
- American Airlines: American Airlines' model breaks down completely. Dragged down by massive liabilities and negative retained earnings, American Airlines posts an abysmal 0.66 Z-Score, placing them deeply into the financial distress zone.
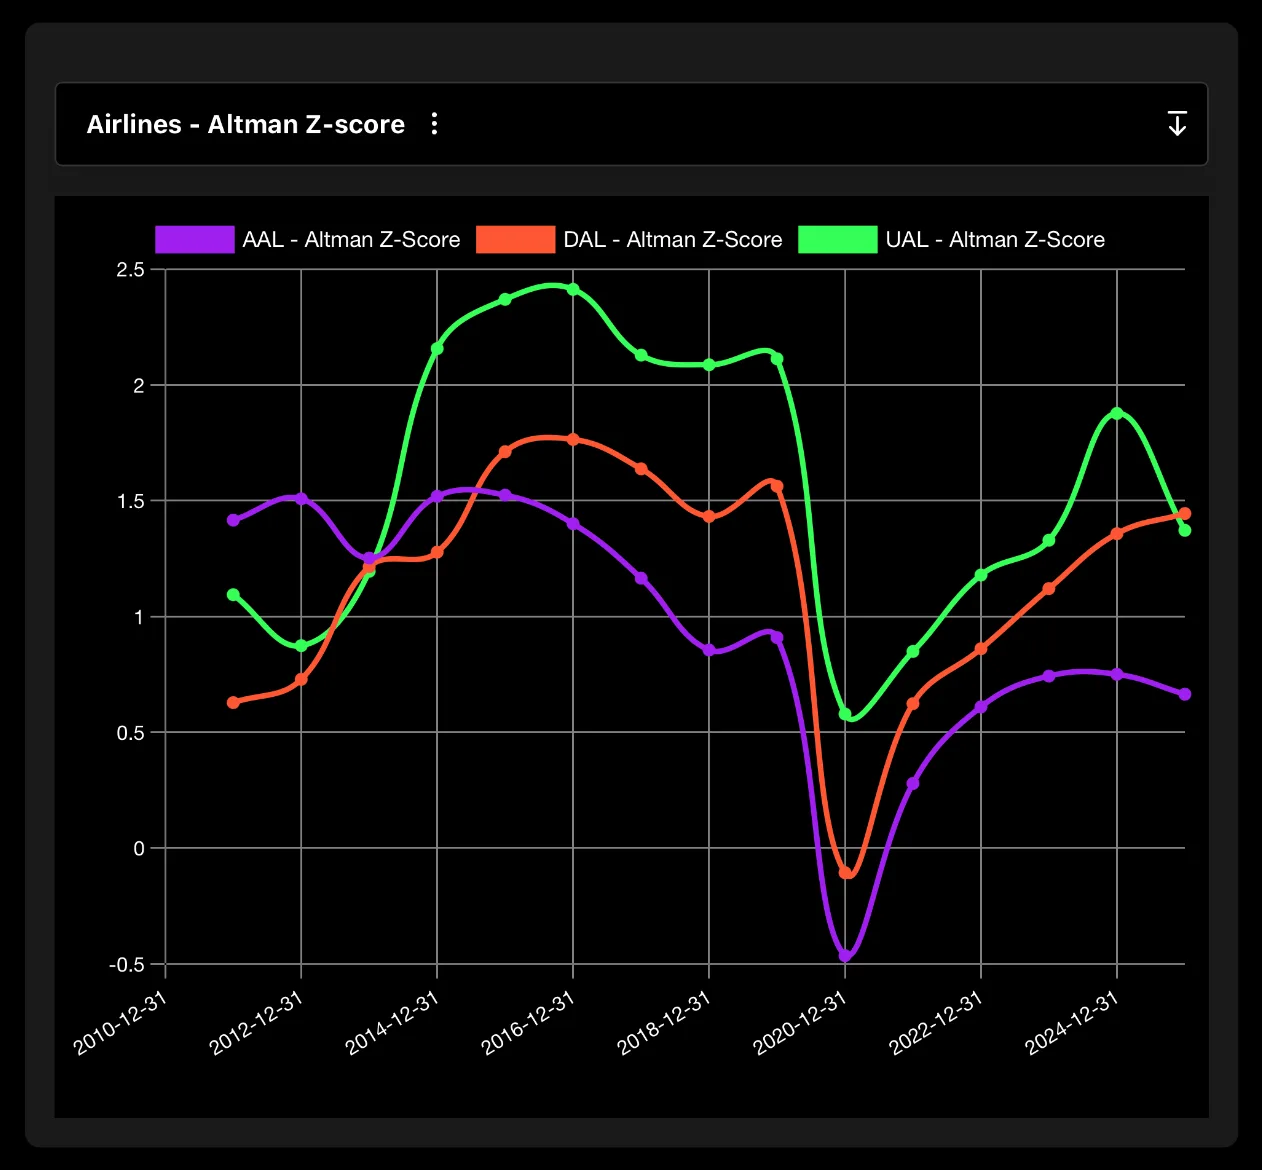 GeminIQ calculated metrics showing the Altman Z-Score distress levels for DAL, UAL, and AAL.
Phase 4: Following the Smart Money (Institutions)
Now that we have exposed the debt mirage and the Z-Score distress, we need to see how the market is pricing these differing capital structures. We use GeminIQ’s Institutional Ownership module to follow the "smart money."
When we look at the institutional flows side-by-side, a glaring divergence emerges.
Wall Street is playing it aggressively safe. Massive funds are heavily crowding into United and Delta, claiming 86.55% and 83.10% ownership stakes, respectively, to hide in their safer, unleveraged balance sheets.
But institutions are actively avoiding the value trap. American Airlines has the lowest institutional backing of the group by a massive margin, sitting at just 69.48%. Wall Street is completely aware of American Airlines' fragile Altman score and is refusing to hold the bag.
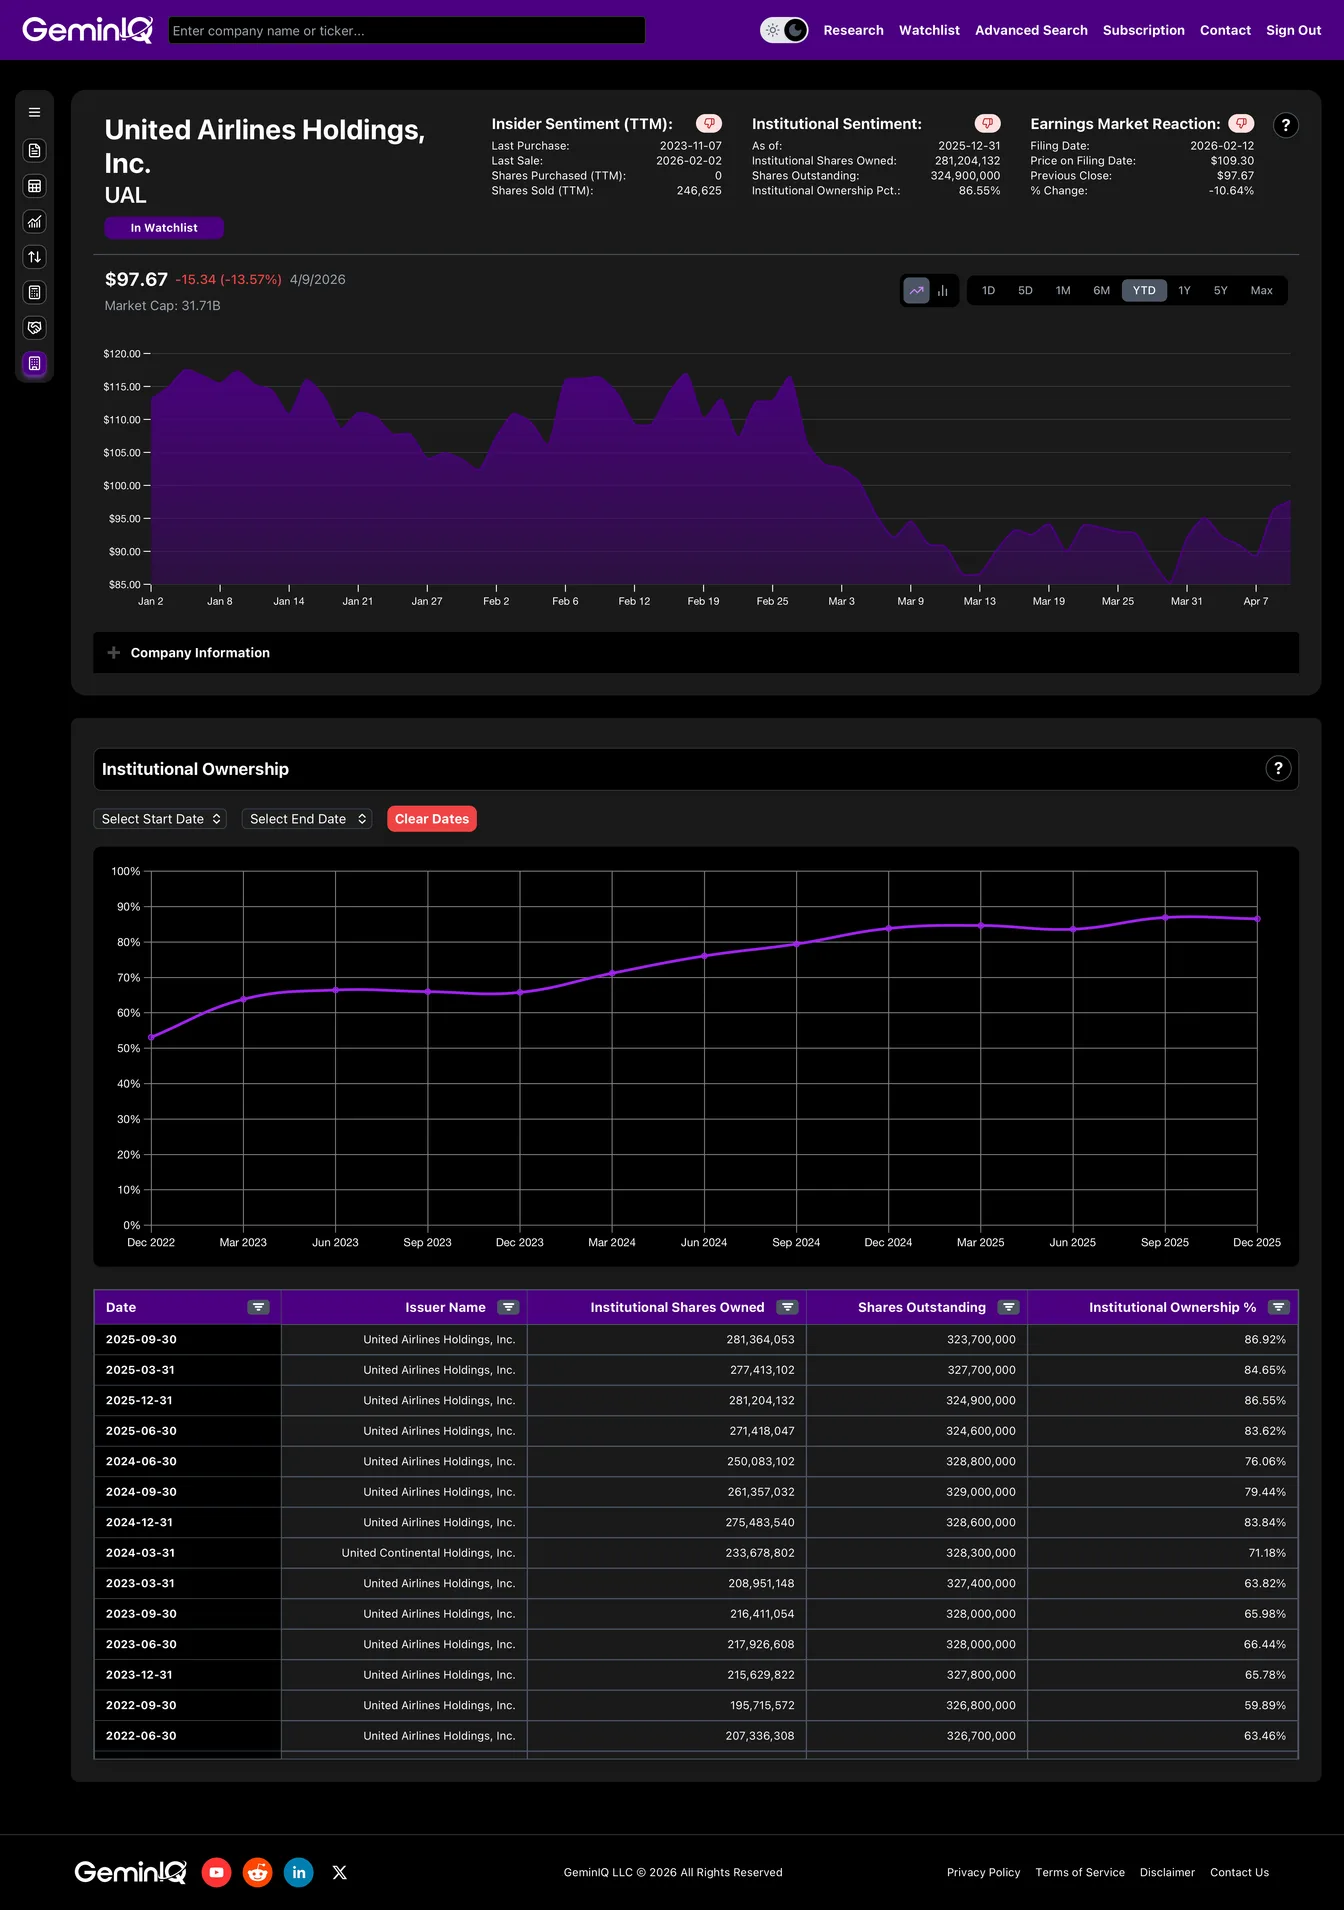 GeminIQ Institutional Holdings view for United Airlines showing heavy 86.55% total ownership.
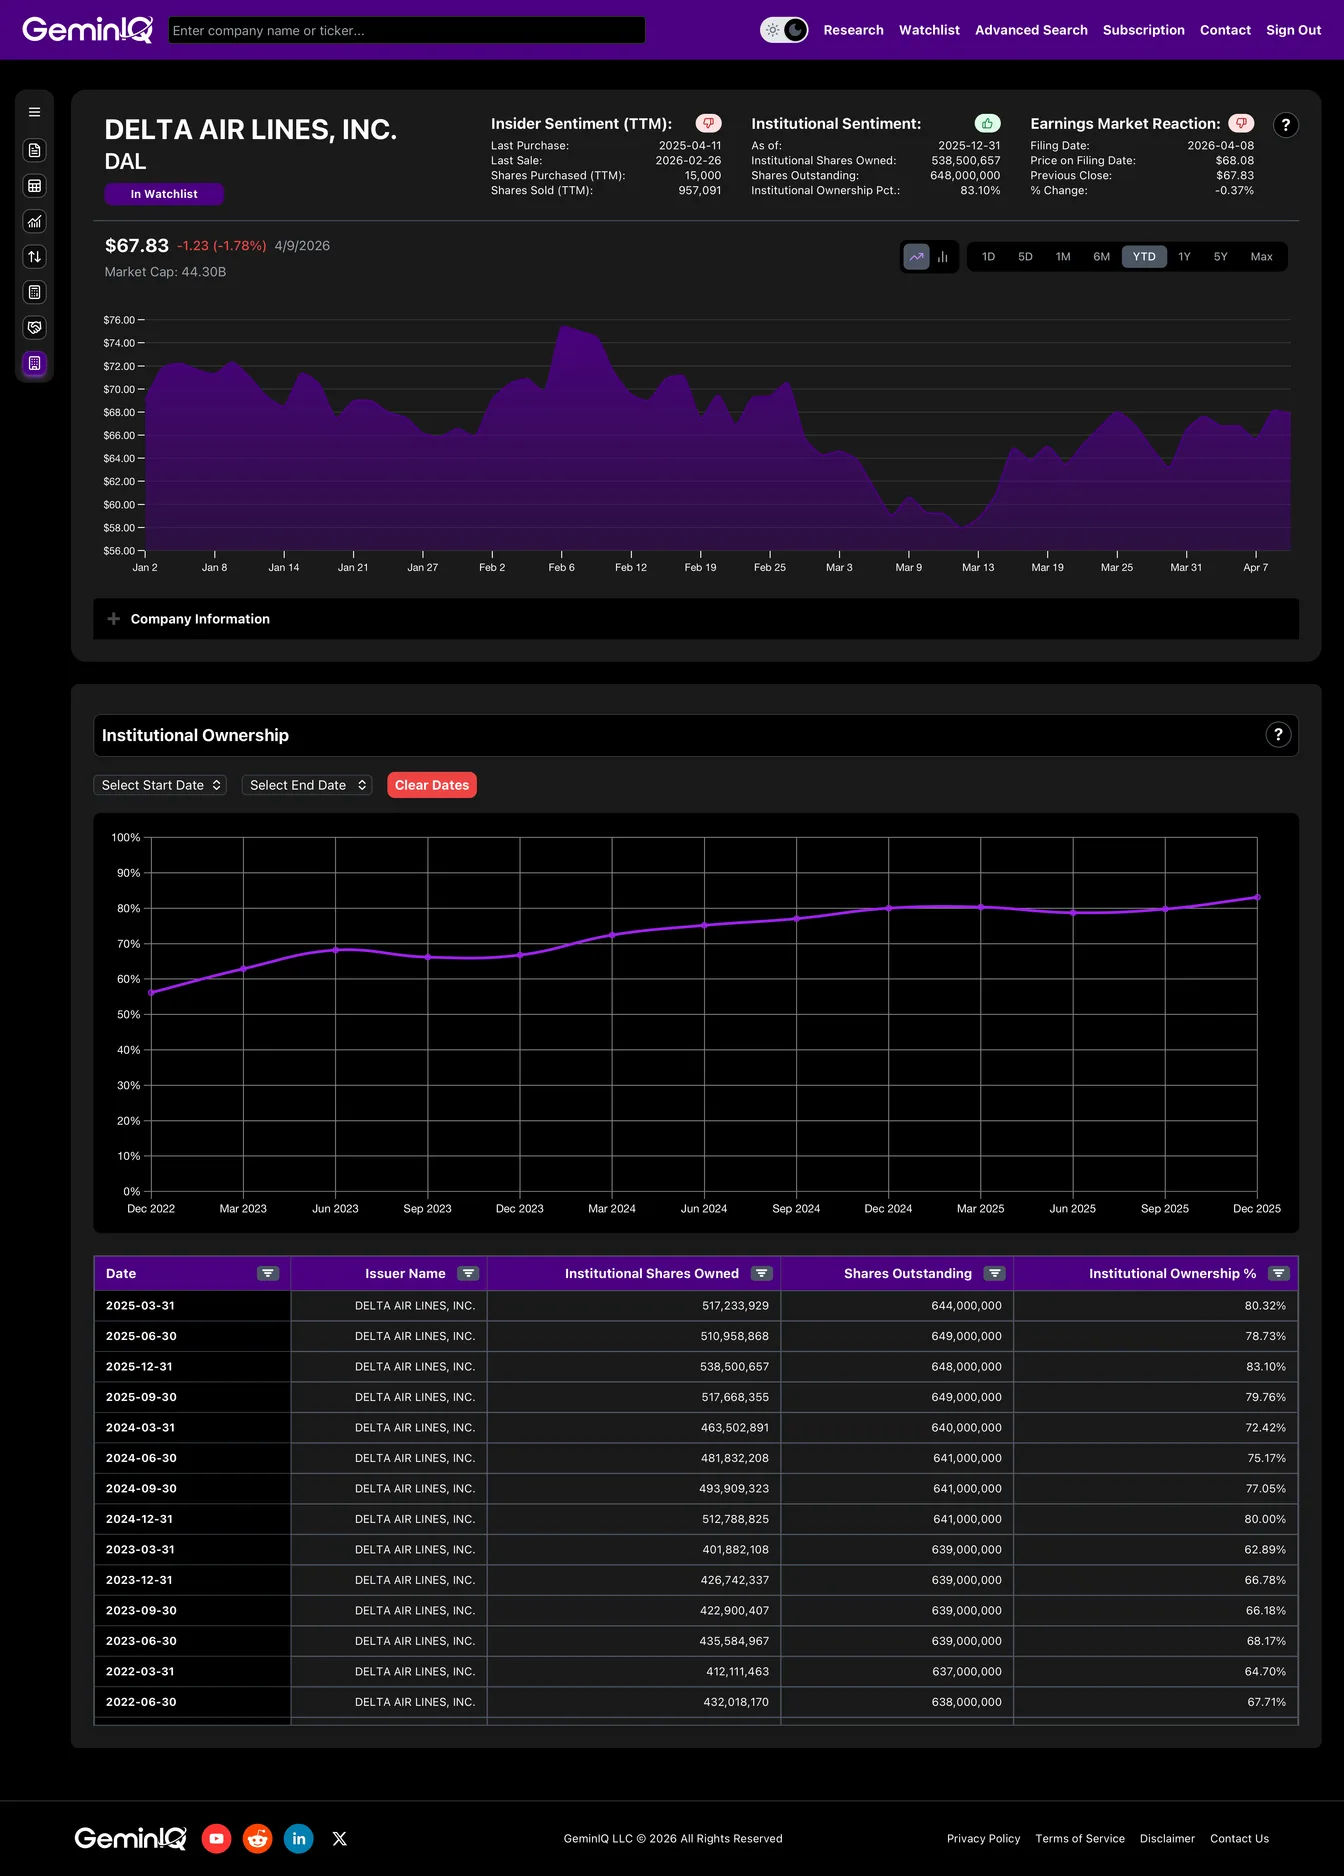 GeminIQ Institutional Holdings view for Delta Air Lines showing 83.10% total ownership.
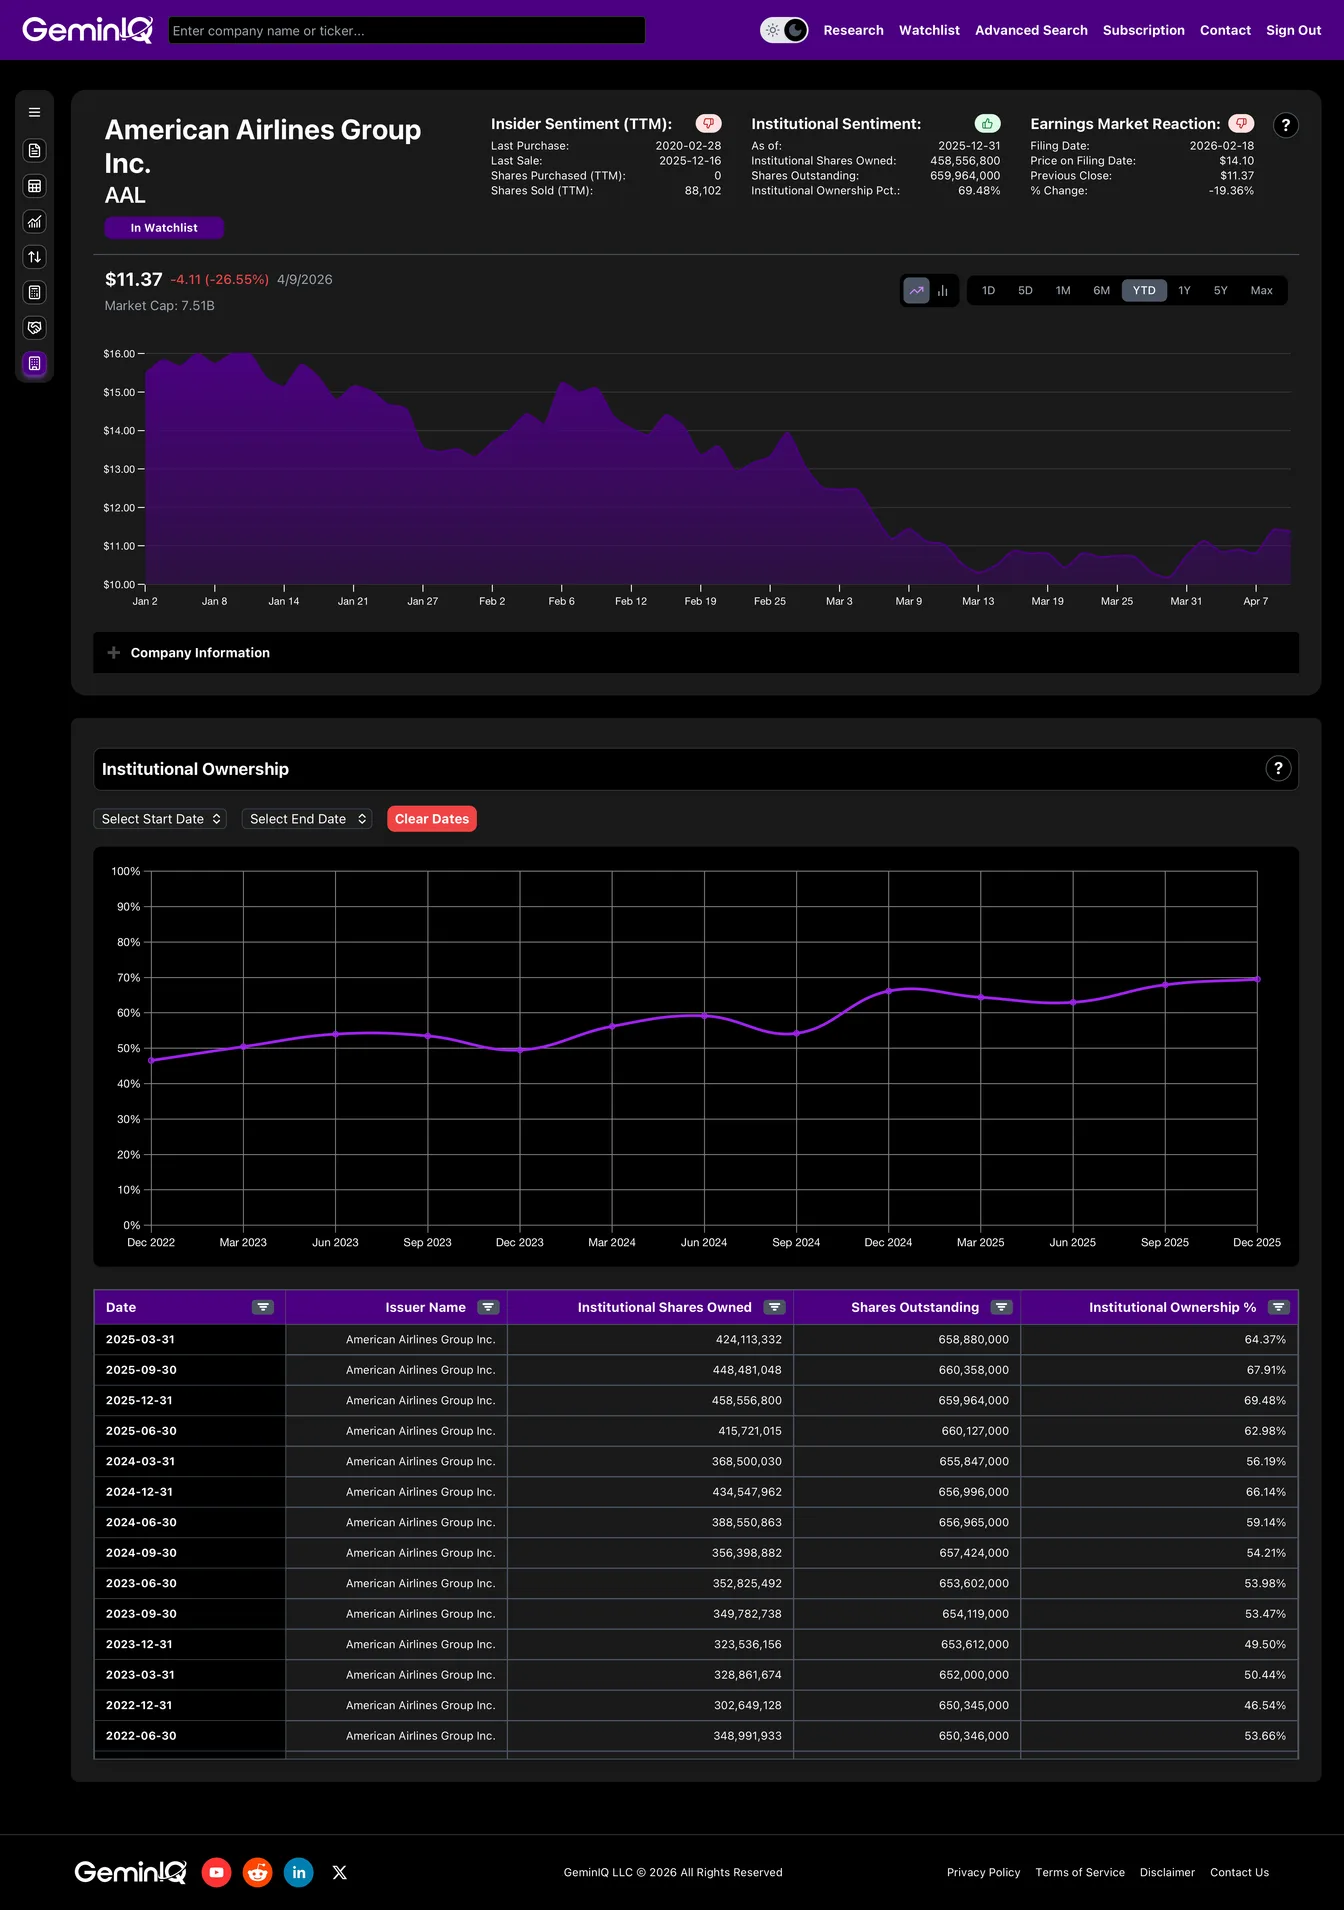 GeminIQ Institutional Holdings view for American Airlines showing just 69.48% total ownership.
Phase 5: The Insider Reality
A good analyst always checks for the ultimate reality check: What are the people running the company actually doing with their own money? We jump over to GeminIQ’s Insider Transactions data to see how the executives are playing their hands.
The C-suites across the sector aren't taking any chances with this macroeconomic environment. In the early months of 2026, we see a sea of "Sale" transactions hitting the tape. Delta insiders have sold millions of dollars in equity, United executives took heavy chips off the table in late 2025 and early 2026, and American Airlines management continues to steadily liquidate their holdings. When the operators running the businesses are selling into the cycle, investors need to be heavily scrutinizing the balance sheets.
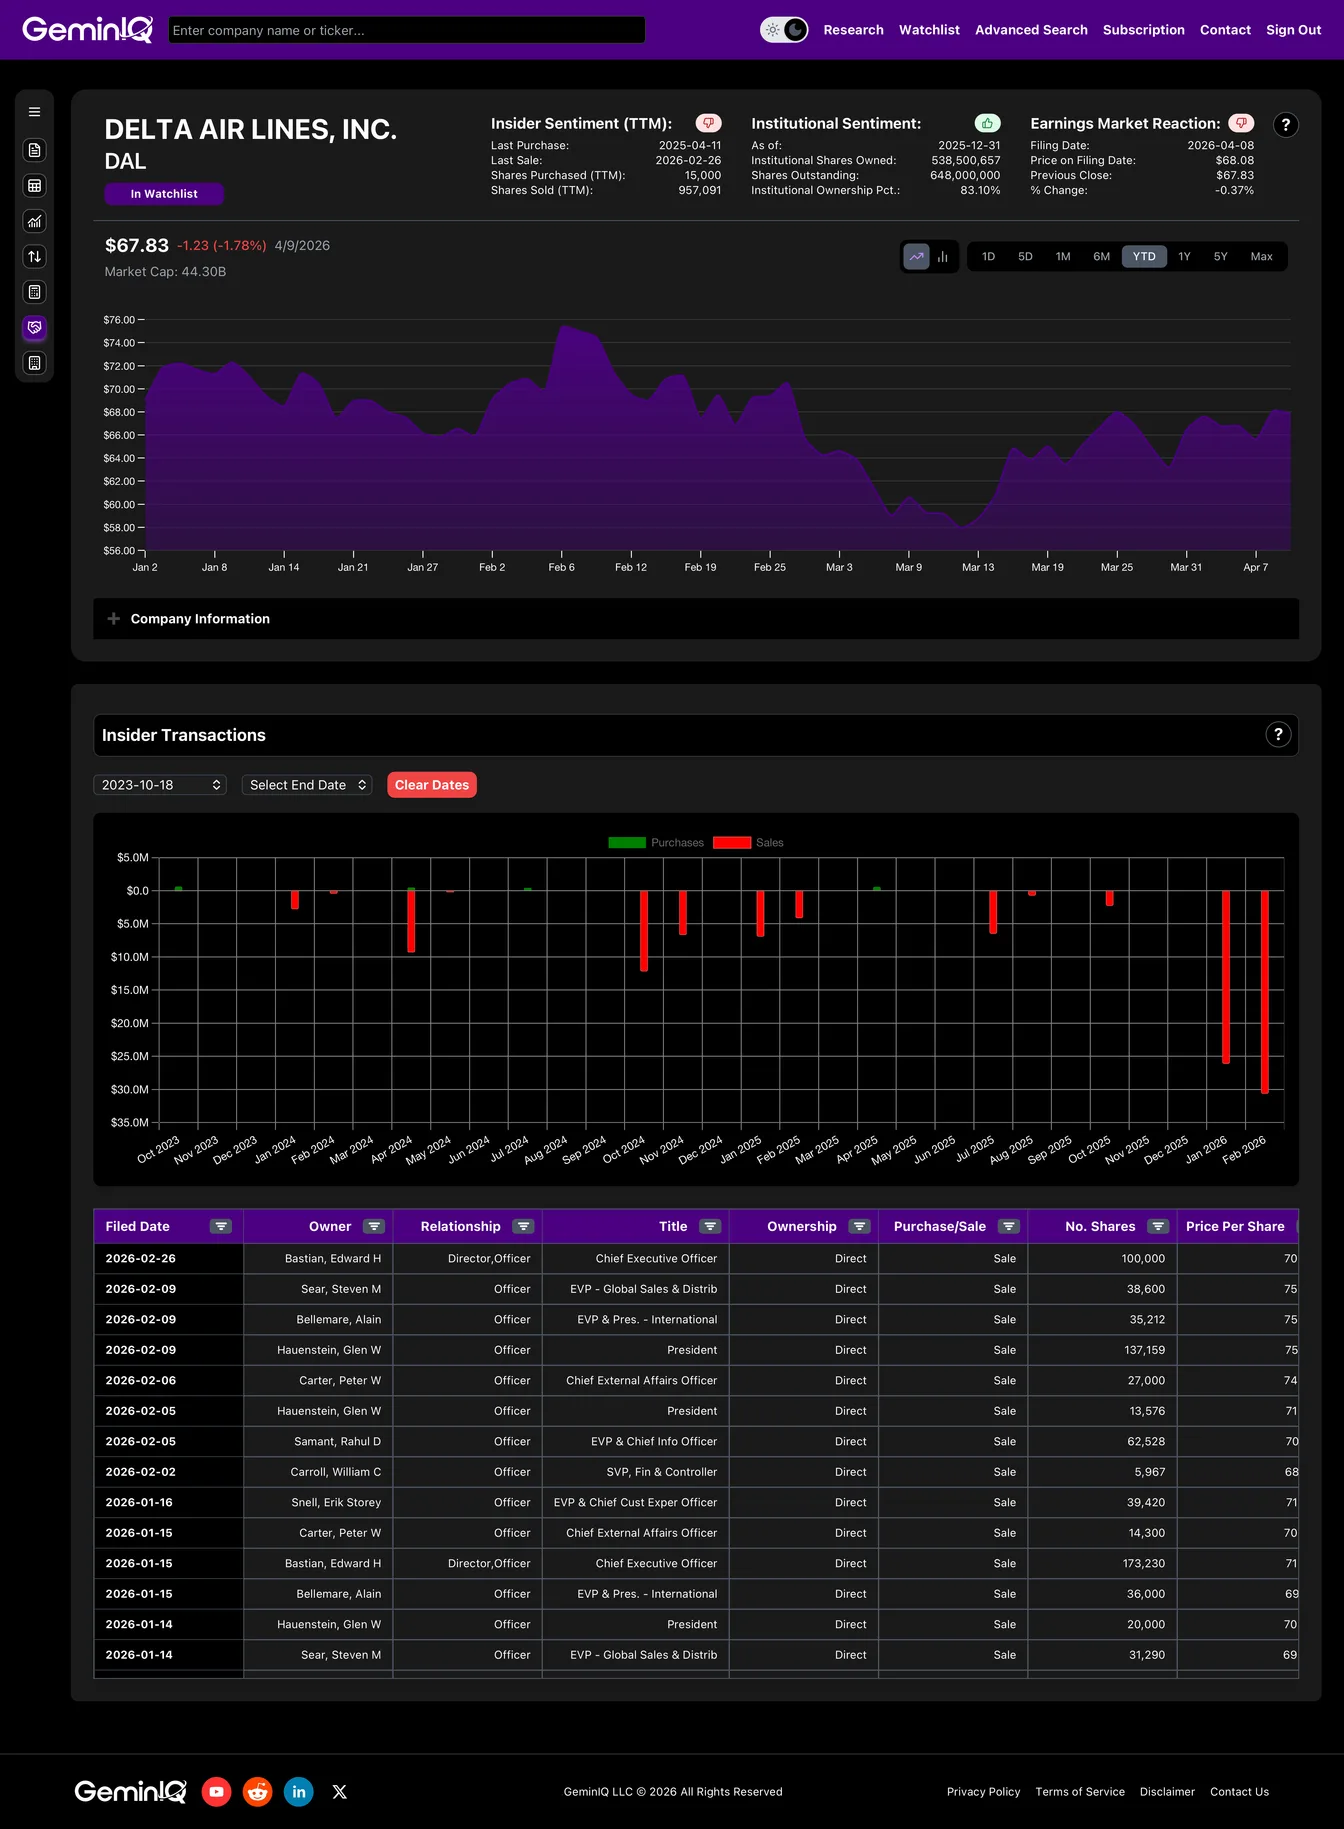 GeminIQ Insider Transactions module highlighting recent share liquidations by Delta executives.
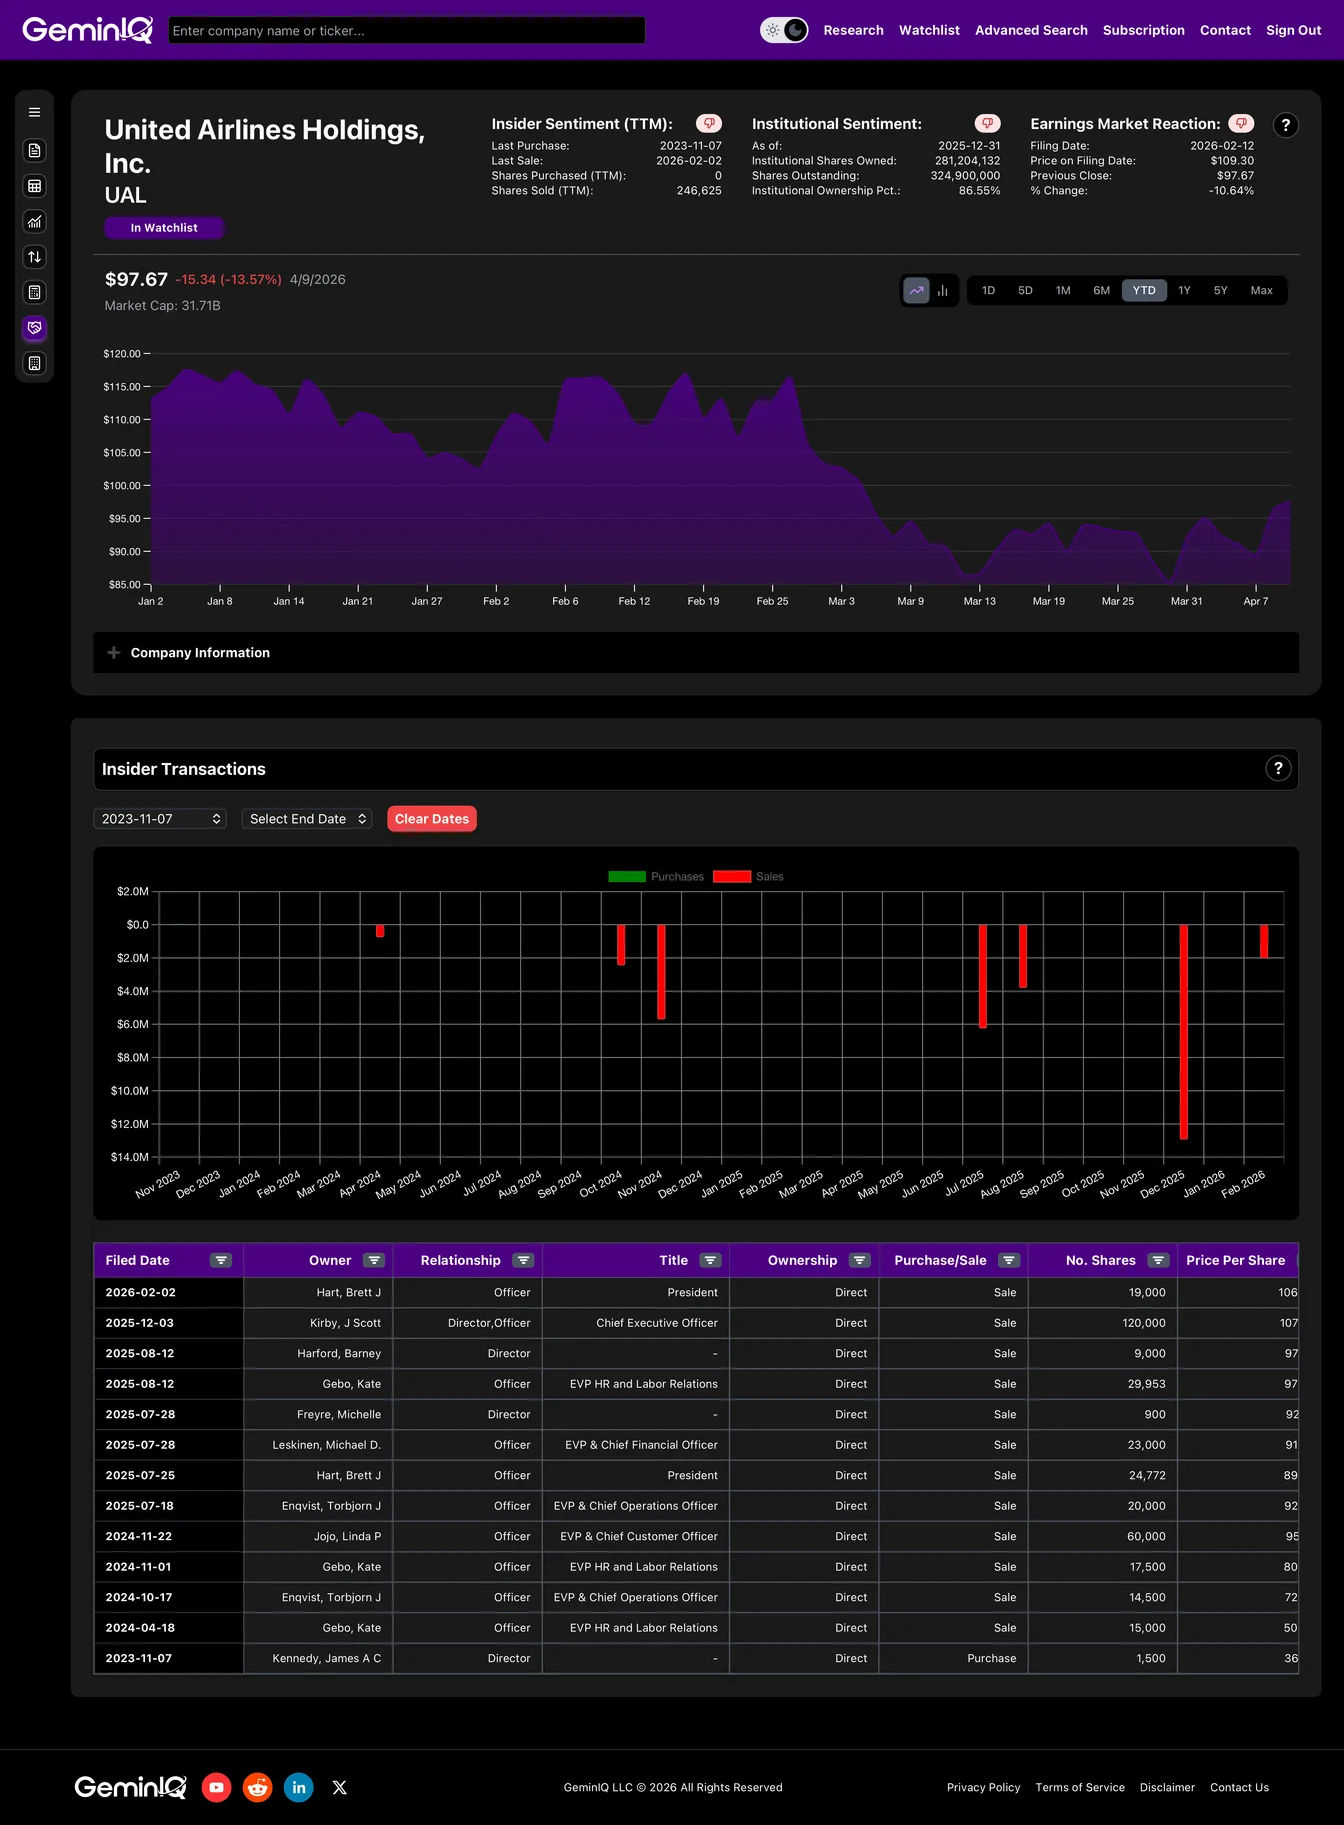 GeminIQ Insider Transactions module highlighting recent share liquidations by United executives.
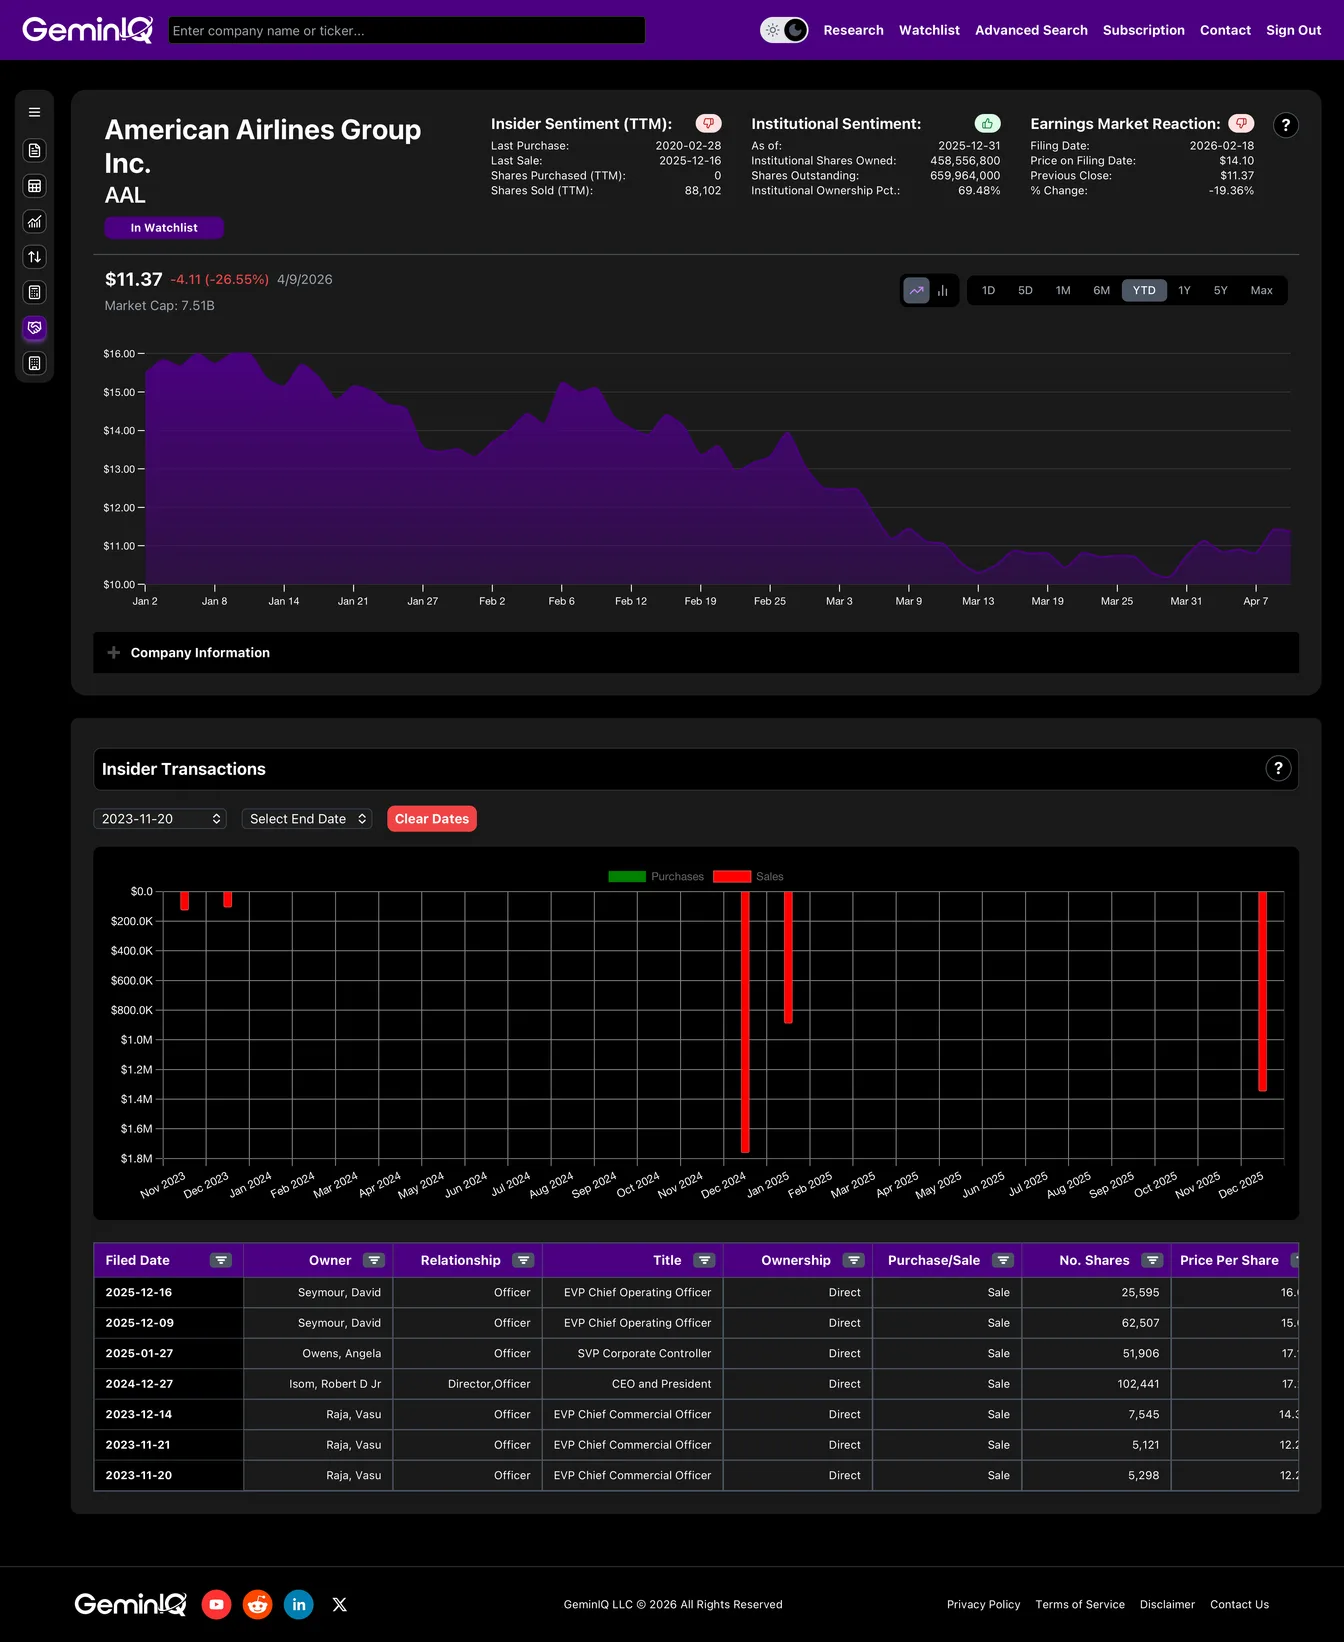 GeminIQ Insider Transactions module highlighting recent share liquidations by American Airlines executives.
The Analyst's Verdict
By actively jumping from a high-level valuation, down into the balance sheet structure, running a Z-Score distress model, and verifying with institutional flow data, our comparable company analysis completely shifted the narrative.
A surface-level screener might show you a heavily discounted market cap for American Airlines, tempting novice value investors. But GeminIQ's deep-dive data reveals that American Airlines is a financial house of cards propped up by $24 billion in net debt. Wall Street funds are actively avoiding it, seeking shelter in the mathematically safer operations of Delta and United.
Most financial websites rely on third-party aggregators that simplify or process data before you ever see it. We built GeminIQ because we believe you deserve a better fundamental analysis tool—one that goes beyond basic price charts and processed numbers. We extract our data directly from SEC 10-K and 10-Q filings to ensure that when you look at a balance sheet or a cash flow statement, you are seeing the numbers exactly how the company reported them. GeminIQ turns raw 10-K and 10-Q filings into traceable financial statements, calculated metrics, charts, screeners, and watchlists for US public company research. Our goal is to give you the tools to verify the narrative for yourself using clean, traceable data. Start researching now at GeminIQ.
Related Blogs
- See how the same comps methodology ranks three defense contractors
- See how the same balance sheet stress test applies to big-box retail
- See how Exxon engineered the cyclical risk out of a capital-heavy business
Disclaimer:
The content in this blog is for educational and entertainment purposes only and does not constitute financial, legal, or tax advice. Investing involves risk, including the loss of principal. The views expressed are my own and not intended as financial advice or a guarantee of future performance.