Defense Sector Stock Analysis (2026): Finding the Fundamental Leaders
By Chad Hartman
Published March 10, 2026 · Last updated June 14, 2026
If you are evaluating high-growth tech or volatile consumer brands, finding a clear winner is usually just a matter of looking at top-line revenue growth. The discrepancies between competitors are massive and obvious.
But what happens when you need to analyze mature companies that operate in the exact same, highly regulated environment?
Welcome to the defense sector. When you look at prime contractors like Lockheed Martin (LMT), Northrop Grumman (NOC), and General Dynamics (GD), their core businesses are almost identical. To find the alpha, you have to run a strict, multi-layered "comps" analysis. You can't just look at high-level ratios; you have to rip open the underlying financial statements.
Here is how a real analyst uses GeminIQ to strip away the PR spin, deconstruct the balance sheet, and rank the defense titans.
Phase 1: The Efficiency Illusion
Investing in a vacuum is a massive risk. In GeminIQ, our workflow starts by creating a custom Watchlist to aggregate Lockheed Martin, Northrop Grumman, and General Dynamics side-by-side.

We start by pulling up the Calculated Metrics tab to compare fundamental performance. Immediately, a clear hierarchy emerges across multiple key indicators:
- Return on Invested Capital (ROIC): Lockheed Martin (LMT) looks like a capital efficiency machine. Its ROIC sits at a massive 25.1%. Meanwhile, General Dynamics (GD) and Northrop Grumman (NOC) are lagging significantly behind, posting ROIC metrics of 13.5% and 12.7%, respectively.
- Free Cash Flow (FCF): The cash generation story paints the exact same picture. By the end of 2025, Lockheed Martin was generating a staggering $6.9 billion in Trailing Twelve Month (TTM) Free Cash Flow. General Dynamics ($3.96 billion) and Northrop Grumman ($3.3 billion) are barely producing half of that.
- Dividend Yield: Lockheed Martin's massive cash generation is translating directly to investors, boasting a 2.78% yield that easily outpaces General Dynamics (1.76%) and Northrop Grumman (1.58%).
- Price-to-Earnings (P/E): Here is the kicker. Despite Lockheed Martin producing nearly double the cash and capital efficiency of its rivals, the market isn't charging a massive premium for it. All three defense primes are trading in a surprisingly tight P/E band—Lockheed Martin at 22.4x, General Dynamics at 21.4x, and Northrop Grumman at 19.6x. If we only looked at a standard stock screener, the analysis would be over. Lockheed Martin appears to be executing at a vastly superior level, printing cash, and generating massive capital returns—all for roughly the same valuation multiple as its peers.
But a good analyst knows that a calculated metric is just a math equation. To know if that 25% ROIC is a sign of operational excellence or a financial mirage, we have to look at the denominator.
Phase 2: The Balance Sheet Reality Check
We pivot our dashboard away from the calculated metrics and pull up the raw Balance Sheet data for the end of 2025. This is where Lockheed's "efficiency" narrative falls apart.
Lockheed Martin isn't necessarily running a better underlying business; they are just running a heavily leveraged one.
- Lockheed Martin (LMT): Lockheed Martin is sitting on nearly $60 billion in Total Assets, but they have stacked up $53.1 billion in Total Liabilities (including over $20.5 billion in long-term debt). That leaves them with a razor-thin equity base of just $6.7 billion. When your equity is that small, any profit makes your returns (like ROIC and ROE) look artificially explosive.

- General Dynamics (GD): Now we pull up General Dynamics' balance sheet. It is a fortress. Against $57.2 billion in assets, General Dynamics holds a massive $25.6 billion in Total Equity, weighed against just $7 billion in long-term debt.

General Dynamics isn't less efficient than Lockheed; they are just operating with a vastly safer, de-risked capital structure.
Phase 3: Following the Smart Money (Institutions)
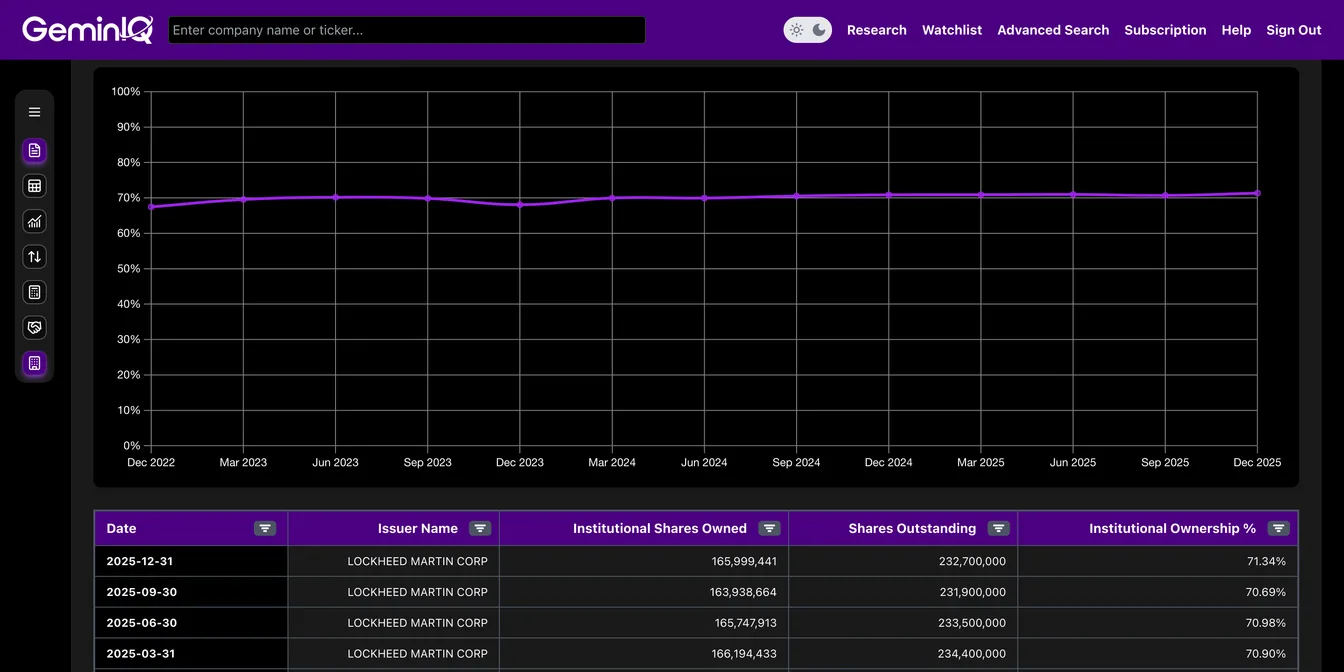
Now that we have ripped open the balance sheet, we need to see how the market is pricing these two wildly different capital structures. We use GeminIQ’s Institutional Ownership module to follow the "smart money."
The divergence is glaring, but now it makes perfect sense. Wall Street is heavily underweighting the high-ROIC Lockheed Martin, holding just 71.3% of shares.
Meanwhile, the big funds are crowding into General Dynamics, commanding a massive 84.39% institutional ownership rate. In an uncertain macroeconomic environment, the massive funds aren't chasing Lockheed's debt-fueled ROIC; they are paying a premium for General Dynamics' pristine, low-leverage balance sheet.

Phase 4: The Insider Profit Taking
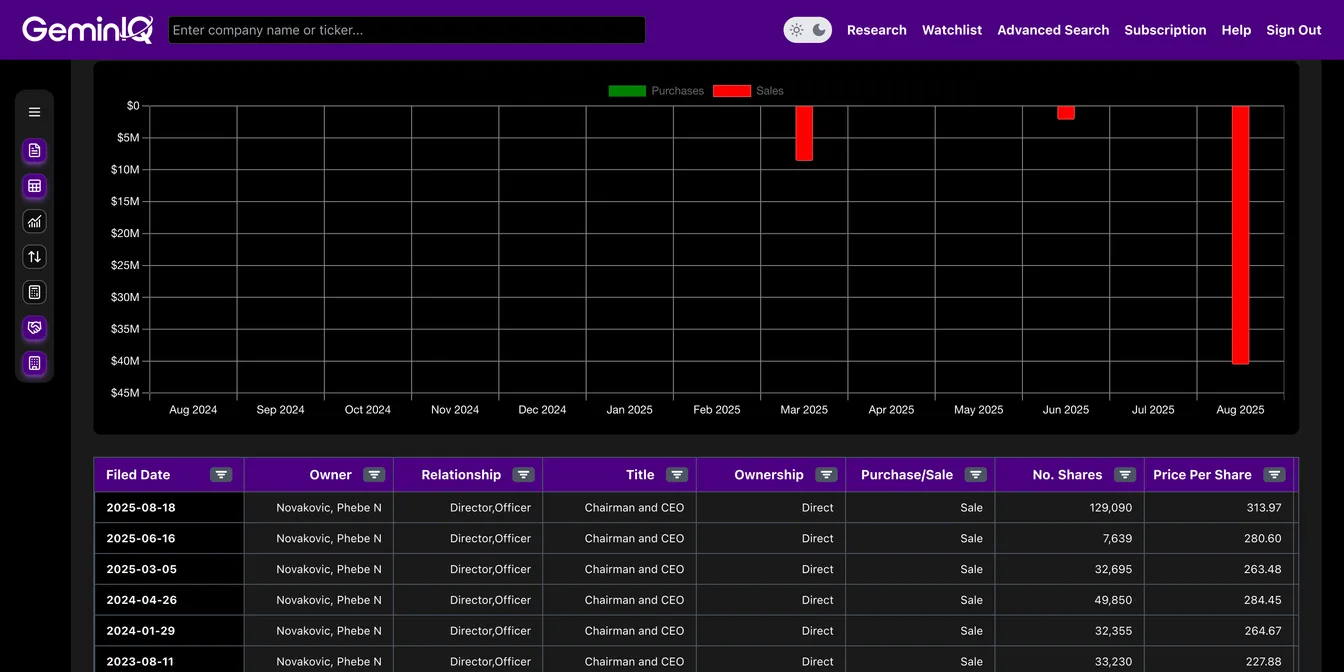
We have our thesis: General Dynamics is the safest, most structurally sound asset on the board. But a good analyst always checks for red flags. We jump over to GeminIQ's Insider Transactions data.
Throughout 2025, General Dynamics' C-suite initiated a staggering sell-off. CEO Phebe Novakovic alone unloaded over 130,000 shares, including a massive 129,090-share dump in August.
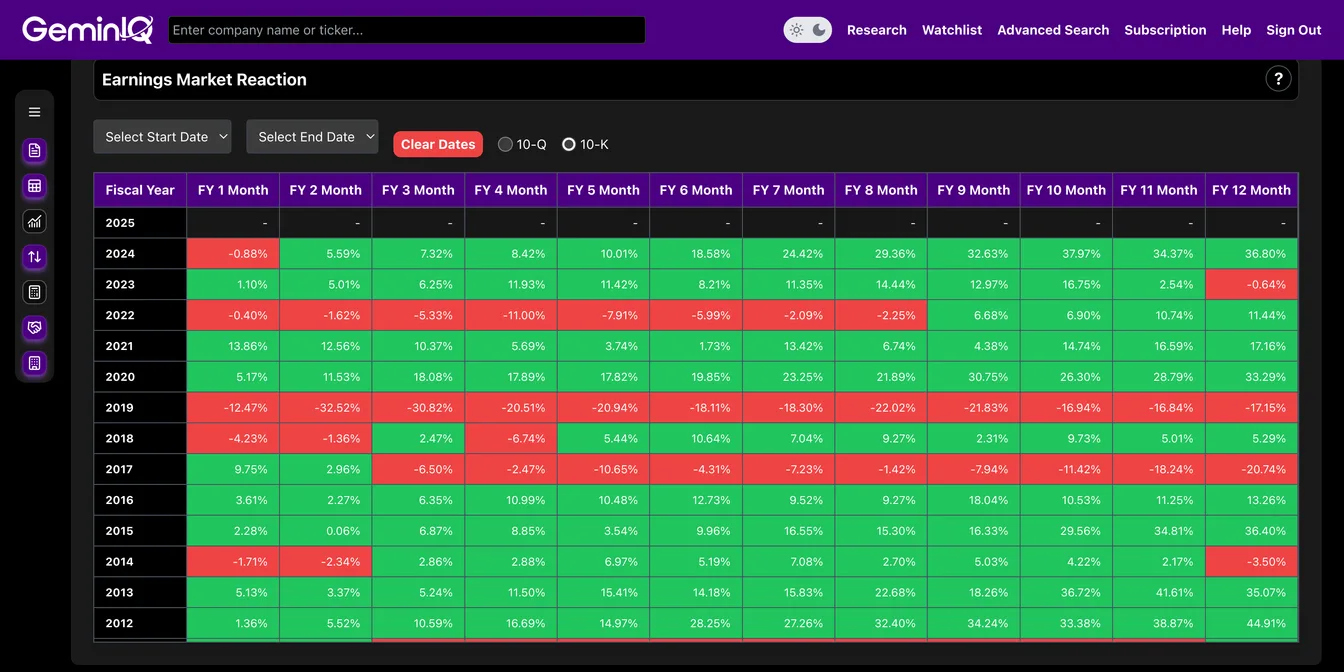
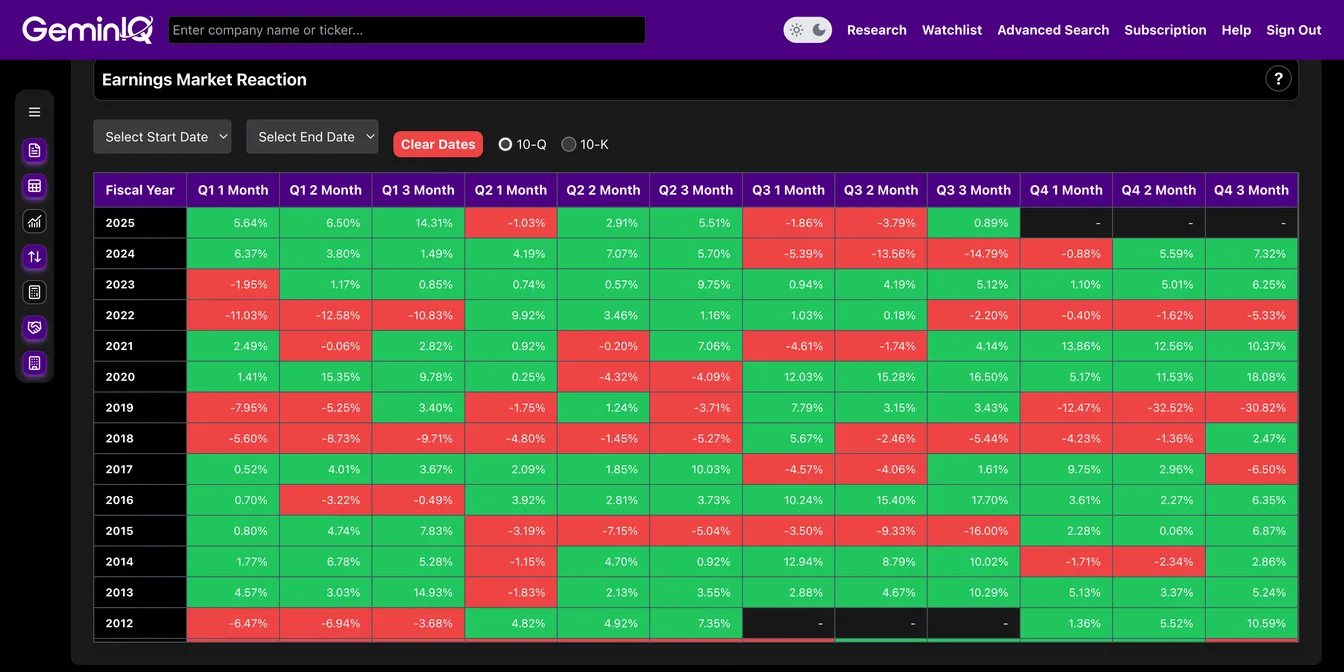
A retail investor sees that insider selling and panics. But by tying our analysis together with GeminIQ’s historical Price Variance data, we see the real story.
At the end of 2024, General Dynamics was trading around $257. By Q3 2025, Wall Street's institutional crowding had pushed the stock past $338. The executives weren't abandoning a broken company; they were aggressively monetizing a massive 30% run-up fueled by their own stellar balance sheet management.
The Analyst's Verdict
By actively jumping from high-level metrics, down into the raw balance sheet, and cross-referencing with institutional sentiment, our comparable company analysis completely shifted the narrative.
A surface-level screener will tell you to buy Lockheed Martin for its 25% ROIC. But GeminIQ's deep-dive data reveals that General Dynamics is the true fundamental powerhouse, boasting a fortress balance sheet that the smartest money on Wall Street is aggressively accumulating.
Most financial websites rely on third-party aggregators that simplify or process data before you ever see it. We built GeminIQ because we believe you deserve a better fundamental analysis tool—one that goes beyond basic price charts and processed numbers. We extract our data directly from SEC 10-K and 10-Q filings to ensure that when you look at a balance sheet or a cash flow statement, you are seeing the numbers exactly how the company reported them. GeminIQ turns raw 10-K and 10-Q filings into traceable financial statements, calculated metrics, charts, screeners, and watchlists for US public company research. Our goal is to give you the tools to verify the narrative for yourself using clean, traceable data. Start researching now at GeminIQ.
Related Blogs
- See how the same comps methodology exposes the airline sector’s debt crisis
- See how the same balance sheet analysis reveals the retail sector’s ROIC mirage
- See how NVIDIA’s 66% ROIC holds up against the same capital efficiency analysis
Disclaimer: The content in this blog is for educational and entertainment purposes only and does not constitute financial, legal, or tax advice. Investing involves risk, including the loss of principal. The views expressed are my own and not intended as financial advice or a guarantee of future performance.