Retail Sector Stock Analysis: ROIC, Inventory Bloat, and the Margin Mirage (2026)
By Chad Hartman
Published March 23, 2026 · Last updated June 14, 2026
If you are evaluating the retail sector in 2026, you already know the market is facing a massive "standards reset." With consumers becoming hyper-selective and foot traffic shifting from automatic to deliberate, top-line revenue is rapidly becoming a vanity metric.
But how do you spot the real winners when mature companies are all operating in the exact same, highly competitive macroeconomic environment?
Welcome to the big-box retail sector. When you look at giants like Home Depot (HD), Lowe's (LOW), and Tractor Supply Co. (TSCO), their core businesses are practically identical. To find the alpha, you have to run a strict, multi-layered "comps" analysis. You can't just look at high-level profit margins; you have to rip open the underlying efficiency metrics and deconstruct the balance sheet.
Here is how a real analyst uses GeminIQ to strip away the PR spin, uncover the inventory trap, and rank the retail titans.
Phase 1: The Top-Line Illusion
Investing in a vacuum is a massive risk. In GeminIQ, our workflow starts by creating a custom Watchlist to aggregate Home Depot, Lowe's, and Tractor Supply side-by-side.
 GeminIQ custom Watchlist displaying Home Depot (HD), Lowe's (LOW), and Tractor Supply Co. (TSCO) side-by-side.
We start by pulling up the Calculated Metrics tab to compare fundamental performance. Immediately, a clear illusion emerges across their valuation and profit margins:
 GeminIQ custom comps view highlighting Gross Profit Margins, Days Inventory Outstanding (DIO), Price-to-Earnings (P/E), and Return on Invested Capital (ROIC) across the retail tickers.
- Valuation (P/E): The market is treating these companies as near equals. Home Depot trades at 26.1x, Tractor Supply at 24.1x, and Lowe's at 19.5x.
- Gross Profit Margin: On the surface, all three retailers appear to be executing perfectly in lockstep. At the end of 2025, Home Depot and Lowe's were practically tied, boasting Gross Profit Margins of 33.3% and 33.6%, respectively. Tractor Supply actually leads the pack with a 36.4% margin.
If we only looked at a standard stock screener, the analysis would be over. The sector looks completely commoditized. But a good analyst knows that gross margin only tells you what a product sells for, not what it costs to keep it on the shelf.
Phase 2: The Inventory Trap
We pivot our dashboard away from the gross margins and pull up the Days Inventory Outstanding (DIO) and Inventory Turnover data for the end of 2025. This is where the retail narrative entirely splits.
In retail, inventory is a liability disguised as an asset. If it sits on the shelf, it eats capital.
GeminIQ custom comps view highlighting Gross Profit Margins, Days Inventory Outstanding (DIO), Price-to-Earnings (P/E), and Return on Invested Capital (ROIC) across the retail tickers.
- Home Depot (HD): Home Depot is a logistical machine. The data reveals they have a Days Inventory Outstanding (DIO) of just 81.9 days, turning over their entire inventory base an impressive 4.5 times a year.
- The Laggards: Lowe's and Tractor Supply are secretly letting inventory pile up. Lowe's DIO sits at a bloated 113.3 days (turning inventory only 3.2 times a year). Tractor Supply is similarly trapped with a DIO of 109.5 days (turning inventory 3.3 times a year).
Home Depot isn't just selling hardware; they are operating with vastly superior capital velocity, getting cash back into the business over a month faster than their direct competitors.
Phase 3: The ROIC Mirage
Faster inventory turnover should mean better returns. But when we look at Return on Invested Capital (ROIC), the numbers look completely broken.
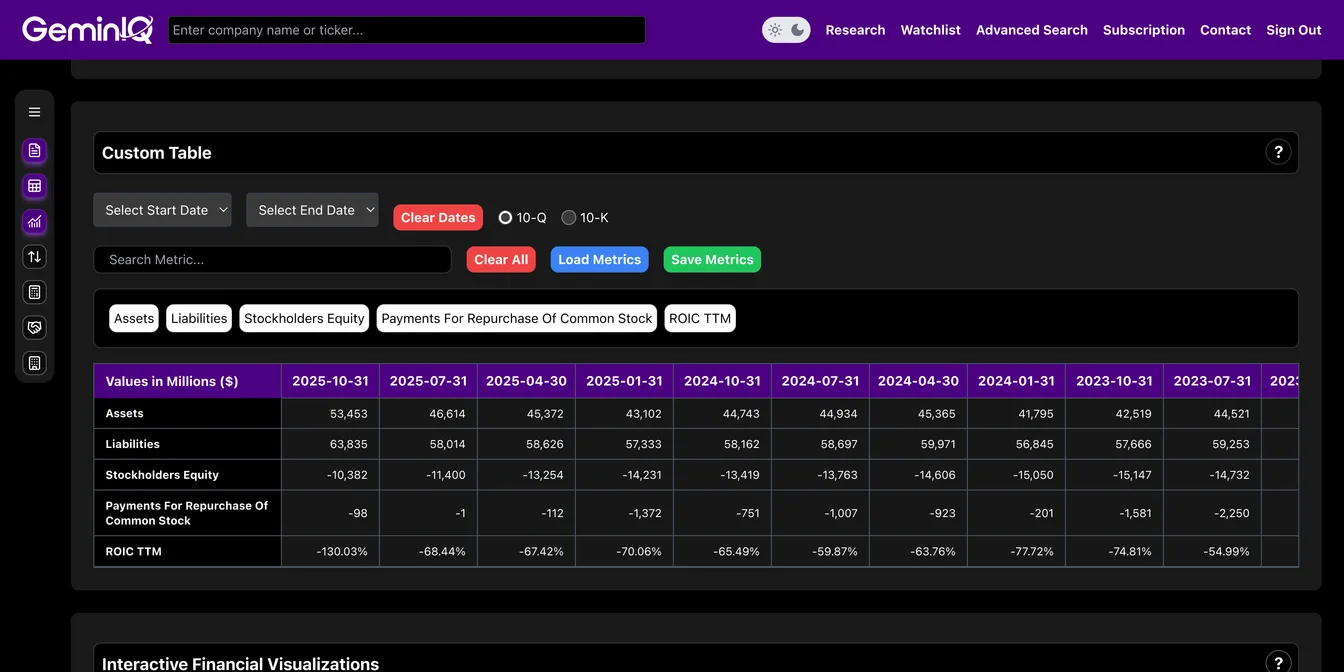
Home Depot posts a massive 68.6% ROIC. Tractor Supply sits at 27.9%. But Lowe's models break completely, posting a technically impossible negative 130.0% ROIC. Why?
To solve this, we use GeminIQ to rip open the Balance Sheet. The data reveals a massive financial engineering illusion:
 Lowe's raw balance sheet data revealing a massive liability load driving total equity negative.
- Lowe's: Lowe's has so aggressively bought back stock and leveraged their balance sheet that they are operating with negative equity (-$10.4 billion). Their total liabilities ($63.8 billion) completely outpace their $53.5 billion in assets. When equity goes negative, ROIC calculation models break.
 Home Depot's balance sheet showing a heavily leveraged structure masked by asset size.
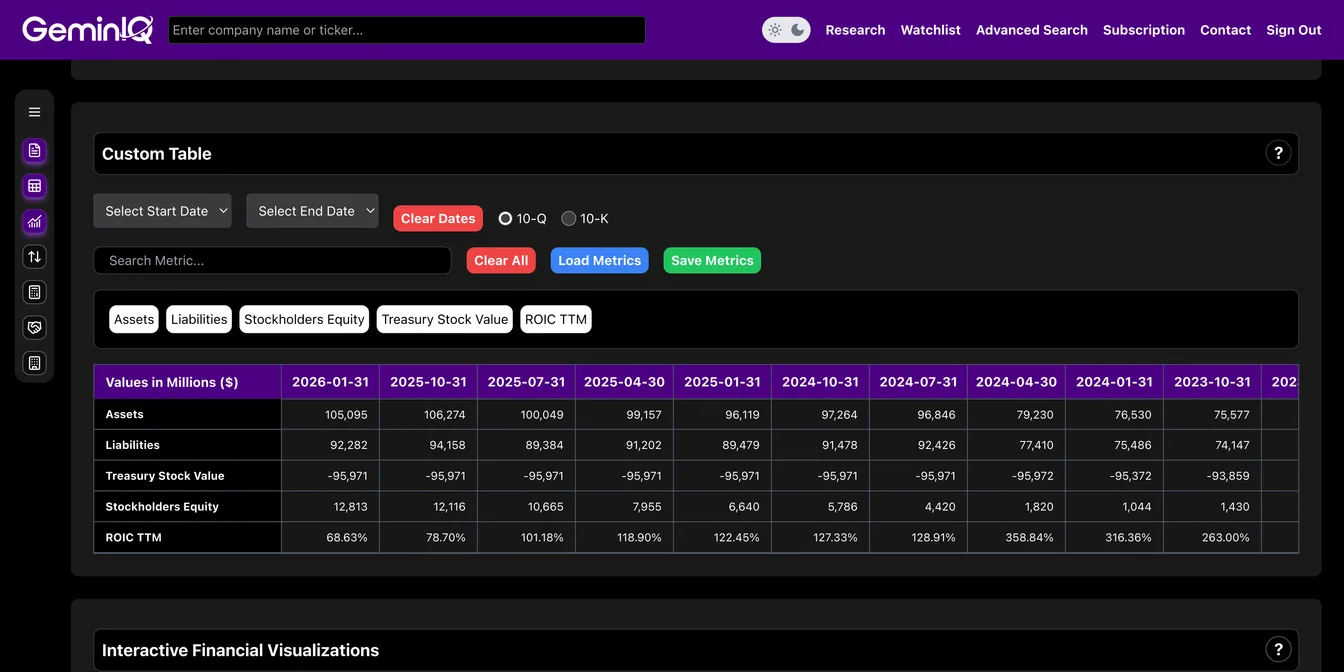
- Home Depot: Home Depot is playing the same leverage game. They have bought back a staggering $96.0 billion in treasury stock, shrinking their equity base down to just $12.8 billion against $105.1 billion in assets. By artificially shrinking their equity denominator, they mathematically inflate their ROIC to a "massive" 68.6%.
 Tractor Supply Co.'s clean, traditional balance sheet with positive equity.
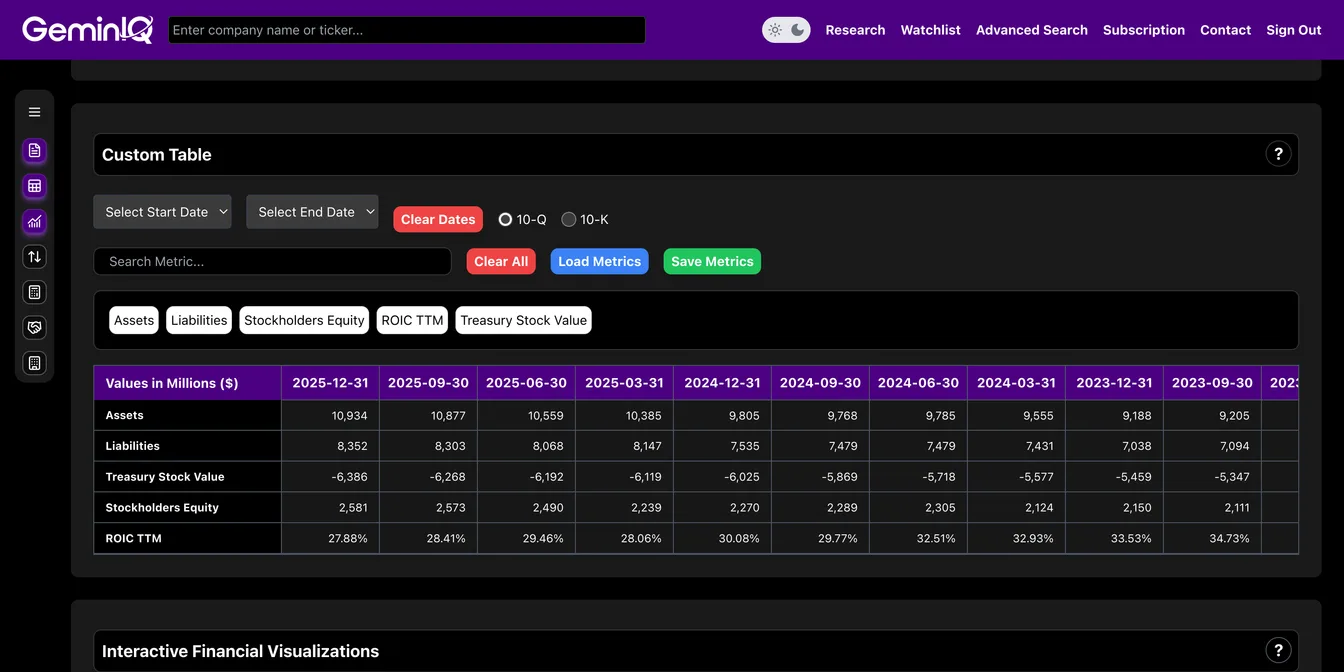
- Tractor Supply: Tractor Supply is the only retailer operating a traditional, safe balance sheet ($10.9 billion in assets vs. $8.4 billion in liabilities). Their 27.9% ROIC is legitimate, unleveraged operational efficiency.
Phase 4: Following the Smart Money (Institutions)
Now that we have ripped open the balance sheet and exposed the ROIC mirage, we need to see how the market is pricing these differing capital structures. We use GeminIQ’s Institutional Ownership module to follow the "smart money."
When we look at the institutional flows side-by-side, a glaring divergence emerges.
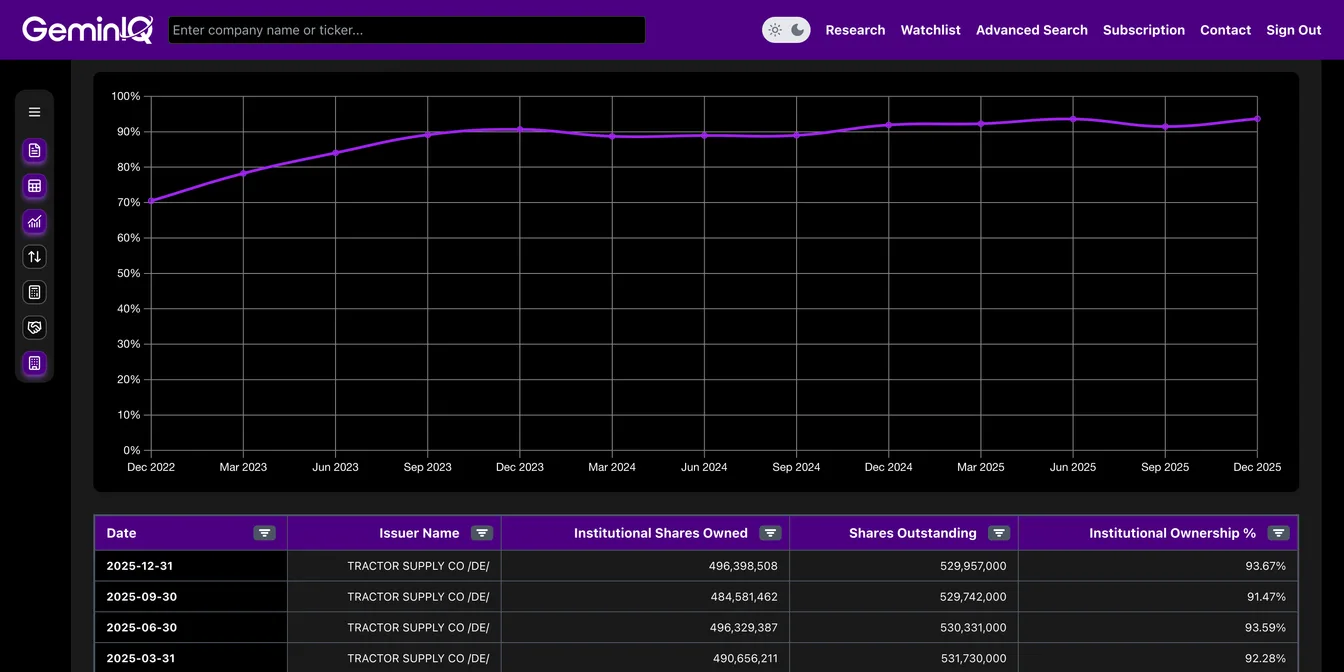 GeminIQ Institutional Holdings view for Tractor Supply Co. showing heavy 93.67% total ownership.
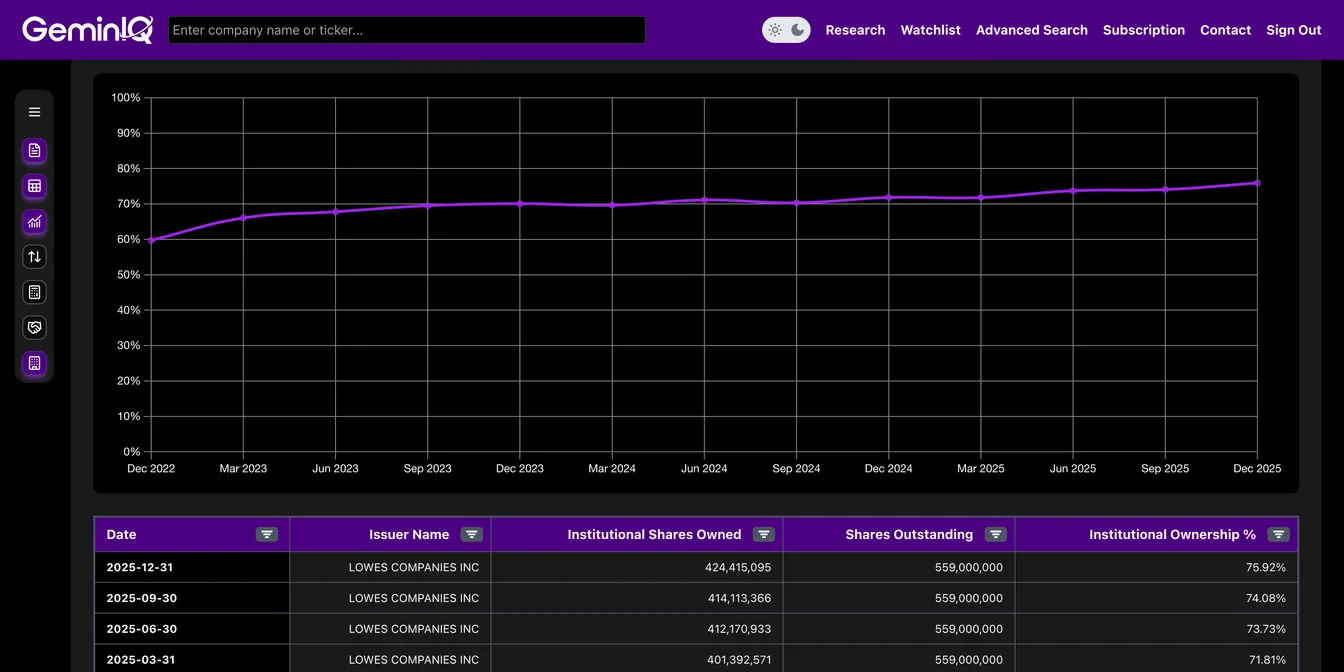 GeminIQ Institutional Holdings view for Lowe's showing 75.92% total ownership.
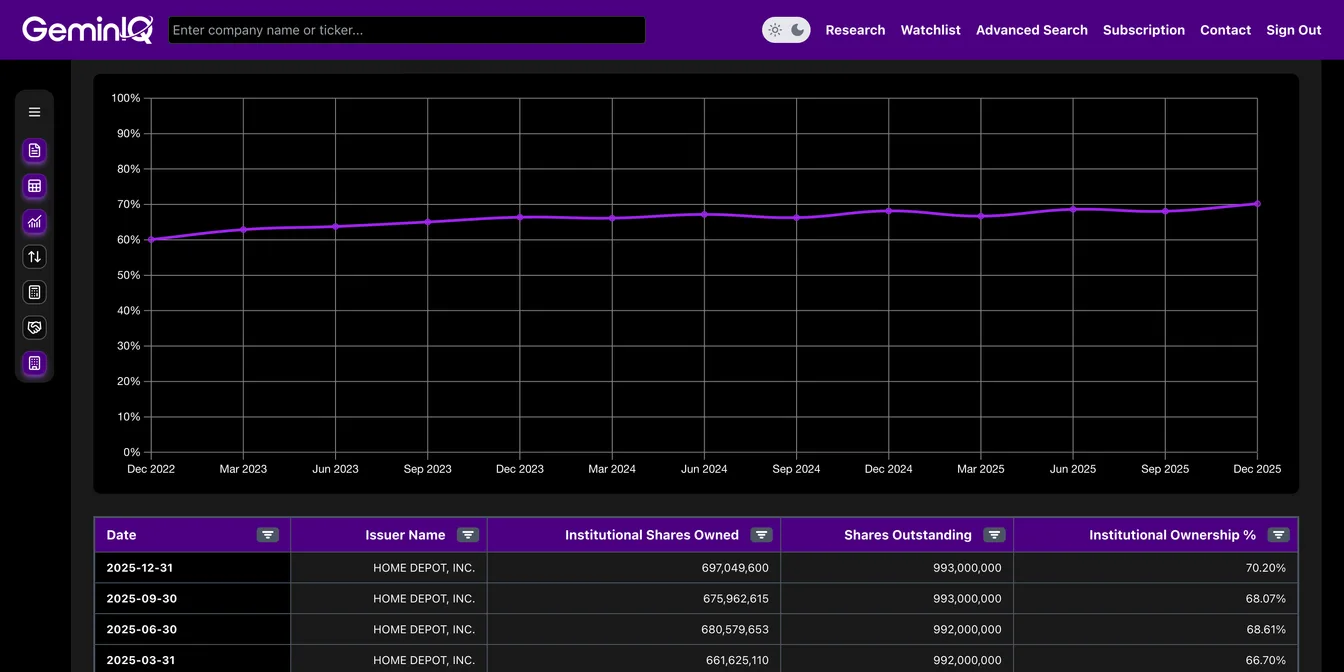 GeminIQ Institutional Holdings view for Home Depot showing just 70.20% total ownership.
Wall Street is playing it aggressively safe. Massive funds are heavily crowding into Tractor Supply, claiming an 93.67% ownership stake to hide in its clean, unleveraged balance sheet. They are also maintaining a strong 75.92% position in Lowe's, perhaps blinded by the artificially engineered returns.
But incredibly, institutions are entirely underweighting the true operational king. Home Depot has the lowest institutional backing of the group at just 70.20%. Wall Street is completely missing Home Depot's massive advantage in inventory velocity.
Phase 5: The Insider Reality
We have our thesis: Home Depot is moving inventory the fastest, Tractor Supply has the cleanest balance sheet, and Lowe's is bogging down in inventory while aggressively over-leveraging. We also know institutions are underweighting the best operator.
But a good analyst always checks for the ultimate reality check: What are the people running the company actually doing with their own money? We jump over to GeminIQ’s Insider Transactions data to see how the executives are playing their hands.
When a stock price is being propped up by financial engineering—like Lowe's massive, debt-fueled stock buybacks—the executives know the ceiling is approaching. And the data shows exactly that.
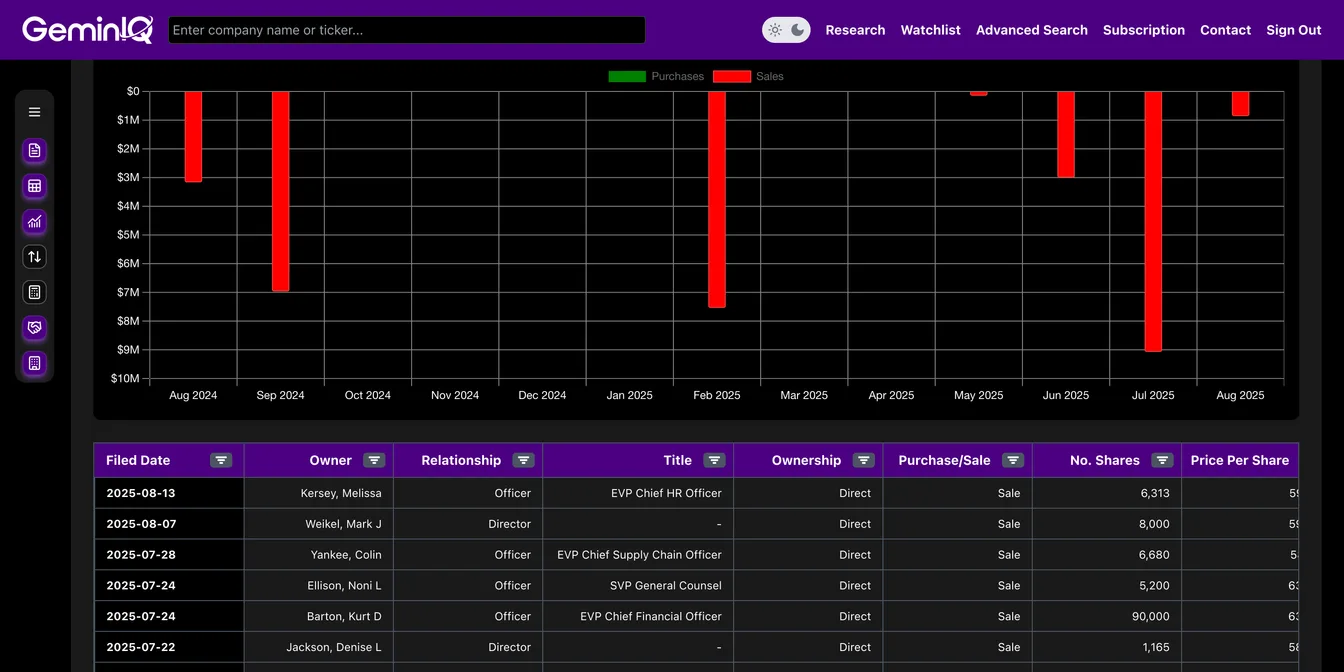
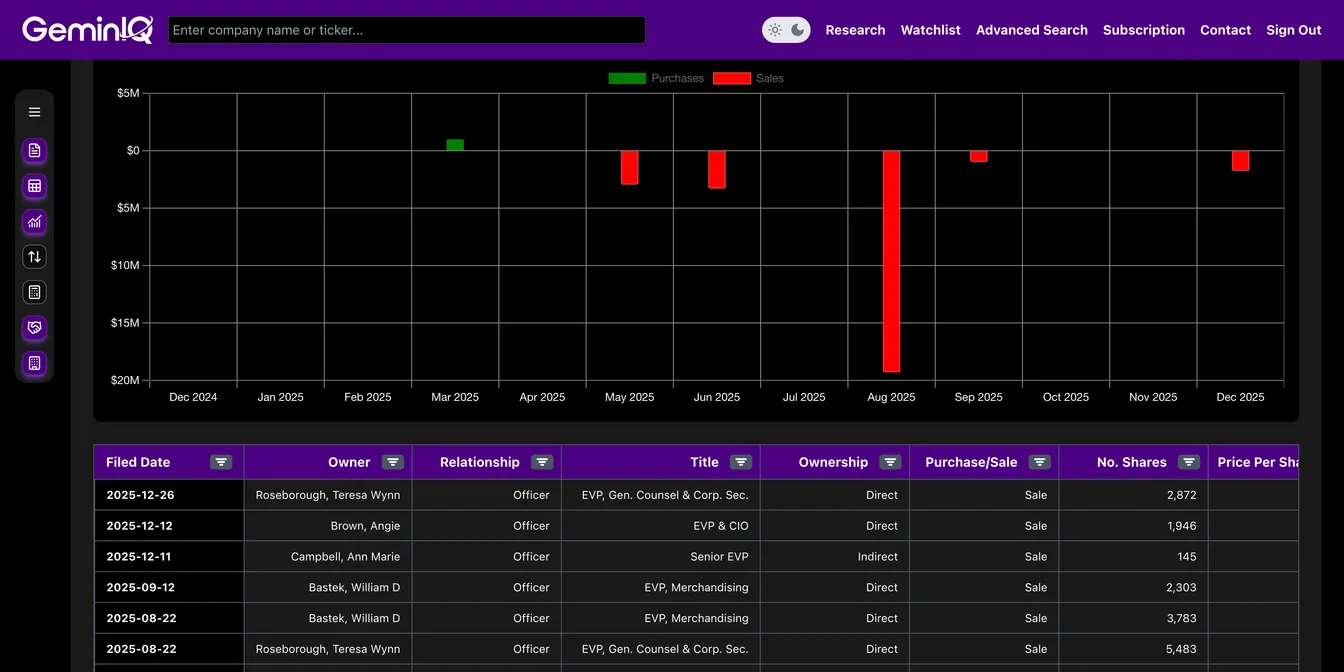
Take a look at the sea of "Sale" transactions hitting the tape for Lowe's and Tractor Supply. The C-suites at the slower-moving retailers aren't waiting around for the inventory bloat to hit the bottom line; they are quietly taking heavy chips off the table.
 GeminIQ Insider Transactions module highlighting recent share liquidations by Lowe's C-suite executives.
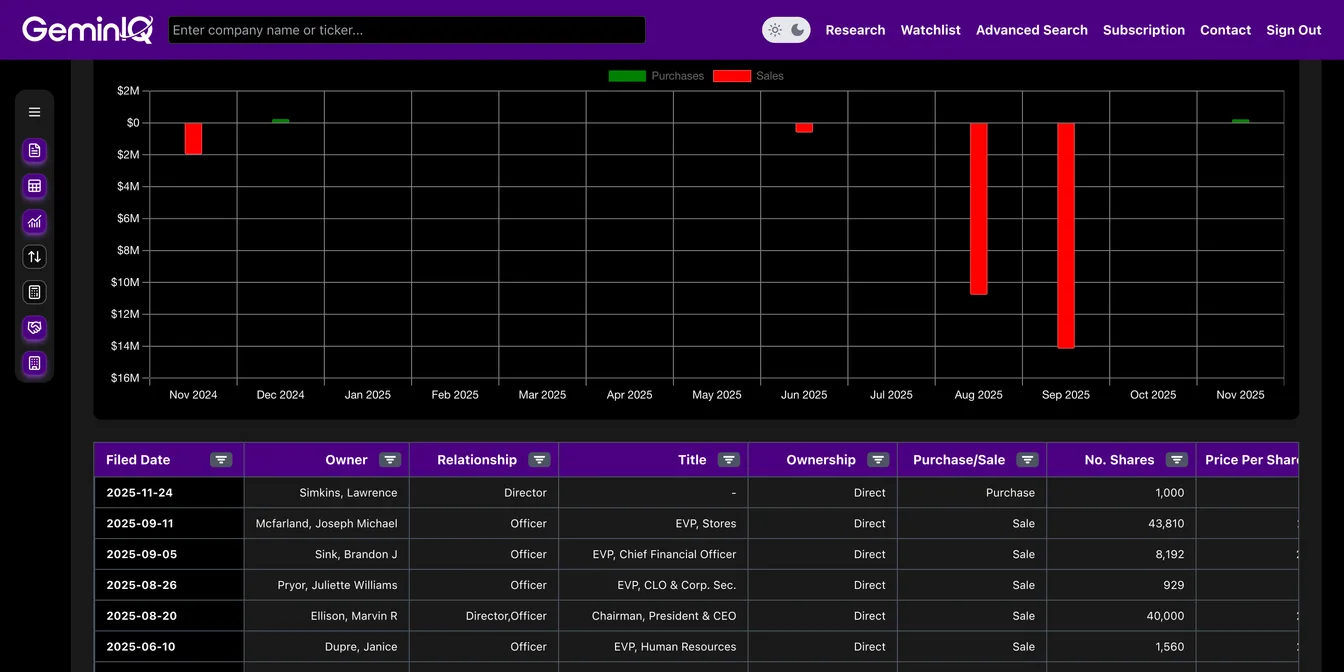
 GeminIQ Insider Transactions module showing Tractor Supply executives taking chips off the table.
Conversely, look at Home Depot. Despite playing a similar buyback game to Lowe's, their underlying operational engine—that lightning-fast 81.9 Day Inventory turn—is real. And the executives know it. The insider selling feed for Home Depot is practically crickets. The operators running the most efficient business are holding their equity tight.
 GeminIQ Insider Transactions module showing little selling activity from Home Depot executives.
The Analyst's Verdict
By actively jumping from high-level margins, down into the operational inventory metrics, ripping open the balance sheet structure, and verifying with institutional and insider flow data, our comparable company analysis completely shifted the narrative.
A surface-level screener will tell you these three retailers are identical because their gross margins match. But GeminIQ's deep-dive data reveals that Home Depot is the true operational powerhouse dominating inventory velocity. Wall Street funds are underweighting it, but Home Depot's C-suite's absolute refusal to sell shares proves they know their advantage is sustainable. Meanwhile, its peers are relying on massive financial engineering to keep up appearances while insiders rush for the exits.
Most financial websites rely on third-party aggregators that simplify or process data before you ever see it. We built GeminIQ because we believe you deserve a better fundamental analysis tool—one that goes beyond basic price charts and processed numbers. We extract our data directly from SEC 10-K and 10-Q filings to ensure that when you look at a balance sheet or a cash flow statement, you are seeing the numbers exactly how the company reported them. GeminIQ turns raw 10-K and 10-Q filings into traceable financial statements, calculated metrics, charts, screeners, and watchlists for US public company research. Our goal is to give you the tools to verify the narrative for yourself using clean, traceable data. Start researching now at GeminIQ.
Related Blogs
- See how the same comps methodology ranks three defense contractors
- See how the same balance sheet stress test applies to the airline sector
- See how Coca-Cola’s margin explosion hides behind 13 years of flat revenue
Disclaimer:
The content in this blog is for educational and entertainment purposes only and does not constitute financial, legal, or tax advice. Investing involves risk, including the loss of principal. The views expressed are my own and not intended as financial advice or a guarantee of future performance.