Coca-Cola 10-K Analysis (2026): The 13-Year Revenue Illusion and 28% Operating Margin
By Chad Hartman
Published March 8, 2026 · Last updated June 14, 2026
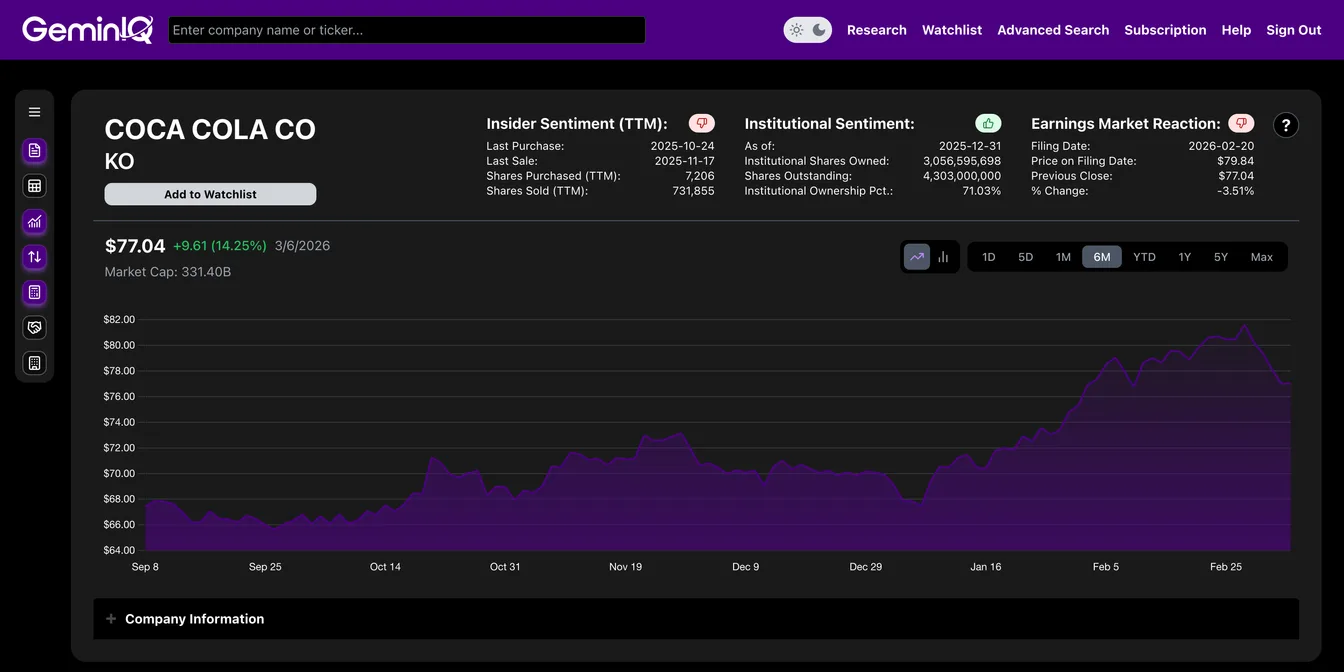
The Coca-Cola Company ($KO) just dropped its 2025 Annual Report (10-K filed Feb 20, 2026). If you pull up a standard financial screener, it looks like a dead-money stock: $47.9 Billion in revenue today versus $48.0 Billion in 2012. It looks like 13 years of zero top-line growth. But I used GeminIQ to audit the raw 10-K data, and the real story is one of the greatest corporate "refranchising" pivots in history. Here is the fundamental truth behind the ticker.
The Asset Dump (Capital Efficiency)
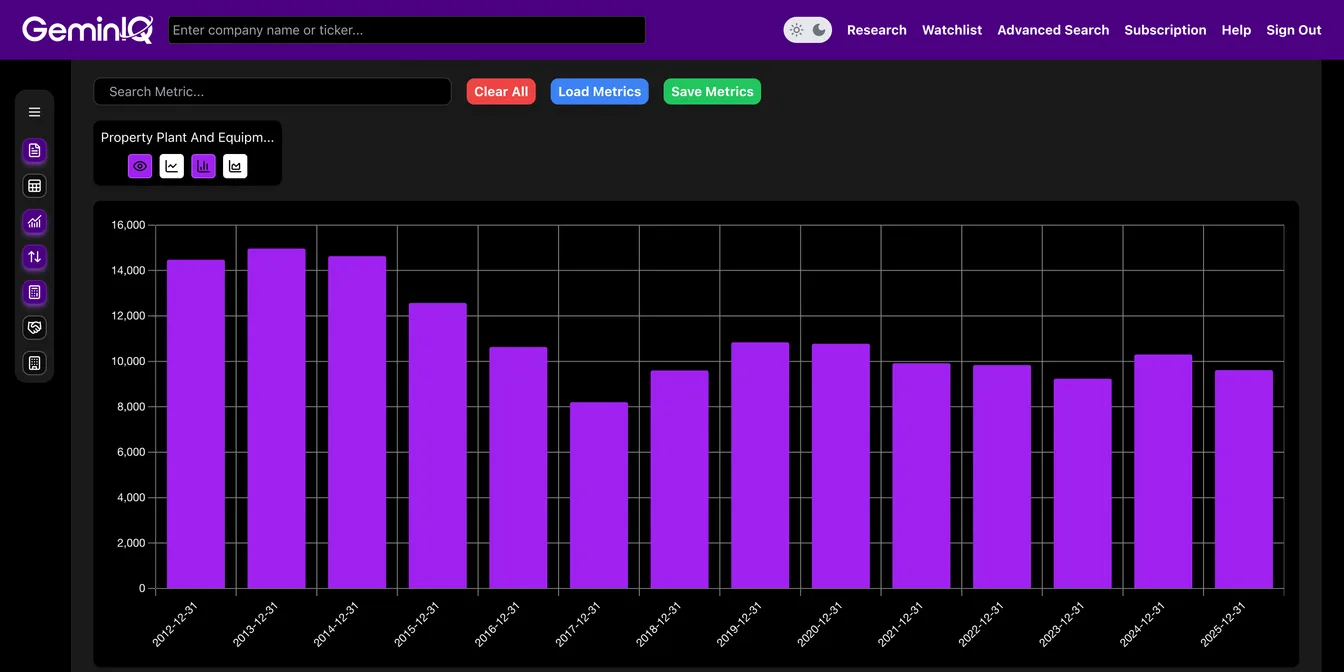
Why did Coca-Cola's revenue stagnate? Because they intentionally executed a massive "refranchising" strategy, selling off their heavy, capital-intensive bottling plants to become a pure-play, capital-light brand licensor and syrup manufacturer.
The Data: Look at Property, Plant, & Equipment (PP&E) on the Balance Sheet. It dropped from $14.4 Billion in 2012 to just $9.6 Billion today. They shed nearly $5 Billion in heavy factories and equipment.
The GeminIQ Edge: By directly auditing the historical Balance Sheet via GeminIQ, you can see Coca-Cola intentionally shrank their asset base to fundamentally restructure the business into a high-margin royalty machine.
The Margin Explosion
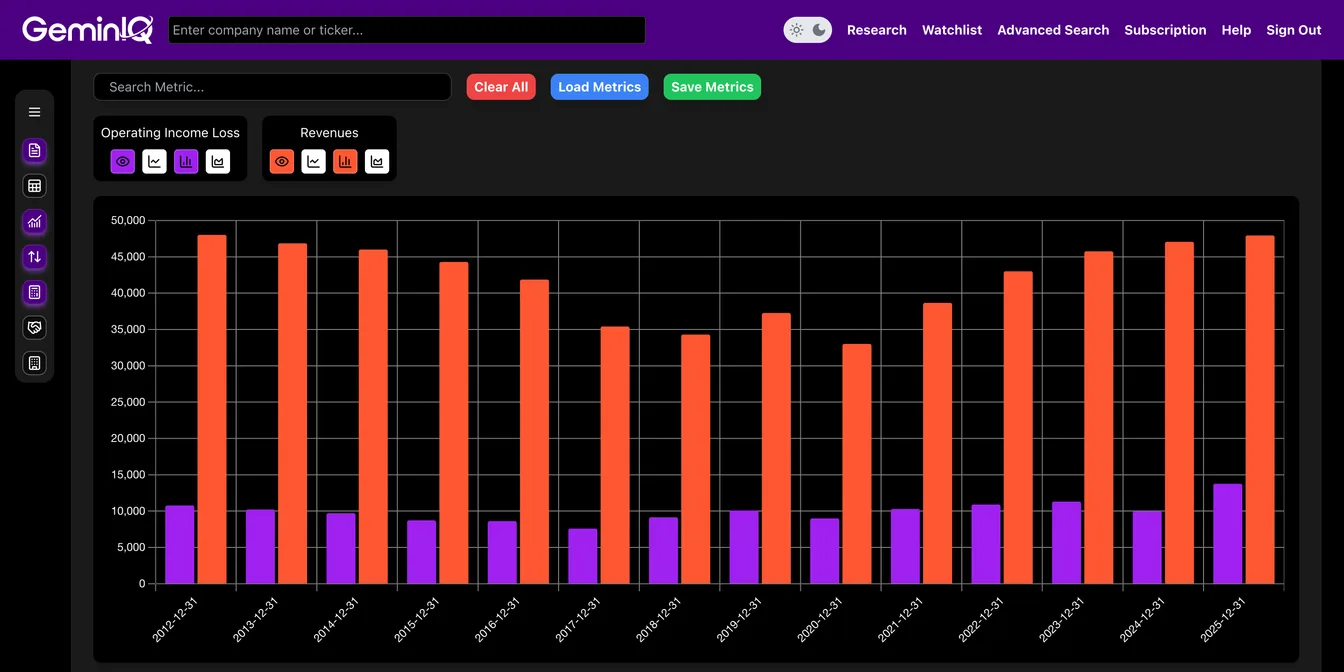
If revenue is identical to 2012, what happened to profits?
The Data: Because they are no longer running low-margin bottling plants, Operating Income exploded from $10.7 Billion (2012) to a staggering $13.7 Billion (2025). That is a massive jump in Operating Margin from 22.4% to 28.7%.
The GeminIQ Edge: Standard aggregators just show flat long-term revenue growth, which triggers basic value traps. By pulling raw Operating Income against Top-Line Revenue, we can prove that while Coca-Cola's total revenue plateaued, their profitability per dollar absolutely skyrocketed. They are making $3 Billion more in pure operating profit on the exact same revenue. Top-line growth is a vanity metric; raw margin data is the truth.
Timing the Entry (Behavioral Variance)
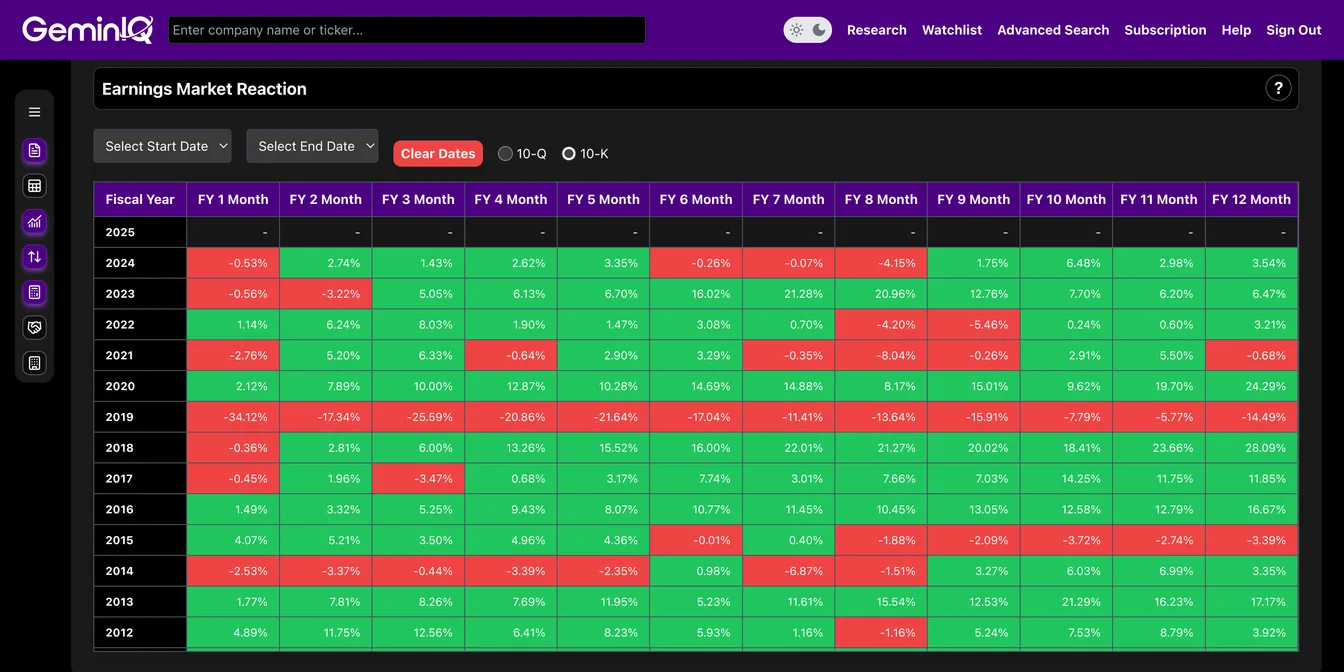
Should you buy the 10-K? I checked the Earnings Market Reaction Heat Map for $KO's historical 10-K filings.
The Data: Historically, Coca-Cola's 10-K does not generate massive day-one hype. Over the last several years, the stock averages a slight "flatline" or dip (-1.0% in Month 1), typically followed by a steady compounding rebound (+3.0% in Month 2).
Strategy suggests that Coca-Cola is a slow-and-steady compounder. Waiting out the initial 30-day window historically provides a highly stable entry point with a built-in Margin of Safety.
Research faster. Invest smarter.
Most financial websites rely on third-party aggregators that simplify or process data before you ever see it. We built GeminIQ because we believe you deserve a better fundamental analysis tool—one that goes beyond basic price charts and processed numbers. We extract our data directly from SEC 10-K and 10-Q filings to ensure that when you look at a balance sheet or a cash flow statement, you are seeing the numbers exactly how the company reported them. GeminIQ turns raw 10-K and 10-Q filings into traceable financial statements, calculated metrics, charts, screeners, and watchlists for US public company research. Our goal is to give you the tools to verify the narrative for yourself using clean, traceable data. Start researching now at GeminIQ.
Related Blogs
- See how Exxon pulled the same hidden-strength move through cash flow engineering
- See how Apple’s capital allocation masterclass tells a similar misunderstood story
- See how the retail sector’s surface-level margins hide the same structural divergence
Disclaimer: The content in this blog is for educational and entertainment purposes only and does not constitute financial, legal, or tax advice. Investing involves risk, including the loss of principal. The views expressed are my own and not intended as financial advice or a guarantee of future performance.