NVIDIA 10-K Analysis (2026): 66% ROIC and the $120 Billion Cash Machine
By Chad Hartman
Published February 26, 2026 · Last updated June 14, 2026
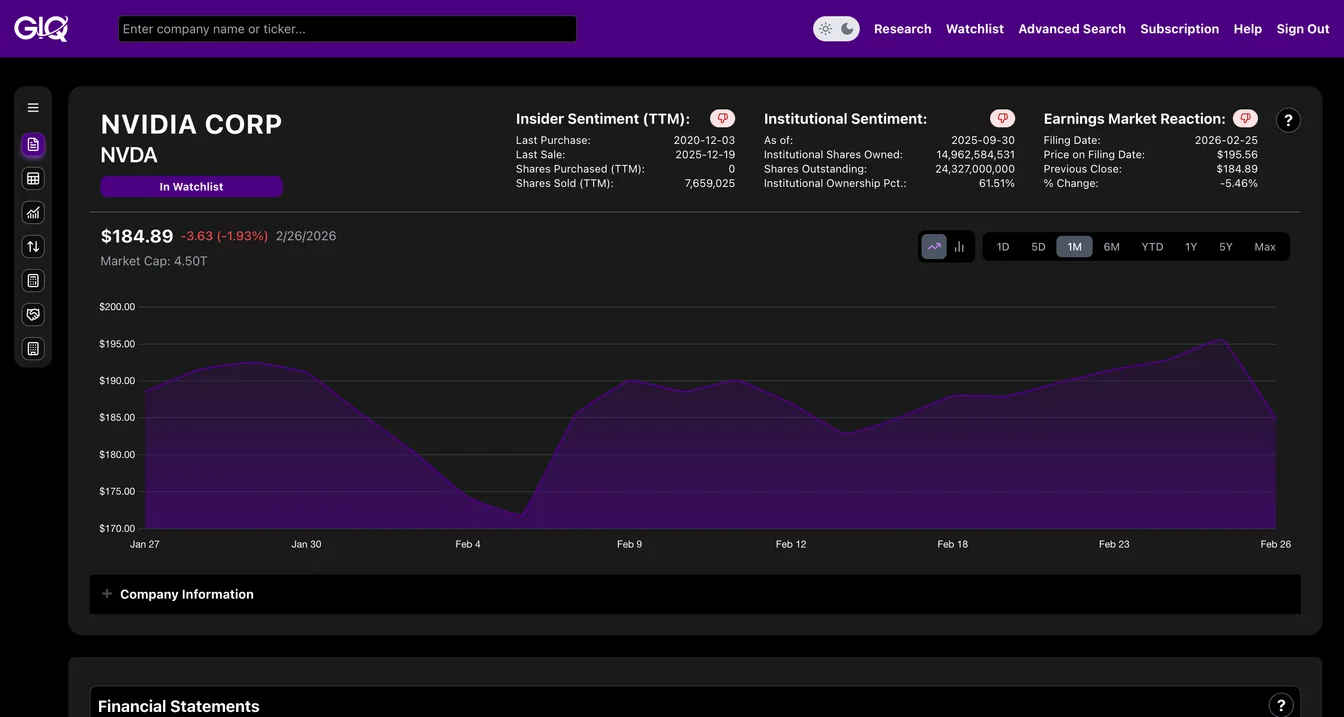
NVIDIA ($NVDA) just dropped its 2026 Annual Report (10-K filed Feb 25, 2026), and the top-line numbers are staggering. While the retail crowd is obsessed with the $215.9B revenue print, value investors are looking at the velocity of the business. I used GeminIQ to audit the raw 10-K. Here is the fundamental truth behind the ticker.
The Buyback "Stealth" Engine
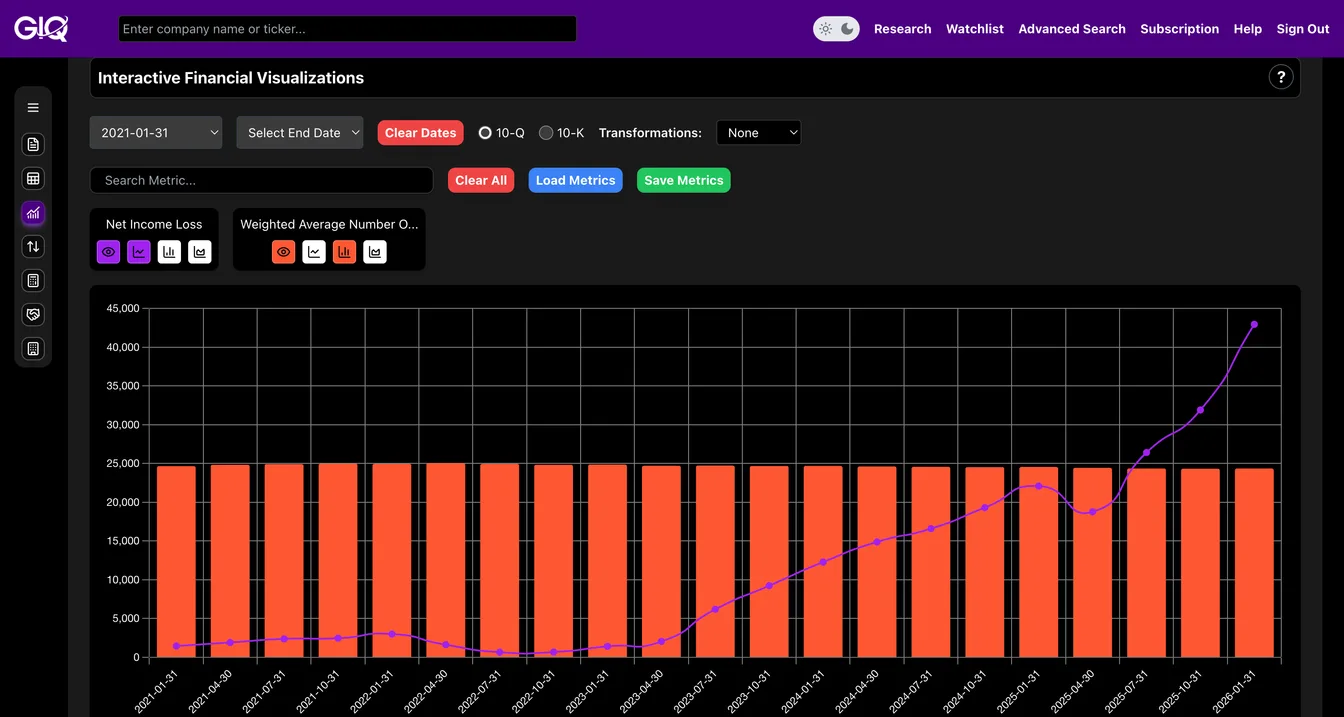
Most people think NVIDIA is just a growth play. But on GeminIQ, we track the Capital Return strategy. Unlike other tech giants that dilute shareholders via stock-based compensation, NVIDIA is actually shrinking the pie to your benefit.
The Purple Bars: Show the explosive Net Income hitting $120.1B TTM.
The Red Line: Shows the Basic Shares Outstanding dropping from 24.5B to 24.3B in just one year.
The GeminIQ Edge: Seeing the raw share count reduction alongside the income spike proves management is pivoting from "Growth at all costs" to "Capital Return Masterclass."
Inventory Velocity (The "Bull" Signal)
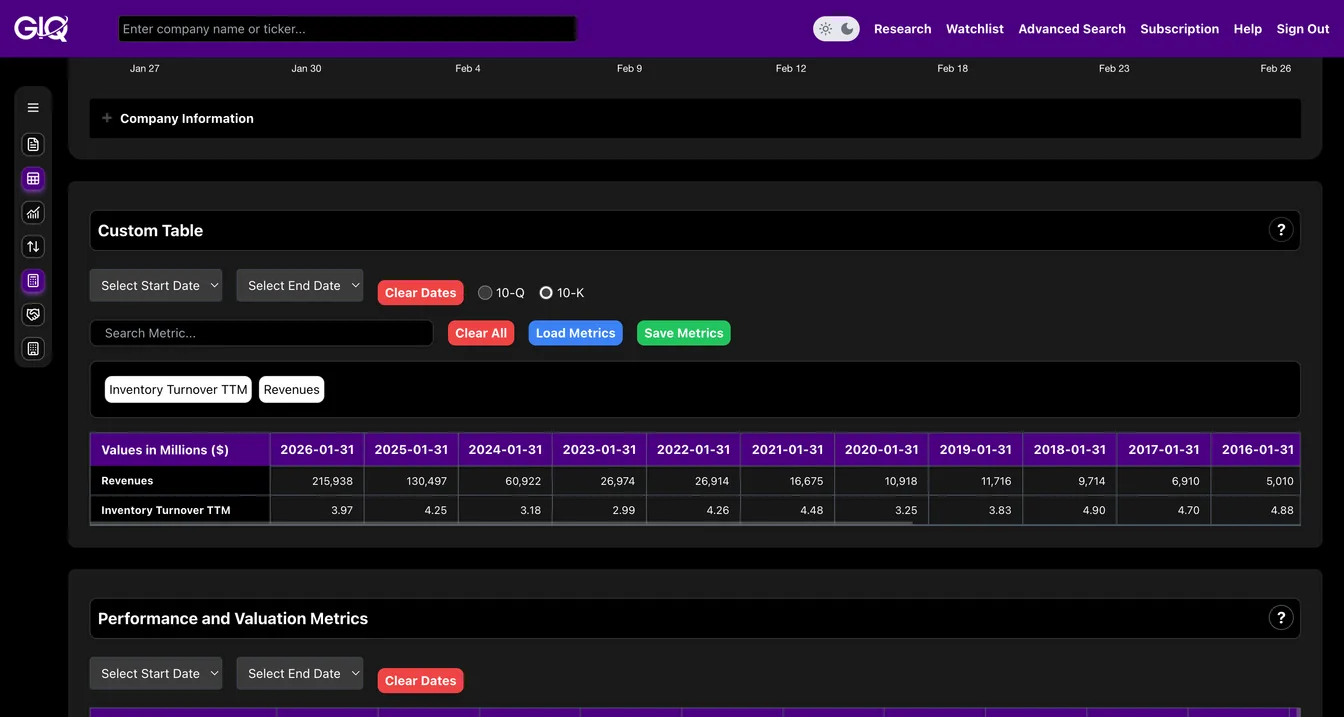
In hardware, "Inventory is Death." If chips sit on shelves, margins collapse. I used the GeminIQ Custom Table to audit NVIDIA's operational efficiency.
NVIDIA's Inventory Turnover (TTM) is sitting at an elite 3.97.
Management is moving product almost 4 times a year. Despite doubling revenue, they aren't letting stock pile up—they are shipping it as fast as it's made. This is the hallmark of a dominant moat.
Verifying the Moat with ROIC
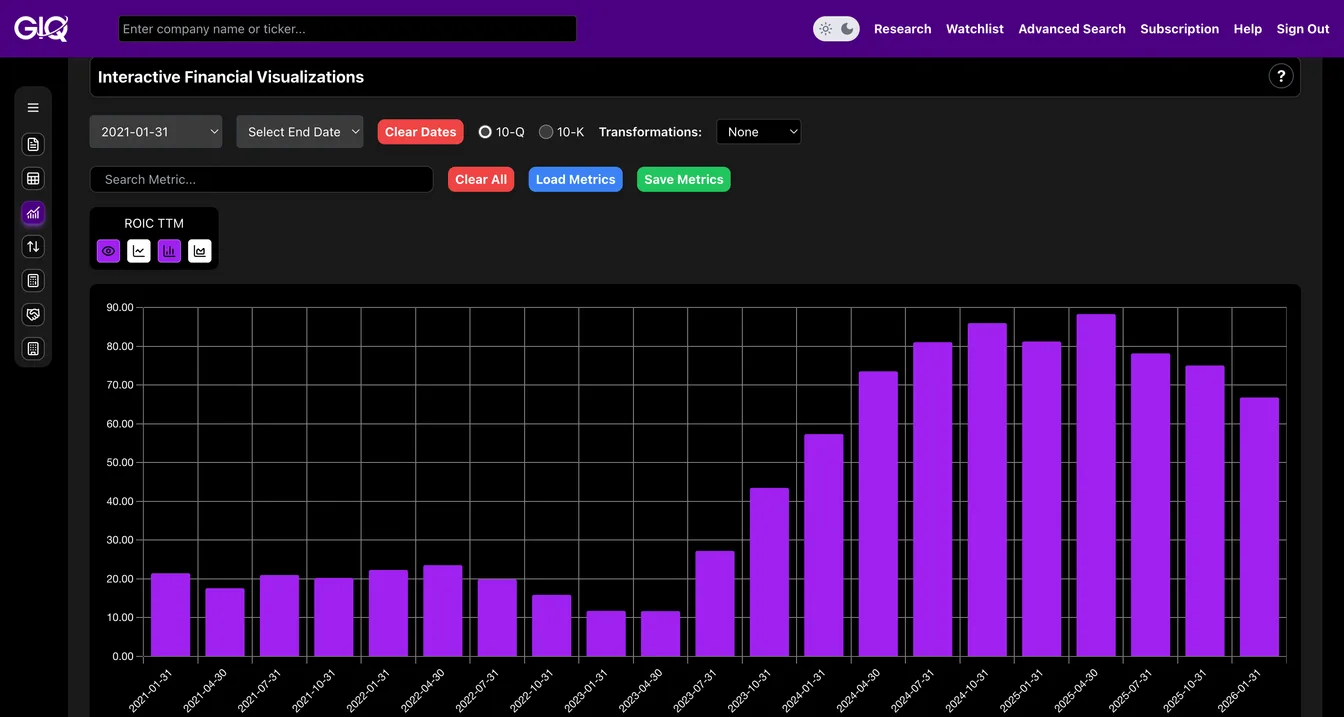
Is the capital being used wisely? We used the Visualizations Tab to check Return on Invested Capital (ROIC).
NVIDIA's ROIC (TTM) is a mind-bending 66.8%.
GIQ Tip: Management is turning every $1 of invested capital into nearly $0.67 of profit. This is elite-tier efficiency. As long as NVIDIA's ROIC stays above 50%, the fundamental machine is working perfectly.
Timing the Entry (Behavioral Variance)
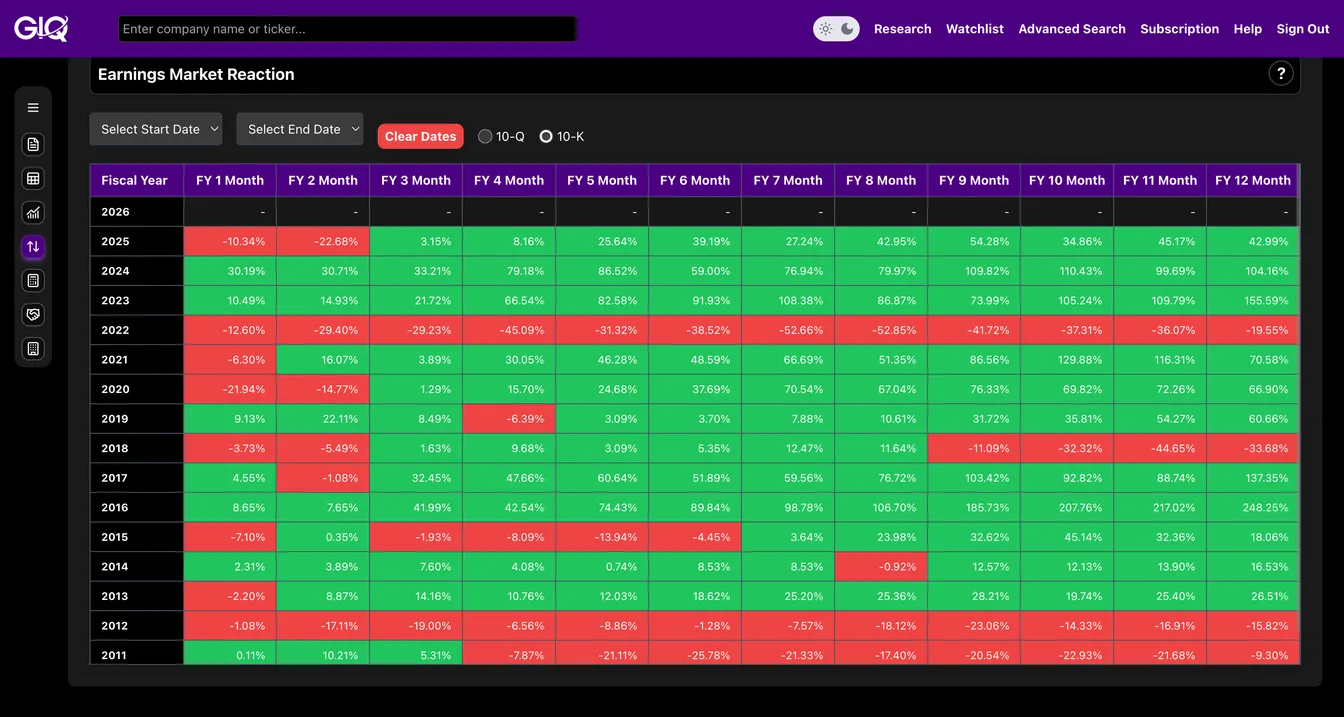
Should you buy the "All-Time High" post-filing? I checked the Earnings Market Reaction Heat Map for $NVDA's historical 10-K filings.
The Data: Historically, NVIDIA shows a high "Month 1" volatility following its annual report, often followed by a consolidation window in "Month 2."
Strategy suggests that waiting for the "Post-Earnings Drift" often yields a better Margin of Safety than chasing the day-of-report pop.
Research faster. Invest smarter.
Most financial websites rely on third-party aggregators that simplify or process data before you ever see it. We built GeminIQ because we believe you deserve a better fundamental analysis tool—one that goes beyond basic price charts and processed numbers. We extract our data directly from SEC 10-K and 10-Q filings to ensure that when you look at a balance sheet or a cash flow statement, you are seeing the numbers exactly how the company reported them. GeminIQ turns raw 10-K and 10-Q filings into traceable financial statements, calculated metrics, charts, screeners, and watchlists for US public company research. Our goal is to give you the tools to verify the narrative for yourself using clean, traceable data. Start researching now at GeminIQ.
Related Blogs
- See how Palantir’s dilution era ending tells the opposite story of NVIDIA’s buyback engine
- See how Amazon’s $19B in SBC is the direct contrast to NVIDIA’s shrinking share count
- See how Apple’s 91% ROIC and share cannibalization compares to NVIDIA’s capital return
Disclaimer: The content in this blog is for educational and entertainment purposes only and does not constitute financial, legal, or tax advice. Investing involves risk, including the loss of principal. The views expressed are my own and not intended as financial advice or a guarantee of future performance.