Palantir ($PLTR): The Dilution Era Is Over (And the Cash Flow is Exploding)
2026-03-05
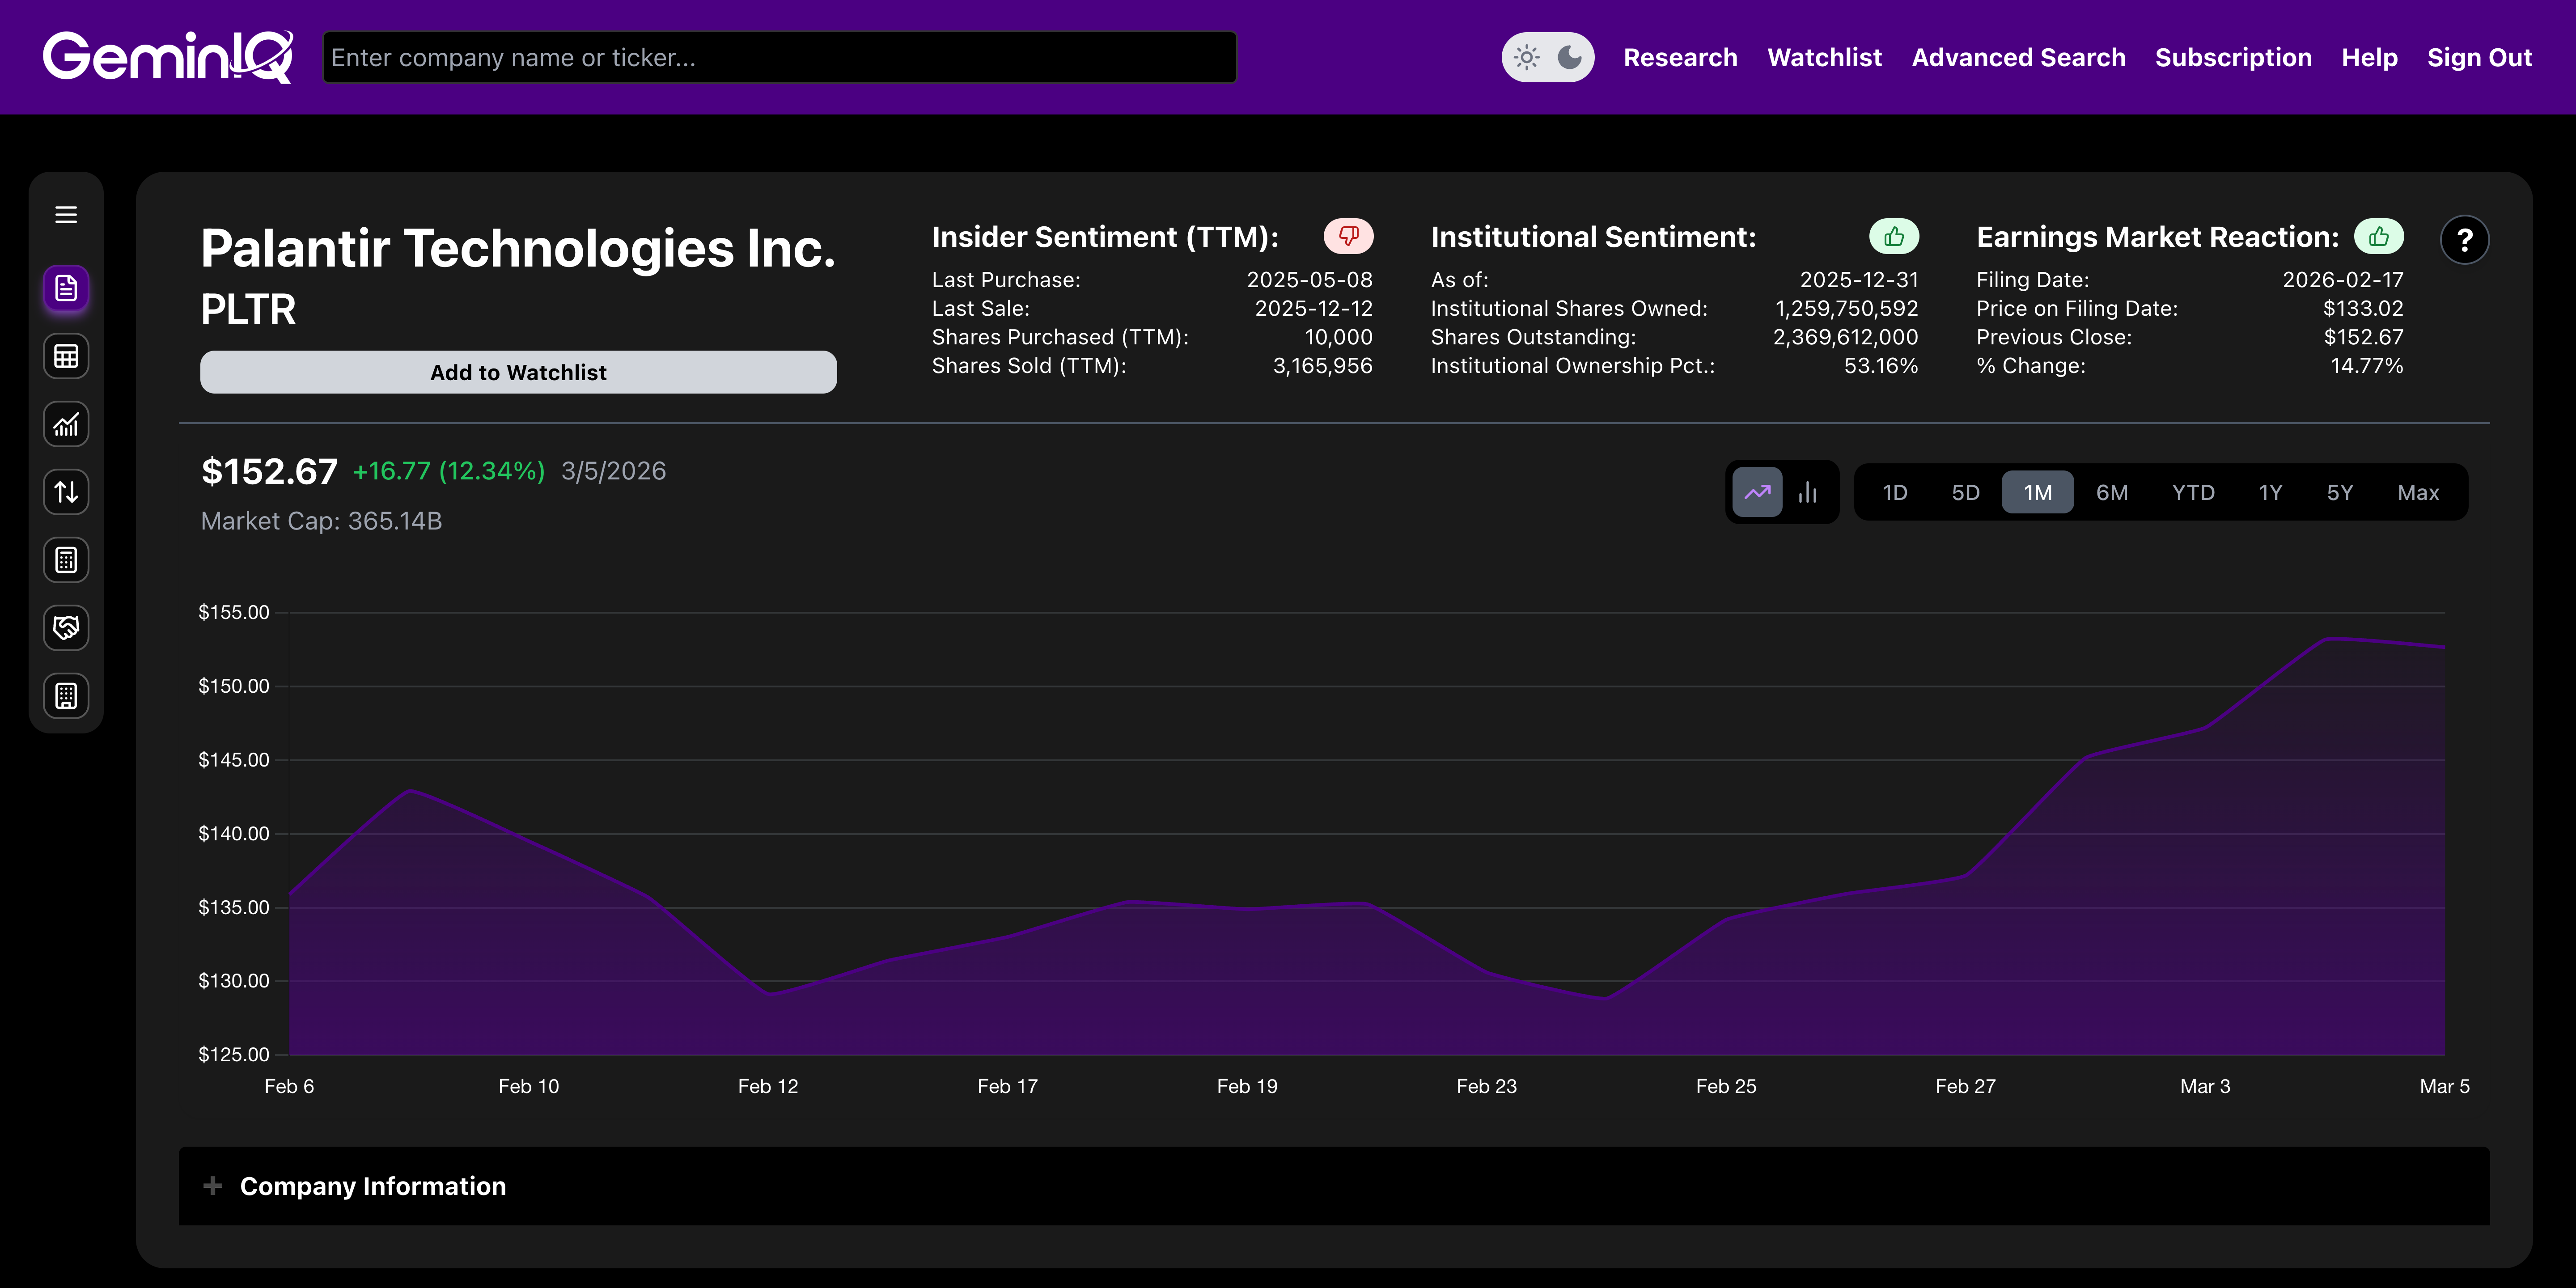
Palantir ($PLTR) just dropped its 2025 Annual Report (10-K filed Feb 17, 2026), and the top-line numbers are staggering. While the retail crowd is obsessed with the $4.47B revenue print, value investors are looking at the operating leverage. I used GeminIQ to audit the raw 10-K. Here is the fundamental truth behind the ticker.
The End of the Dilution Era
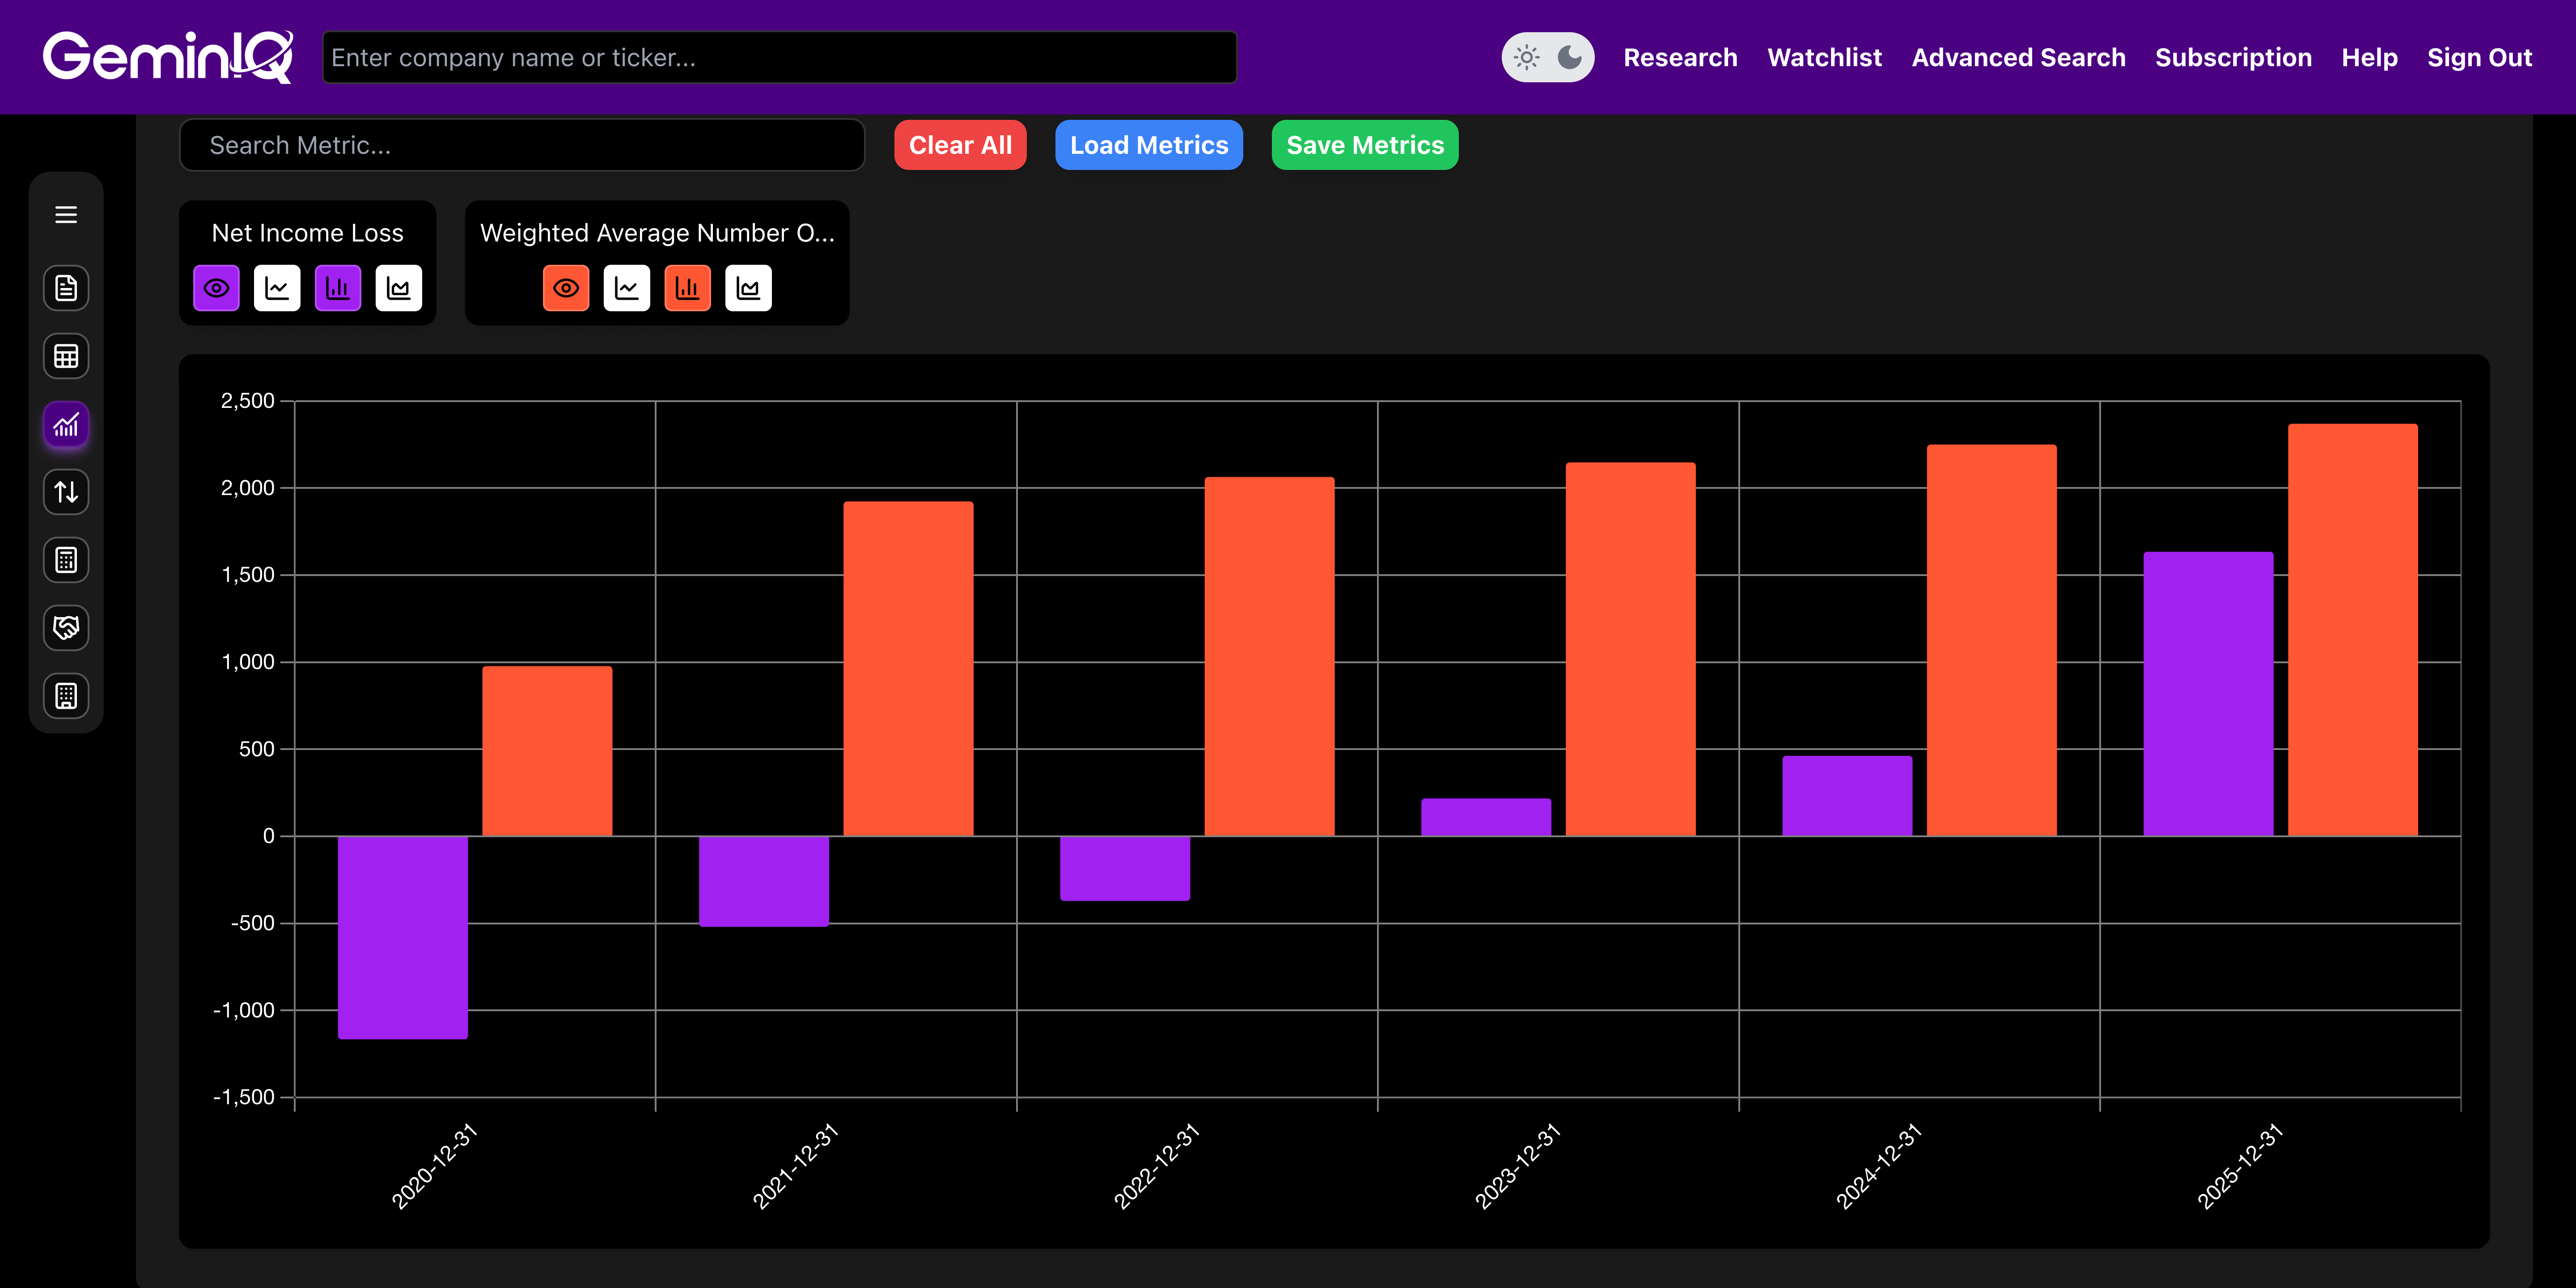
Most people think Palantir is a dilution trap from its early public days. But on GeminIQ, we track the Capital Return and dilution metrics.
The Purple Bars: Show the explosive GAAP Net Income hitting $1.63B TTM.
The Red Bars: Shows the Basic Shares Outstanding finally stabilizing.
The GeminIQ Edge: Seeing the raw share count stabilize alongside the income spike proves management is finally increasing your ownership value instead of paying it all out in stock.
The Software Economics (Gross Margin Expansion)
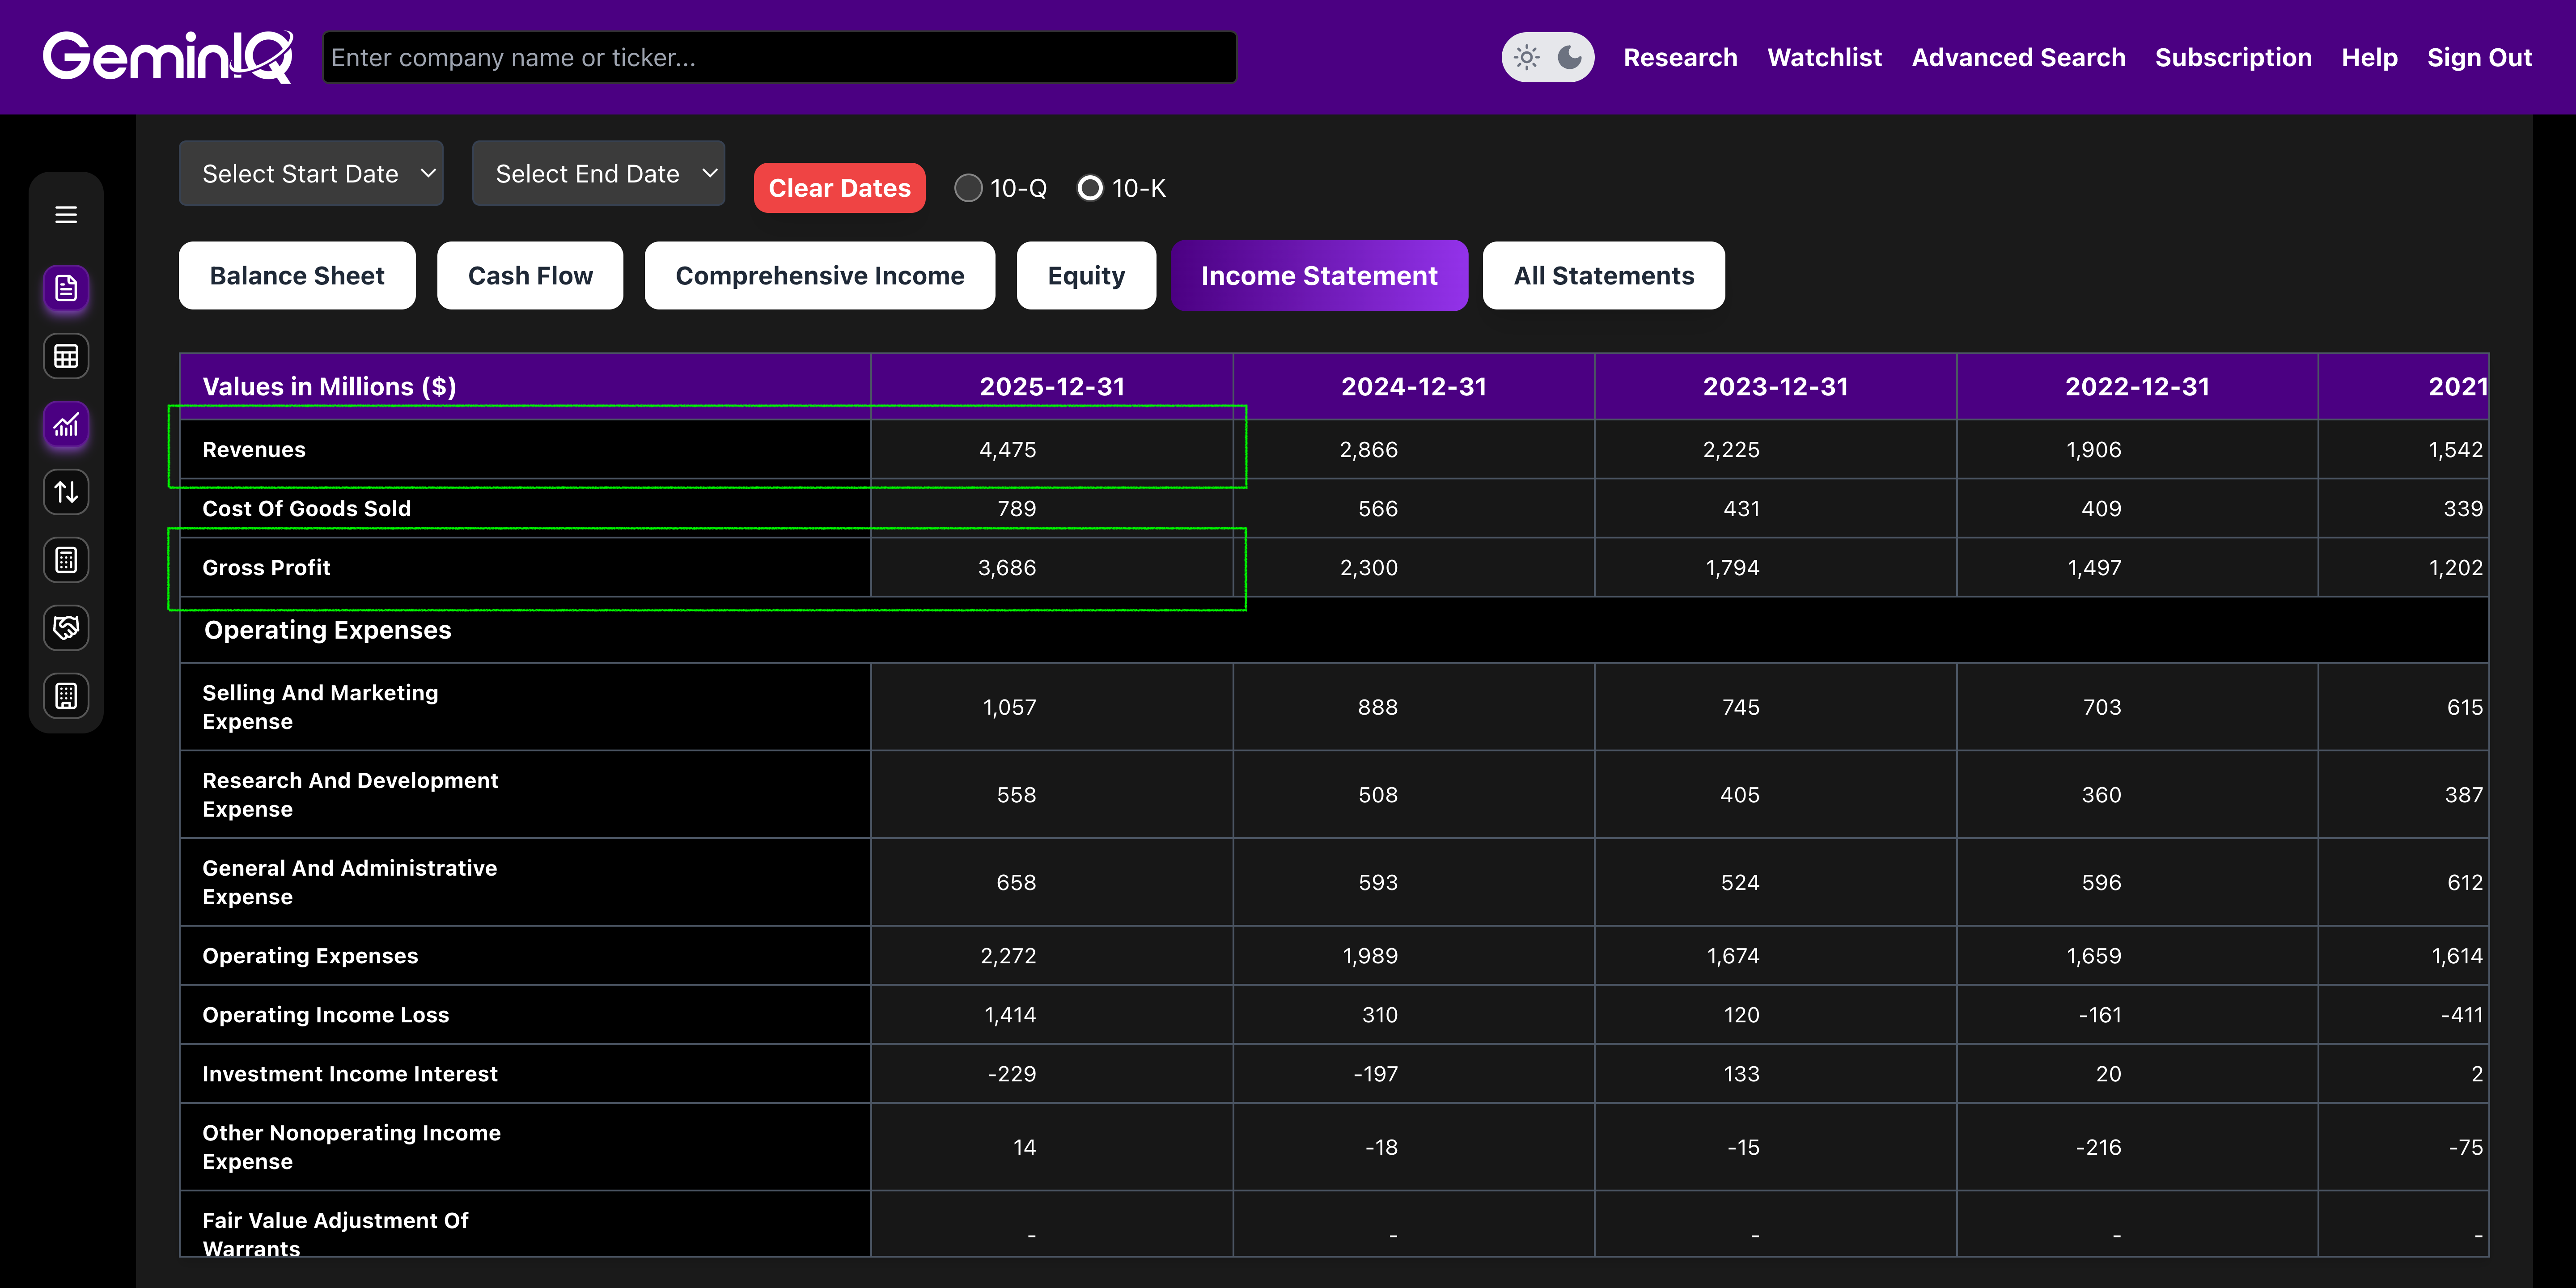
Before looking at the bottom line, you have to look at how much it costs them to deliver their product.
The Data: Palantir generated $4.47 Billion in Net Revenue with a Gross Profit of $3.68 Billion. That is a staggering 82.3% Gross Margin.
The GeminIQ Edge: Standard screeners give you blended percentages. By pulling the raw COGS against Revenue from the Income Statement, we can track their pricing power. They are scaling revenue without proportionally scaling costs.
The Free Cash Flow Machine
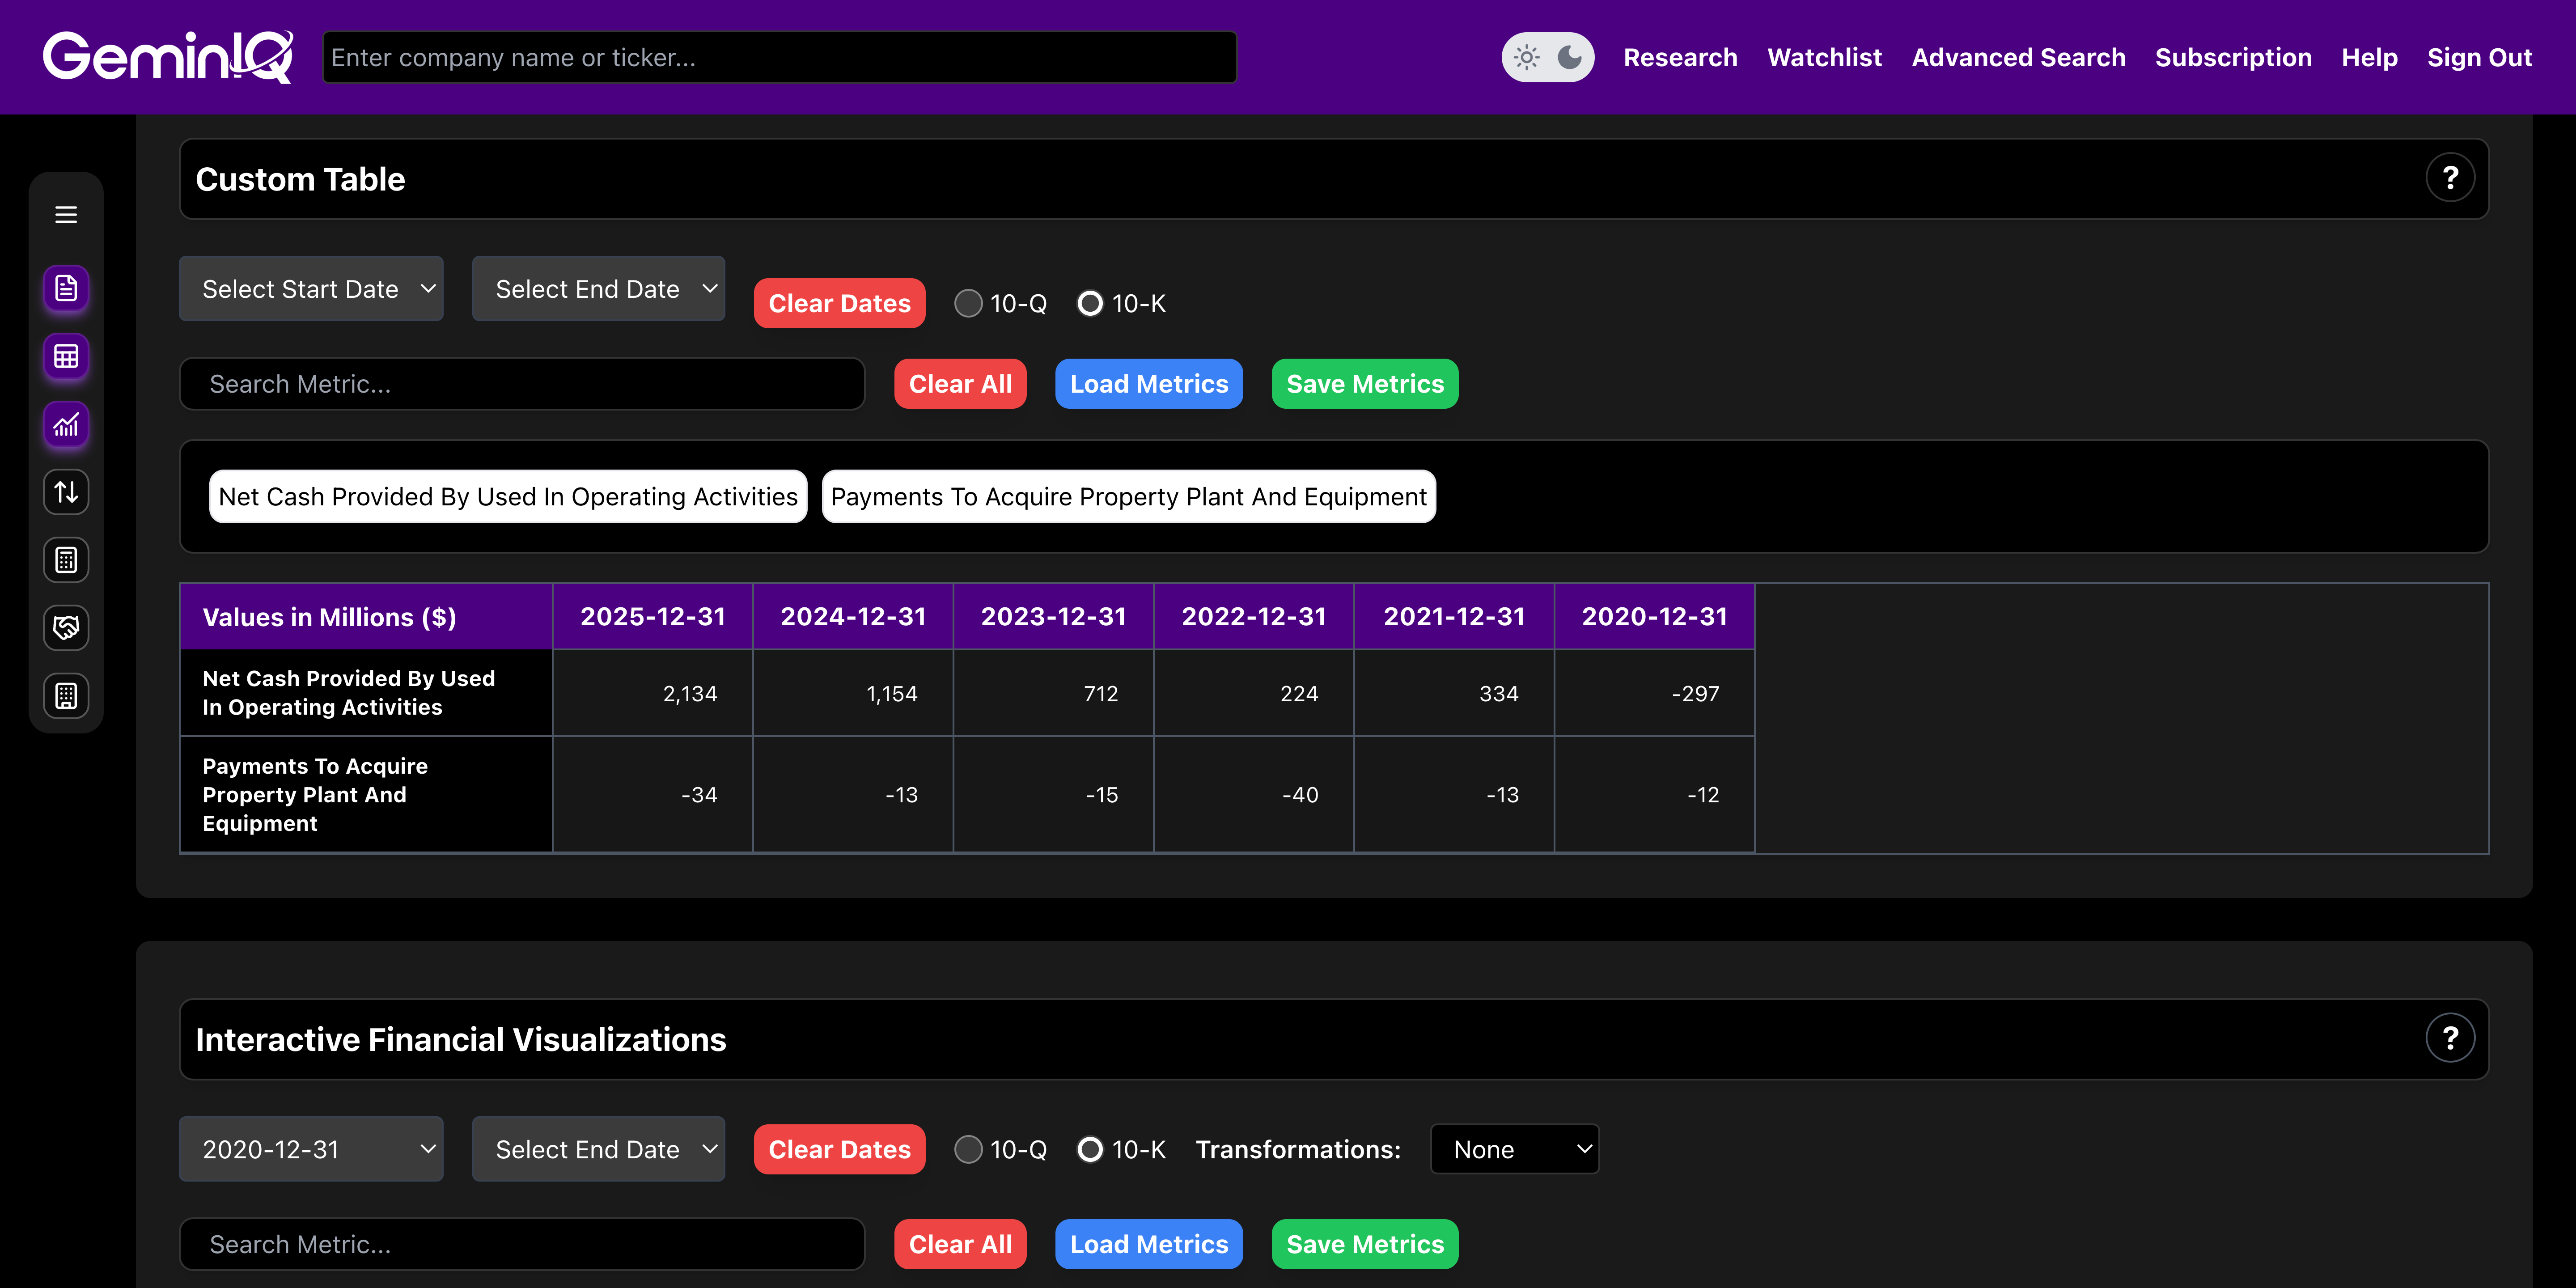
In software, "Free Cash Flow is King."
The Data: Palantir produced a staggering $2.13 Billion in Operating Cash Flow against a tiny $33 Million in Capex. That is an incredible 47% FCF margin.
The GeminIQ Edge: We pull raw Operating Cash Flow directly against Capital Expenditures. The numbers prove Palantir is running an extremely capital-light model.
Timing the Entry: The "Sell the News" Trap
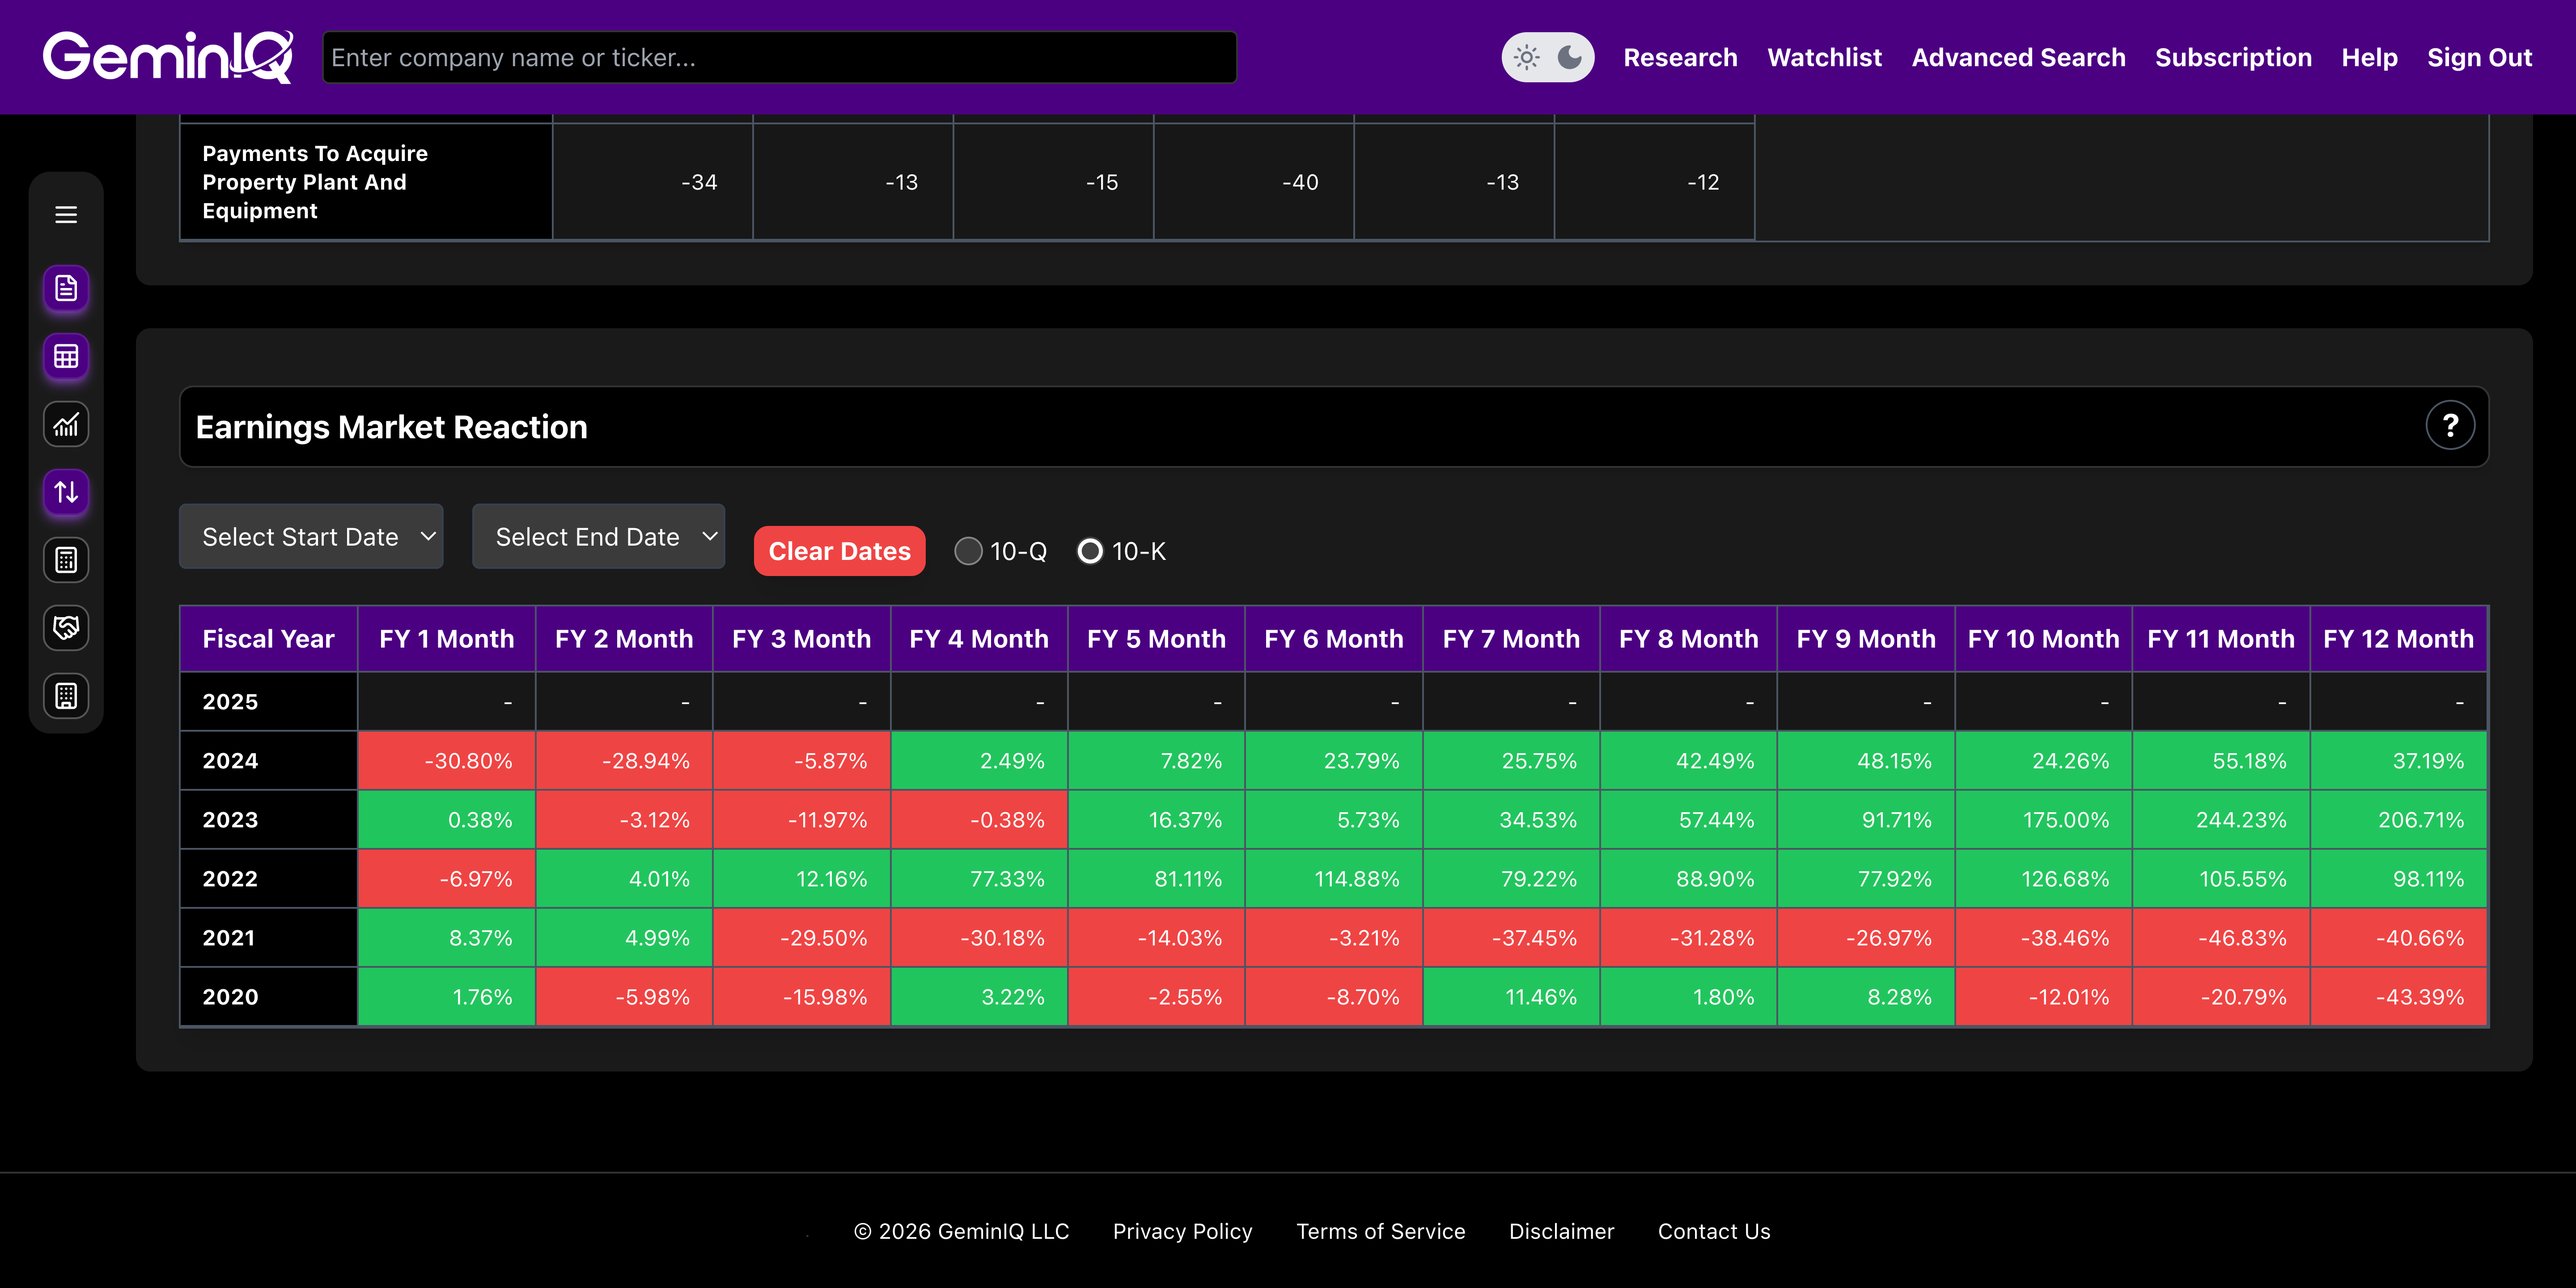
Should you buy the "All-Time High" post-filing? I checked the Earnings Market Reaction Heat Map for $PLTR's historical 10-K filings, and the data issues a massive warning.
The Data: While PLTR historically trends positive after most earnings reports, the annual 10-K is heavily skewed as a "Sell the News" event. Over the last 5 years, the stock averages a -5.4% drop in Month 1 and a -5.8% drop in Month 2 following the 10-K. Last year's 10-K triggered a 30% drawdown in the first 30 days.
Strategy suggests that aggressively buying the day-of-report hype for the 10-K is a statistical trap. If you are building a position, history favors waiting out the Q4 slump to secure a proper Margin of Safety.
Research faster. Invest smarter.
Most financial websites rely on third-party aggregators that simplify or process data before you ever see it. We built GeminIQ because we believe you deserve a better fundamental analysis tool—one that goes beyond basic price charts and processed numbers. We extract our data directly from SEC 10-K and 10-Q filings to ensure that when you look at a balance sheet or a cash flow statement, you are seeing the numbers exactly how the company reported them. Start researching now at GeminIQ.com.
Disclaimer: The content in this blog is for educational and entertainment purposes only and does not constitute financial, legal, or tax advice. Investing involves risk, including the loss of principal. The views expressed are my own and not intended as financial advice or a guarantee of future performance.