How to Read a 10-Q in Under 30 Minutes (2026)
2026-04-30
Public companies file a 10-K once a year. They file a 10-Q three times a year — after each of the first three fiscal quarters. (The fourth quarter gets folded into the 10-K.) That means 10-Qs are where new information surfaces between annual reports: revenue acceleration or deceleration, margin compression, balance sheet deterioration, new legal risks, and management's own quarter-by-quarter commentary on performance.
Most value investors read the annual 10-K carefully and then skim — or skip — the quarterly filings. That's a mistake. If you know where to look, a 10-Q can be read in under 30 minutes, and it tells you things the annual report won't show for months.
In this guide, we'll break down how to read a 10-Q using Apple's Q1 FY2026 filing (quarter ending December 27, 2025) as our working example, with comparisons against the prior year quarter. We'll also show how GeminIQ structures this quarterly data automatically — so you can skip the manual extraction and go straight to analysis.
Or explore Apple's data now — no account needed →
Follow along, open Apple's 10-K here →
10-Q vs. 10-K: What's Different?
Before diving in, it helps to understand what a 10-Q is not. A 10-Q is shorter (typically 30–60 pages vs. 100+ for a 10-K), and the financial statements are unaudited — reviewed by the company's independent accountant, but not subjected to the full audit procedures applied to the annual filing. The 10-Q also omits several sections that appear in the 10-K: the full business description (Item 1), the complete risk factors section (Item 1A), and the detailed notes on accounting policies.
What the 10-Q does include is everything you need to assess how the business performed in the most recent quarter: condensed financial statements with year-over-year comparisons, management's quarterly discussion and analysis, updated risk disclosures (only material changes), and any material legal or regulatory developments. Think of the 10-Q as a delta — it tells you what changed since the last filing.
Here's a simple framework for reading one in under 30 minutes, broken into five steps.
Minute 1–5: Start with the Income Statement
Open the 10-Q and go directly to the Condensed Consolidated Statements of Operations. This is the quarterly income statement. It shows the current quarter alongside the same quarter from the prior year, giving you an immediate year-over-year comparison.
For Apple's Q1 FY2026 (the holiday quarter ending December 27, 2025):
| Line Item | Q1 FY2026 | Q1 FY2025 | Change |
|---|---|---|---|
| Total Net Sales | $143.8B | $124.3B | +15.7% |
| Cost of Sales | $74.5B | $66.0B | +12.9% |
| Gross Margin | $69.2B | $58.3B | +18.8% |
| R&D Expense | $10.9B | $8.3B | +31.7% |
| SG&A Expense | $7.5B | $7.2B | +4.4% |
| Operating Income | $50.9B | $42.8B | +18.7% |
| Net Income | $42.1B | $36.3B | +15.9% |
| Diluted EPS | $2.84 | $2.40 | +18.3% |
In five minutes, you already know the quarter's story: revenue accelerated to 15.7% growth (up from 6.4% for the full fiscal year 2025), gross margins expanded because revenue grew faster than costs, and EPS grew even faster than net income thanks to continued share buybacks reducing the denominator.
Two things to flag for deeper analysis: R&D spending surged 31.7%, which is unusually high for Apple and signals a significant step-up in investment — the MD&A attributes this to increases in infrastructure-related costs, headcount-related expenses, and engineering program costs. And EPS growth of 18.3% outpacing net income growth of 15.9% tells you the buyback program is adding roughly 2–3 percentage points of EPS accretion per year.
GeminIQ Tip: On GeminIQ, every quarterly line item is extracted automatically from the filing with its XBRL tag preserved. You don't need to manually build a Q-over-Q comparison table — GeminIQ structures 17+ years of quarterly data for every SEC filer, ready for trend analysis the moment the filing hits EDGAR.
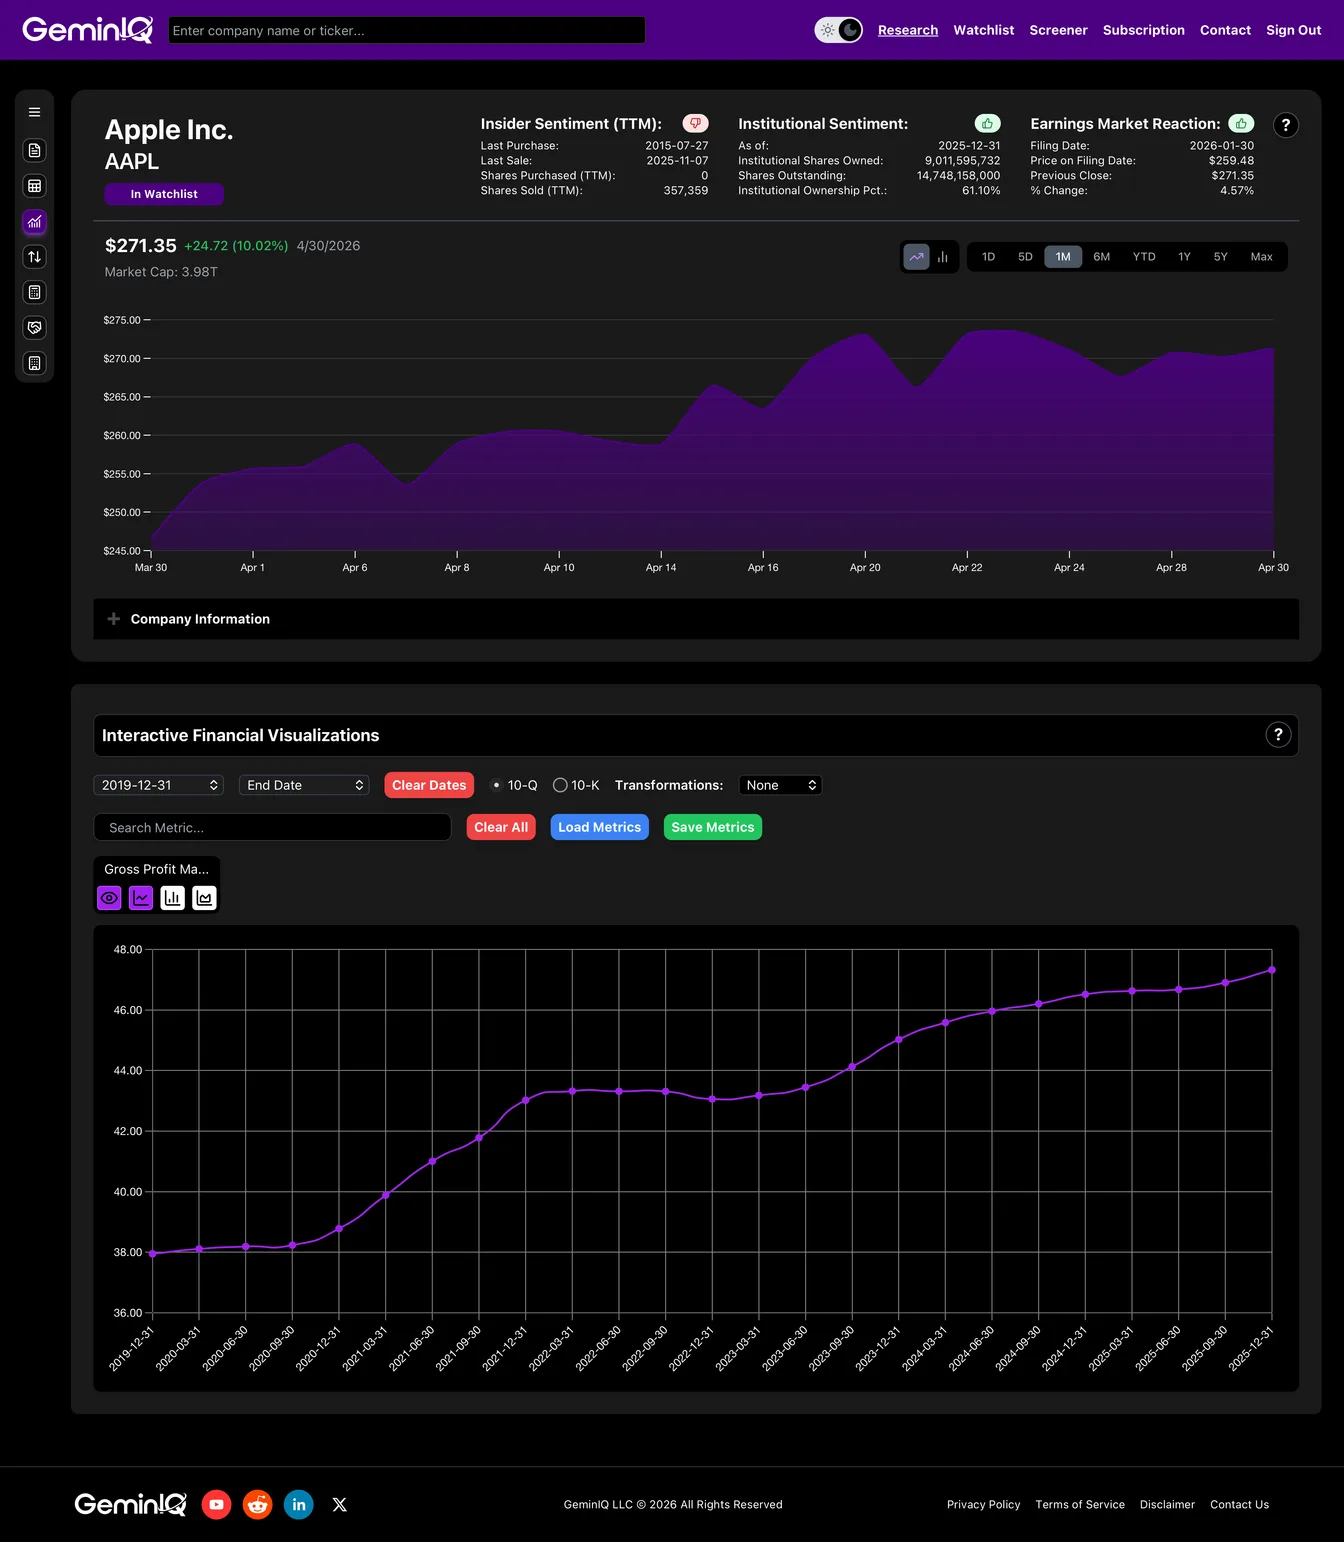
Minute 5–10: Check the Gross Margin Trend
Gross margin is the single most important line item for value investors reading a 10-Q. It tells you whether the company's pricing power and cost structure are holding, improving, or deteriorating — quarter by quarter.
For Apple's Q1 FY2026:
- Gross margin percentage: 48.2% ($69.2B / $143.8B)
- Prior year Q1: 46.9% ($58.3B / $124.3B)
- Full year FY2025: 46.9%
Gross margin expanded approximately 130 basis points year-over-year. That's significant. The Q1 FY2026 MD&A breaks this down further: Products gross margin rose from 39.3% to 40.7%, driven by a different mix of products but partially offset by tariff costs. Services gross margin climbed from 75.0% to 76.5%, driven by a different mix of services. Both segments expanded — an uncommon occurrence that signals broad-based margin improvement.
In Apple's FY2025 10-K, management noted that Products gross margin was under pressure from tariff costs. A Q1 FY2026 expansion to 40.7% suggests that either the tariff headwind has been partially offset by pricing, or the product mix shifted toward higher-margin hardware (iPhone Pro models drove the quarter, per the MD&A). Meanwhile, the Services mix shift continues to pull the overall blended margin higher — Services now carry 76.5% gross margins vs. 40.7% for Products.
This is exactly the kind of inflection a quarterly filing catches before the annual report. The 10-K gives you the full-year average. The 10-Q shows you the trajectory.
GeminIQ Tip: GeminIQ's Interactive Visualizations let you chart gross margin percentage across every quarter going back 17+ years — with line, bar, or area charts, log or linear scaling, and z-score normalization. You can spot margin inflections visually in seconds rather than building a spreadsheet.
Minute 10–15: Read the Cash Flow Statement
The quarterly cash flow statement shows you where cash actually went during the quarter — and it often tells a different story than the income statement.
For Apple's Q1 FY2026:
- Operating cash flow: $53.9B (vs. $29.9B in Q1 FY2025 — up 80%)
- Capital expenditures: $2.4B
- Free cash flow: $51.6B
- Stock repurchases: $24.7B
- Dividends paid: $3.9B
- Debt repayment: $2.2B term debt + $5.9B commercial paper (net)
- Cash taxes paid: $3.4B (vs. $18.7B in Q1 FY2025)
The standout number here is cash taxes paid: $3.4 billion vs. $18.7 billion in the prior year quarter. That's an 82% drop. Why? Because Q1 FY2025 included a massive payment related to the European Commission State Aid Decision — a one-time $15.8 billion obligation that Apple settled by releasing escrowed funds. If you didn't know about that one-time item (disclosed in Apple's FY2024 10-K), you'd misread Q1 FY2025's depressed operating cash flow as a normal baseline and overstate the improvement in Q1 FY2026.
This is the value of reading 10-Qs in sequence. Each quarter builds context for the next one.
Operating cash flow of $53.9 billion in a single quarter — enough to fund the entire buyback program and dividend with $25.3 billion left over — confirms the cash generation machine is running at full capacity.
Minute 15–20: Scan the Balance Sheet for Changes
The quarterly balance sheet is a snapshot, not a flow statement. Read it by looking for meaningful changes from the prior quarter-end or year-end.
Key balance sheet items as of December 27, 2025 (vs. September 27, 2025 year-end):
| Item | Dec 2025 | Sep 2025 | Change |
|---|---|---|---|
| Cash & Equivalents | $45.3B | $35.9B | +$9.4B |
| Total Current Assets | $158.1B | $148.0B | +$10.1B |
| Total Assets | $379.3B | $359.2B | +$20.1B |
| Commercial Paper | $2.0B | $8.0B | -$6.0B |
| Current Term Debt | $11.8B | $12.4B | -$0.5B |
| Non-Current Term Debt | $76.7B | $78.3B | -$1.6B |
| Total Debt | $90.5B | $98.7B | -$8.1B |
| Total Shareholders' Equity | $88.2B | $73.7B | +$14.5B |
| Current Ratio | 0.97 | 0.89 | Improving |
Several things jump out. Total debt dropped $8.1 billion in a single quarter, driven primarily by a $6.0 billion net reduction in commercial paper (from $8.0 billion to $2.0 billion) alongside $2.2 billion in term debt maturities. This is Apple actively deleveraging. Shareholders' equity grew $14.5 billion, driven by the $42.1 billion in net income exceeding the $29.1 billion returned through buybacks ($25.2B repurchased) and dividends and dividend equivalents ($3.9B). Apple's accumulated deficit — which had been a talking point for years — shrank dramatically from $(14.3B) to just $(2.2B) and is on track to turn positive within the next quarter.
The current ratio improved from 0.89 to 0.97. It's still below 1.0, but trending in the right direction. For a company generating $54 billion in quarterly operating cash flow, this ratio is about working capital efficiency, not solvency risk.
GeminIQ Tip: GeminIQ's Custom Tables let you build a quarterly balance sheet comparison template once and apply it to any company. Pick the line items that matter to your thesis, save the template, and run it across any SEC filer instantly — with every number traceable to its XBRL tag.
Minute 20–25: Read the MD&A (Quickly)
The MD&A section in a 10-Q is shorter than its 10-K counterpart, but it contains management's own explanation of what happened during the quarter. Read it for three things:
1. Segment performance. Apple's Q1 FY2026 shows how the holiday quarter performed across all five geographic segments:
| Segment | Q1 FY2026 | Q1 FY2025 | Change |
|---|---|---|---|
| Americas | $58.5B | $52.6B | +11% |
| Europe | $38.1B | $33.9B | +13% |
| Greater China | $25.5B | $18.5B | +38% |
| Japan | $9.4B | $9.0B | +5% |
| Rest of Asia Pacific | $12.1B | $10.3B | +18% |
The standout: Greater China surged 38% year-over-year — a dramatic reversal from FY2025's full year when Greater China was the only declining segment. The MD&A attributes this entirely to higher iPhone sales. This is a thesis-changing data point for anyone who had been bearish on Apple's China exposure.
2. Product and Services mix. The MD&A breaks down that iPhone revenue surged 23% to $85.3B (driven by Pro models), while Mac declined 7% and Wearables dipped 2%. Services grew 14% to $30.0B. For a company where Services margins are nearly double Products margins, this mix data is essential for margin modeling.
3. Forward-looking commentary. The Q1 FY2026 MD&A contains significant discussion of tariff uncertainty, including a new Section 232 semiconductor investigation that was announced in January 2026. The MD&A explicitly notes that tariff costs partially offset Products gross margin improvement — a signal that the tariff headwind is real but manageable so far.
Don't try to read every word of the MD&A. Scan the segment and product tables first, read the commentary around any segment that surprised you, and move on.
Minute 25–30: Check for Red Flags
Use the final five minutes to scan three sections for anything that warrants further investigation:
Legal proceedings. Apple's 10-K disclosed ongoing antitrust litigation from the DOJ, DMA investigations in the EU, and the Epic Games injunction. The 10-Q updates any material developments. In Q1 FY2026, the 10-Q discloses several significant updates: the European Commission fined Apple €500 million in the DMA Article 5(4) investigation (Apple has appealed), and issued preliminary findings in a second DMA investigation that could result in fines up to 10% of worldwide net sales. On the Epic Games front, the Ninth Circuit issued an order in December 2025 upholding parts of the district court's injunction while allowing Apple to charge a commission on link-out purchases — a partial win for Apple, though the case remains active. These legal risks, collectively, have meaningful implications for Apple's App Store economics and Services revenue trajectory.
Risk factor updates. Unlike the 10-K, the 10-Q only discloses material changes to risk factors — not the full list. If a new risk factor appears in the 10-Q, pay attention. It means something has changed since the annual filing that management considers significant enough to disclose.
Insider transactions and institutional ownership. These won't be in the 10-Q itself, but you should check them after reading the filing. On GeminIQ, you can see that Apple's insider transaction timeline shows consistent executive selling through equity compensation vesting. As of Q1 FY2026, the 10-Q's "Other Information" section discloses that CFO Kevan Parekh and SVP Deirdre O'Brien both adopted new Rule 10b5-1 trading plans during the quarter — routine compensation-related activity, not conviction-driven exits.
GeminIQ's Institutional Ownership data shows institutional investors have been steadily increasing their positions in Apple, a trend that has accelerated alongside the company's improving financial profile. Rising institutional ownership alongside rising prices suggests professional capital is accumulating, not distributing.
Check Apple's latest insider activity and institutional trends on GeminIQ →
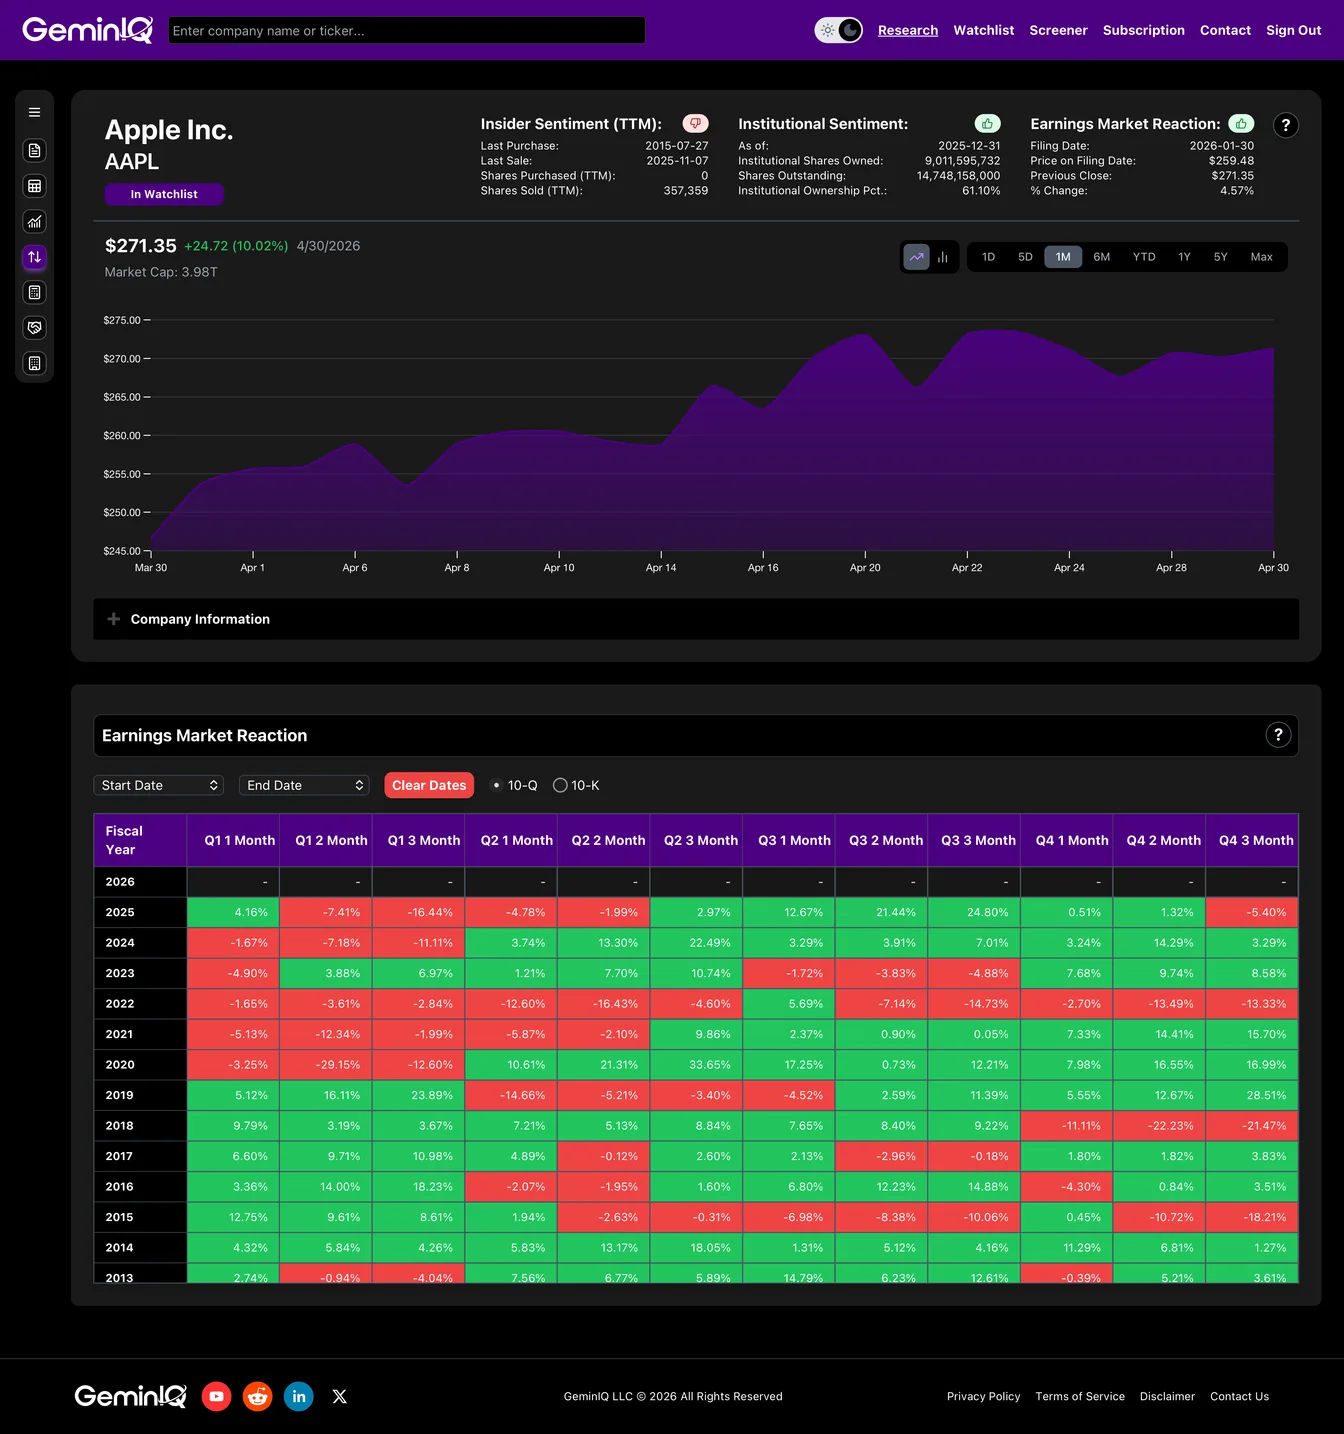
After the 10-Q: What Happened Next?
Reading the 10-Q tells you what the company reported. But value investors also want to know how the market reacted — and whether historical patterns suggest a buying opportunity.
GeminIQ's Earnings Market Reaction Heatmap tracks exactly how a stock performed 1 to 12 months after each quarterly and annual filing. Over time, this heatmap reveals behavioral patterns: does the market tend to underreact to strong quarters? Are post-filing dips typically buying opportunities? For Apple, the historical data shows that 10-Q filings with double-digit revenue growth have consistently been followed by positive 12-month returns — the kind of pattern you can't see from a single filing but becomes obvious when you track every filing systematically.
Finding More Companies Worth the Deep Read
Once you can read an Apple 10-Q in 30 minutes, the skill transfers to any company. But you need a way to find which companies are worth the time.
GeminIQ's Stock Screener lets you filter across 100+ financial metrics — all derived from XBRL-tagged SEC data — with up to 10 stackable conditions using precise logic (less than, greater than, between). Screen for companies with accelerating revenue growth, expanding gross margins, and strong free cash flow yield to surface the next quarterly filing worth reading. Every screener result links to auditable source data, so when you pull up the 10-Q, the numbers match.
Stop Reading PDFs. Start Analyzing Quarters.
A 10-Q shouldn't take an hour to read. The bottleneck isn't comprehension — it's extraction. Copying numbers from a PDF into a spreadsheet, building quarter-over-quarter comparisons manually, and cross-referencing insider activity across multiple sources is where the time disappears.
GeminIQ automates the extraction, structures every quarterly filing with XBRL traceability, calculates the metrics, and tracks the behavioral signals — so your 30 minutes are spent analyzing, not transcribing.
Most financial websites rely on third-party aggregators that simplify or process data before you ever see it. We built GeminIQ because we believe you deserve a better fundamental analysis tool—one that goes beyond basic price charts and processed numbers. We extract our data directly from SEC 10-K and 10-Q filings to ensure that when you look at a balance sheet or a cash flow statement, you are seeing the numbers exactly how the company reported them. Our goal is to give you the tools to verify the narrative for yourself using clean, traceable data. Start researching now at GeminIQ.
Disclaimer: The content in this blog is for educational and entertainment purposes only and does not constitute financial, legal, or tax advice. Investing involves risk, including the loss of principal. The views expressed are my own and not intended as financial advice or a guarantee of future performance.