How to Find Hidden Information in SEC Filings (2026)
2026-04-30
When Apple reports $416.2 billion in revenue and $112.0 billion in net income, every financial website on the internet publishes those numbers within minutes. They're not hidden. They're not hard to find. And they're not where the analytical edge lives.
The edge lives in the details that the headline numbers obscure — the balance sheet changes that signal where cash is actually going, the cash flow adjustments that reveal how much of "earnings" is actually cash, the insider transaction patterns that span a decade, and the behavioral data that shows how the market historically reacts to each filing.
This information is all public. It's all in the SEC filings. But it takes effort to extract — which is why most investors never see it.
In this guide, we'll walk through five types of hidden information using Apple's actual SEC data, and show how GeminIQ surfaces them automatically.
Or explore Apple's data now — no account needed →
Follow along, open Apple's 10-K here →
1. Balance Sheet Changes That Tell the Real Story
The income statement tells you how a company performed during a period. The balance sheet tells you what changed underneath — and it often reveals more.
Most investors check revenue, earnings, and margins. Far fewer compare the balance sheet line by line against the prior year. But the shifts between FY2024 and FY2025 on Apple's balance sheet tell a story that the income statement alone can't:
Current Marketable Securities dropped 47% — from $35.2 billion to $18.8 billion. That's $16.4 billion in liquid securities that Apple either sold, let mature, or moved. A headline reader sees "cash went up." A balance sheet reader asks: why did Apple shift its investment portfolio so dramatically?
Inventories fell 22% — from $7.3 billion to $5.7 billion. For a hardware company, declining inventory heading into the holiday quarter can mean two things: either supply chain efficiency improved, or the company is drawing down stock ahead of a product transition. The 10-K's Item 7 (MD&A) tells you Apple announced iPhone 17 and Apple Watch Series 11 in the fourth quarter — context that explains the inventory drawdown as a transition effect.
Accounts Receivable jumped 19% — from $33.4 billion to $39.8 billion, while revenue grew only 6.4%. When receivables grow faster than revenue, it can mean the company is extending more credit, customers are paying slower, or the revenue mix shifted toward higher-receivable channels. This is the kind of divergence that signals potential cash collection risk — and it only shows up if you read the balance sheet.
Other Current Liabilities dropped 15% — from $78.3 billion to $66.4 billion. That's an $11.9 billion decrease. What drove it? The 10-K notes reveal that Income Taxes Payable fell from $26.6 billion to $13.0 billion — a $13.6 billion drop largely driven by the settlement of the European Commission State Aid obligation that Apple paid out of escrow in FY2025. Without reading the balance sheet and the notes together, you'd miss this entirely.
Shareholders' equity grew 30% — from $57.0 billion to $73.7 billion. Apple's accumulated deficit shrank from $(19.2B) to $(14.3B). For a company that has been running an accumulated deficit for years due to massive buybacks exceeding retained earnings, this reversal is notable — net income of $112.0 billion finally exceeded the combined drain from buybacks and dividends, rebuilding the equity base. And by Q1 FY2026, the accumulated deficit has already shrunk further to just $(2.2B), putting Apple on track to eliminate it entirely.
Every one of these data points is in the 10-K. None of them are in the earnings headline.
GeminIQ Tip: GeminIQ extracts every balance sheet line item from every quarterly and annual filing, tagged with its XBRL identifier, across 17+ years of history. You can build a Custom Table that tracks specific balance sheet items over time and spot these shifts visually — without manually comparing two PDFs side by side.
2. Cash Flow Adjustments That Reveal Earnings Quality
Net income is an accounting concept. Cash flow is what actually happened. The gap between them — visible only in the cash flow statement — is one of the most important signals in fundamental analysis.
Apple reported $112.0 billion in net income in FY2025. It generated $111.5 billion in operating cash flow. On the surface, they're nearly identical — which suggests high earnings quality. But the adjustments that bridge the gap are worth examining:
Share-based compensation: $12.9 billion. This is a real economic cost (it dilutes existing shareholders), but it's a non-cash expense that gets added back in the cash flow statement. Apple's SBC has grown from $10.8 billion in FY2023 to $12.9 billion in FY2025 — a 19% increase in two years. For earnings quality analysis, the question is: how much of Apple's "earnings" represents cash vs. stock-based promises to employees?
Depreciation and amortization: $11.7 billion. Another non-cash add-back. Compare this to capital expenditures of $12.7 billion: Apple is spending slightly more on new assets than it's depreciating on existing ones, which means the asset base is growing — consistent with the company's expansion into data centers and manufacturing infrastructure.
Other current and non-current liabilities: $(11.1 billion). This is cash that went out the door to reduce liabilities — primarily the State Aid tax payment mentioned earlier. This line item turned operating cash flow from what would have been $122.6 billion into the reported $111.5 billion. A one-time drag.
Other current and non-current assets: $(9.2 billion). Cash absorbed by growing non-current assets — likely related to long-term supply agreements and prepayments. This is Apple locking in future component supply, visible only in the cash flow adjustments.
The point: Apple's earnings quality is genuinely high, but the cash flow statement reveals over $24 billion in non-cash adjustments (SBC + D&A) and nearly $20 billion in working capital movements that tell you where the cash actually went. These details are invisible if you only look at net income.
GeminIQ Tip: GeminIQ's Calculated Metrics include free cash flow, free cash flow per share, operating cash flow margin, and payout ratio — all computed directly from the XBRL-tagged cash flow statement. For Apple FY2025: free cash flow of $98.8 billion, FCF per share of $6.61, and a payout ratio of 13.8%. But the real capital return story is bigger: Apple returned $106.1 billion to shareholders through buybacks ($90.7B) and dividends ($15.4B) — approximately 95% of net income — while still generating enough cash to fund operations, invest in infrastructure, and reduce debt.
3. The Insider Transaction Pattern Nobody Talks About
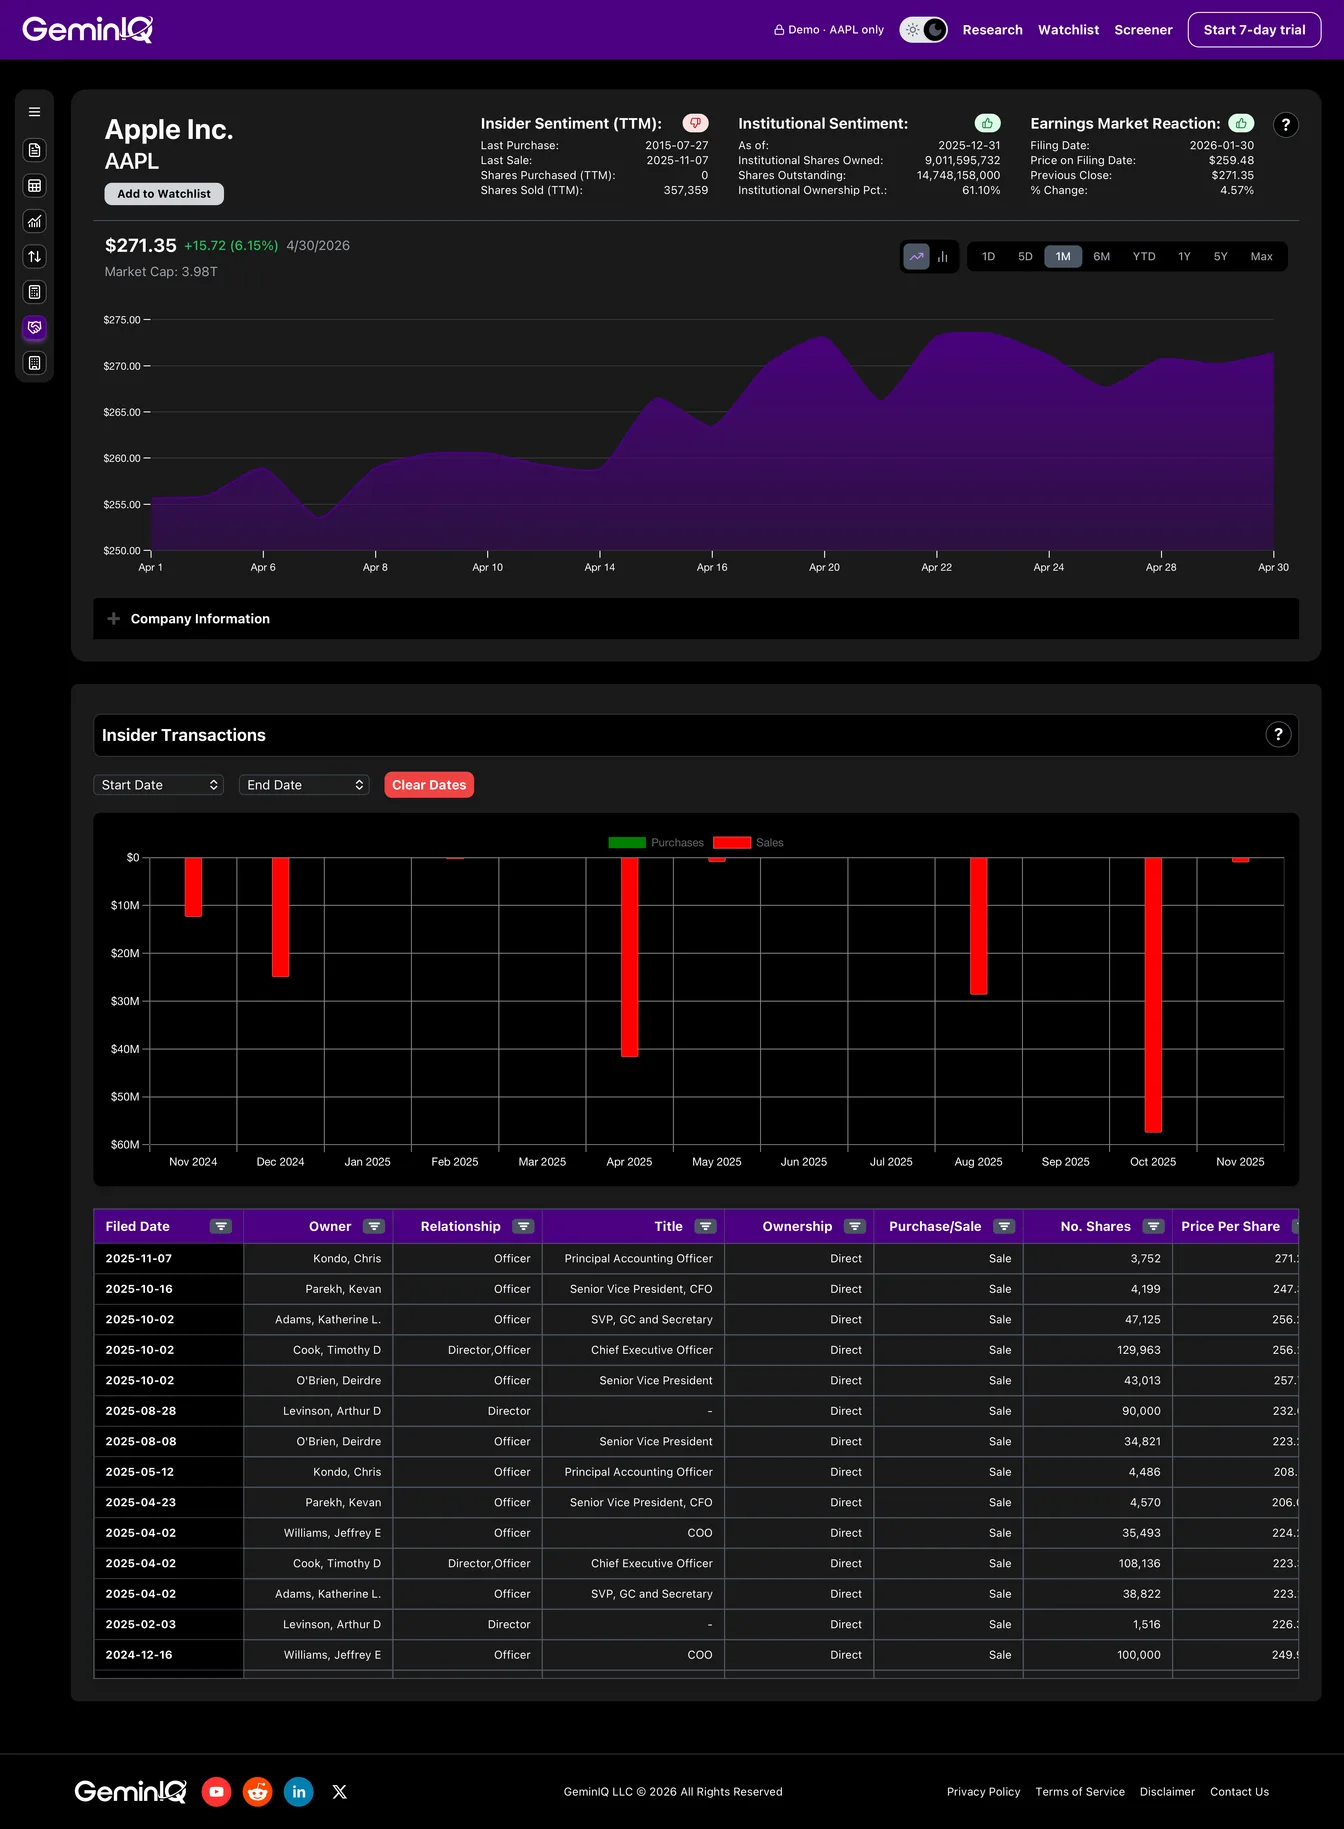
SEC Form 4 filings track every purchase and sale of company stock by executives, directors, and major shareholders. Most investors check whether insiders are "buying or selling." But the real insight comes from looking at the pattern across years — not individual transactions.
GeminIQ's insider transaction data for Apple spans from 2008 to present and reveals a striking pattern: across 428 total transactions, there have been only 4 open-market purchases — ever.
All four purchases were by board members, not executives: Robert Iger bought 2,670 shares in November 2011 at $374.91 and 1,780 shares in November 2012 at $563.63. Susan Wagner bought 3,800 shares across two transactions in July 2015 at approximately $123 per share.
That's it. No Apple executive — not Tim Cook, not any SVP, not any CFO — has ever bought Apple stock on the open market in the entire dataset. The remaining 424 transactions are all sales, overwhelmingly driven by RSU vesting and the tax withholding that follows.
What does this tell you? Two things. First, Apple compensates its executives so heavily in equity that they never need to buy — the RSU pipeline is their primary acquisition mechanism. Second, a pattern of zero executive purchases means that if an executive ever did buy on the open market, it would be an extremely strong signal — precisely because it has never happened before. The absence of signal is itself informative.
4. Post-Filing Price Reactions Over 16 Years
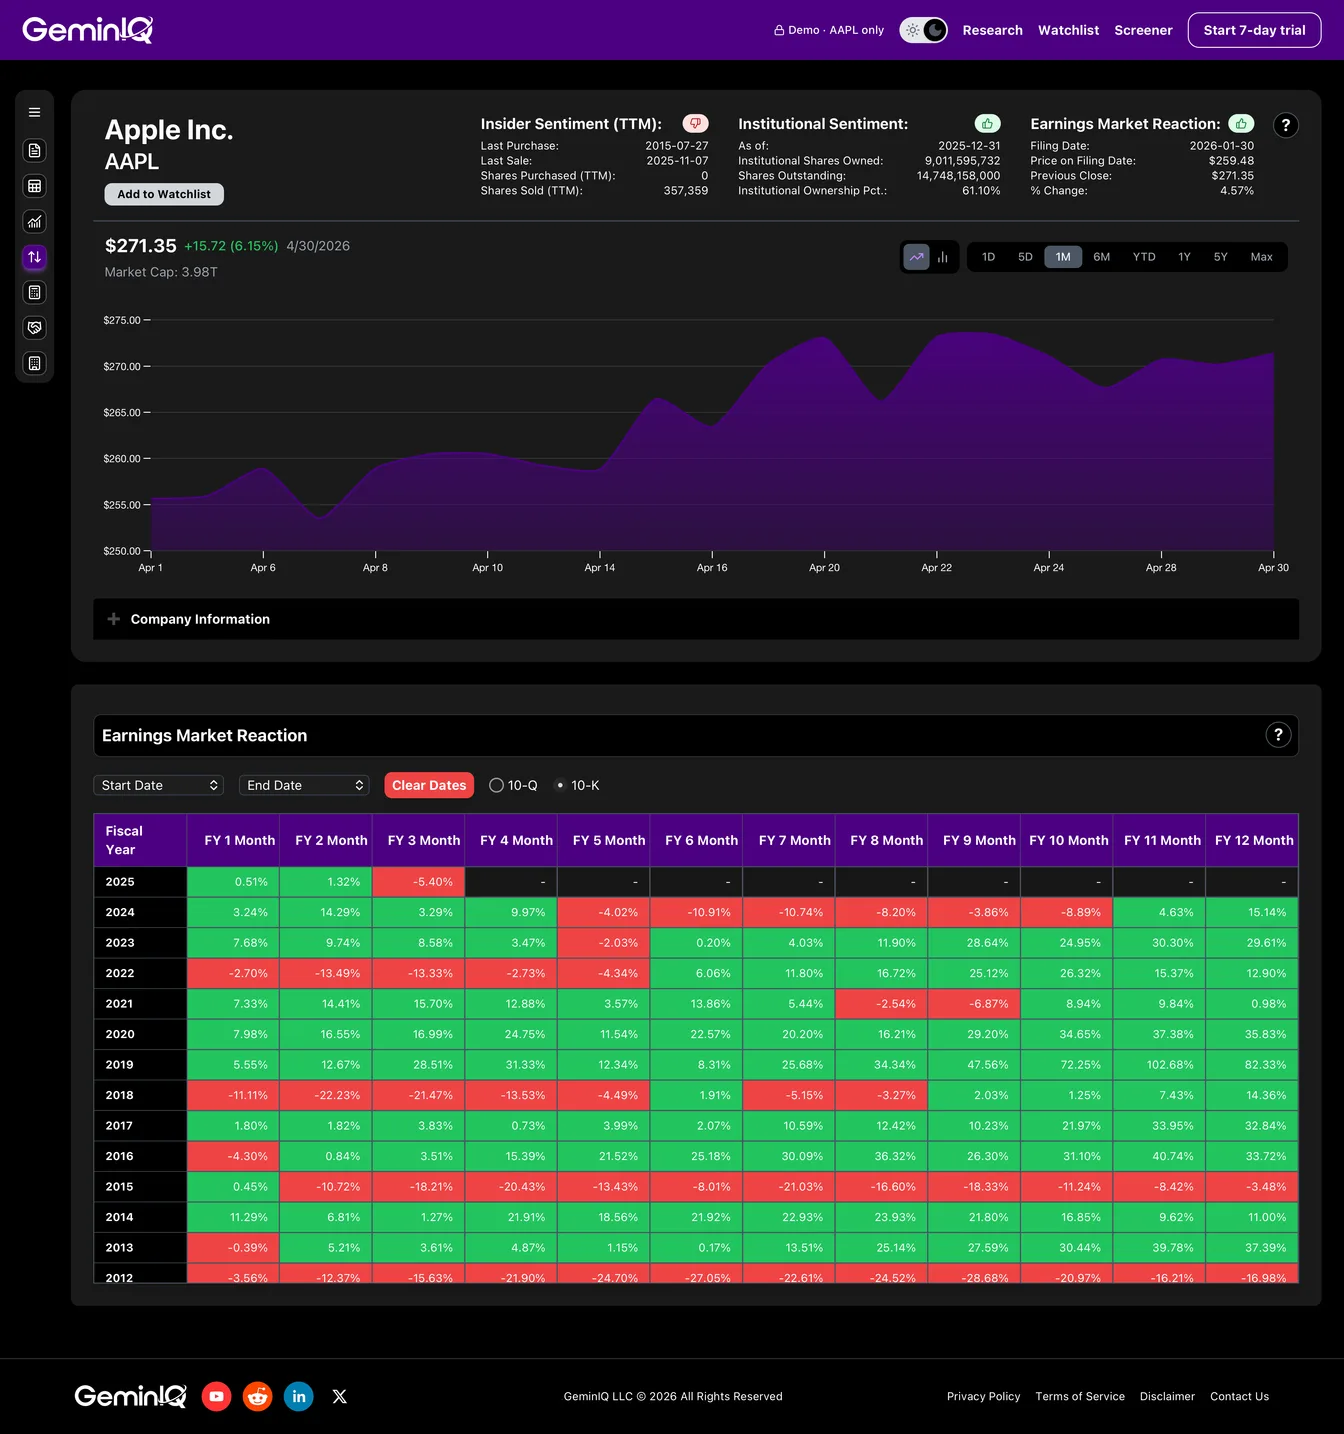
Here's a question most financial platforms can't answer: after Apple files its annual 10-K, what does the stock typically do over the next 12 months?
GeminIQ's Earnings Market Reaction Heatmap tracks the stock's performance 1 to 12 months after every filing. For Apple's 16 annual 10-K filings from 2009 to 2024, the data reveals a clear pattern:
14 out of 16 filings (88%) were followed by positive 12-month returns. The median 12-month post-filing return is approximately 30%.
The worst 12-month return was -17.0% — following the FY2012 10-K (filed October 2012), which preceded Apple's first major revenue deceleration after the iPhone 5 cycle.
Post-filing dips have historically been buying opportunities. The FY2018 10-K saw Apple drop 11.1% in the first month and 21.5% by month three (the late-2018 selloff). But by month 12, the stock was up 14.4%. The FY2016 10-K showed a 4.3% drop in month one, then returned 33.7% over 12 months. The FY2015 10-K dropped 18.2% by month three, but the 12-month return was only -3.5% — nearly a full recovery.
The strongest 12-month returns followed years of negative sentiment. FY2019's 10-K (filed October 2019, amid trade war fears) was followed by an 82.3% return over 12 months. FY2009's 10-K was followed by a 48.1% gain.
This pattern — short-term post-filing weakness followed by 12-month recovery — is the kind of behavioral data that only becomes visible when you track every filing systematically over a decade and a half. No single 10-K tells you this. The aggregate filing history does.
Explore Apple's full Earnings Market Reaction Heatmap on GeminIQ →
5. Institutional Ownership Trends That Confirm (or Contradict) Your Thesis
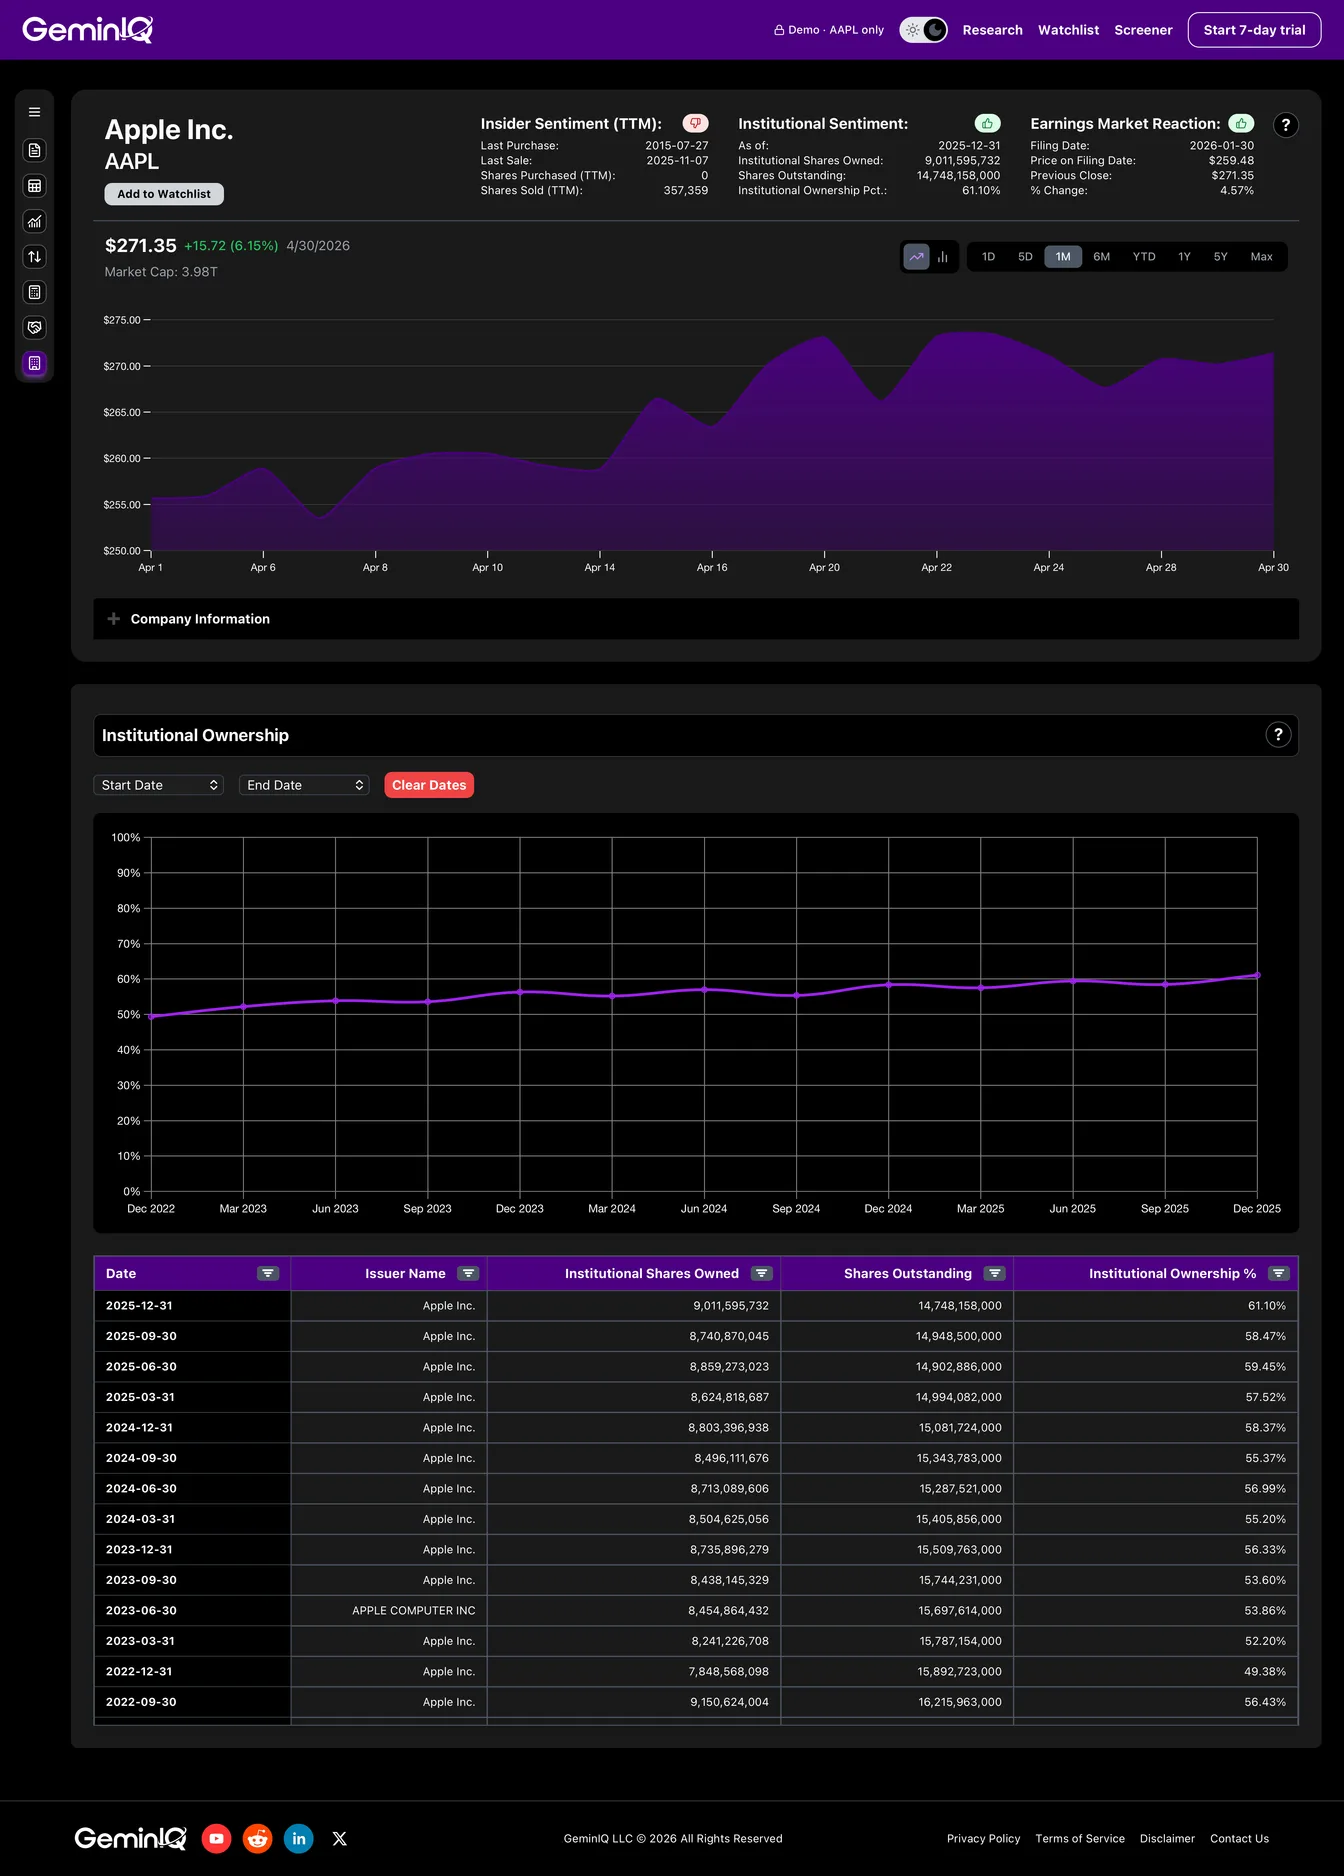
Individual investor sentiment is noisy. Institutional ownership — tracked through 13F filings — shows what professional capital is actually doing with its money, quarter by quarter.
GeminIQ's Institutional Ownership data for Apple reveals a decade-long accumulation trend. From 55.7% of outstanding shares held by institutions in FY2014, ownership has fluctuated in a band between roughly 50% and 60%. As of September 2025, institutional investors held 58.5% of Apple's shares — and the most recent data point (December 2025) shows that figure rising to 61.1%, the highest level in the dataset.
But the noise within the trend is where the insight lives.
Q4 2022: institutional ownership dropped to 49.4% — the lowest point since 2015. This coincided with the tech selloff and rising interest rates. Within 12 months, institutional ownership rebounded to 53.6%. Apple's stock rose 12.9% in the 12 months following the FY2022 10-K filing, then 29.6% in the 12 months after the FY2023 10-K — a clear recovery trajectory.
The share count is shrinking while institutional ownership percentage holds steady. Apple's split-adjusted outstanding shares have declined from roughly 23 billion in FY2014 to 14.8 billion in FY2025 — a 36% reduction from buybacks. Throughout that period, institutional ownership percentage has remained in a band between roughly 50% and 60%, even as the total float contracted dramatically. This means institutions have been trimming their absolute share counts roughly in proportion to buybacks, but not exiting — effectively maintaining their proportional stake while Apple shrinks the denominator.
This is the kind of structural insight that emerges from tracking ownership alongside buyback activity over time. It doesn't appear in any single quarterly filing, but the longitudinal pattern tells a clear story: professional capital isn't selling Apple — Apple is buying itself.
The Information Is Public. The Analysis Shouldn't Be Manual.
Every data point in this article came from public SEC filings. The balance sheet changes, the cash flow adjustments, the insider transactions, the post-filing price reactions, the institutional ownership trends — all of it is freely available on EDGAR.
The problem isn't access. It's extraction. Reading two 100-page PDFs side by side to spot balance sheet shifts. Downloading 428 Form 4 filings to count how many were purchases vs. sales. Manually tracking stock prices after each of 16 annual filings to build a reaction heatmap. Cross-referencing 13F data with outstanding share counts to understand institutional concentration.
That's what GeminIQ automates.
Every financial statement is extracted directly from EDGAR with its XBRL tags intact. Every calculated metric traces to its source inputs. The insider timeline, institutional ownership trends, and Earnings Market Reaction Heatmap are built from primary sources and updated automatically. The Stock Screener lets you filter across 100+ metrics with up to 10 stackable conditions — all running on data you can verify in the original filing.
The hidden information in SEC filings isn't hidden because it's secret. It's hidden because extracting it manually takes hours. GeminIQ makes it visible in seconds.
Most financial websites rely on third-party aggregators that simplify or process data before you ever see it. We built GeminIQ because we believe you deserve a better fundamental analysis tool—one that goes beyond basic price charts and processed numbers. We extract our data directly from SEC 10-K and 10-Q filings to ensure that when you look at a balance sheet or a cash flow statement, you are seeing the numbers exactly how the company reported them. Our goal is to give you the tools to verify the narrative for yourself using clean, traceable data. Start researching now at GeminIQ.
Disclaimer: The content in this blog is for educational and entertainment purposes only and does not constitute financial, legal, or tax advice. Investing involves risk, including the loss of principal. The views expressed are my own and not intended as financial advice or a guarantee of future performance.