Darling (DAR) Q3 2026 Earnings: EPS $1.67, DGD 81% of Operating Gain

By Chad Hartman
Published · Last updated
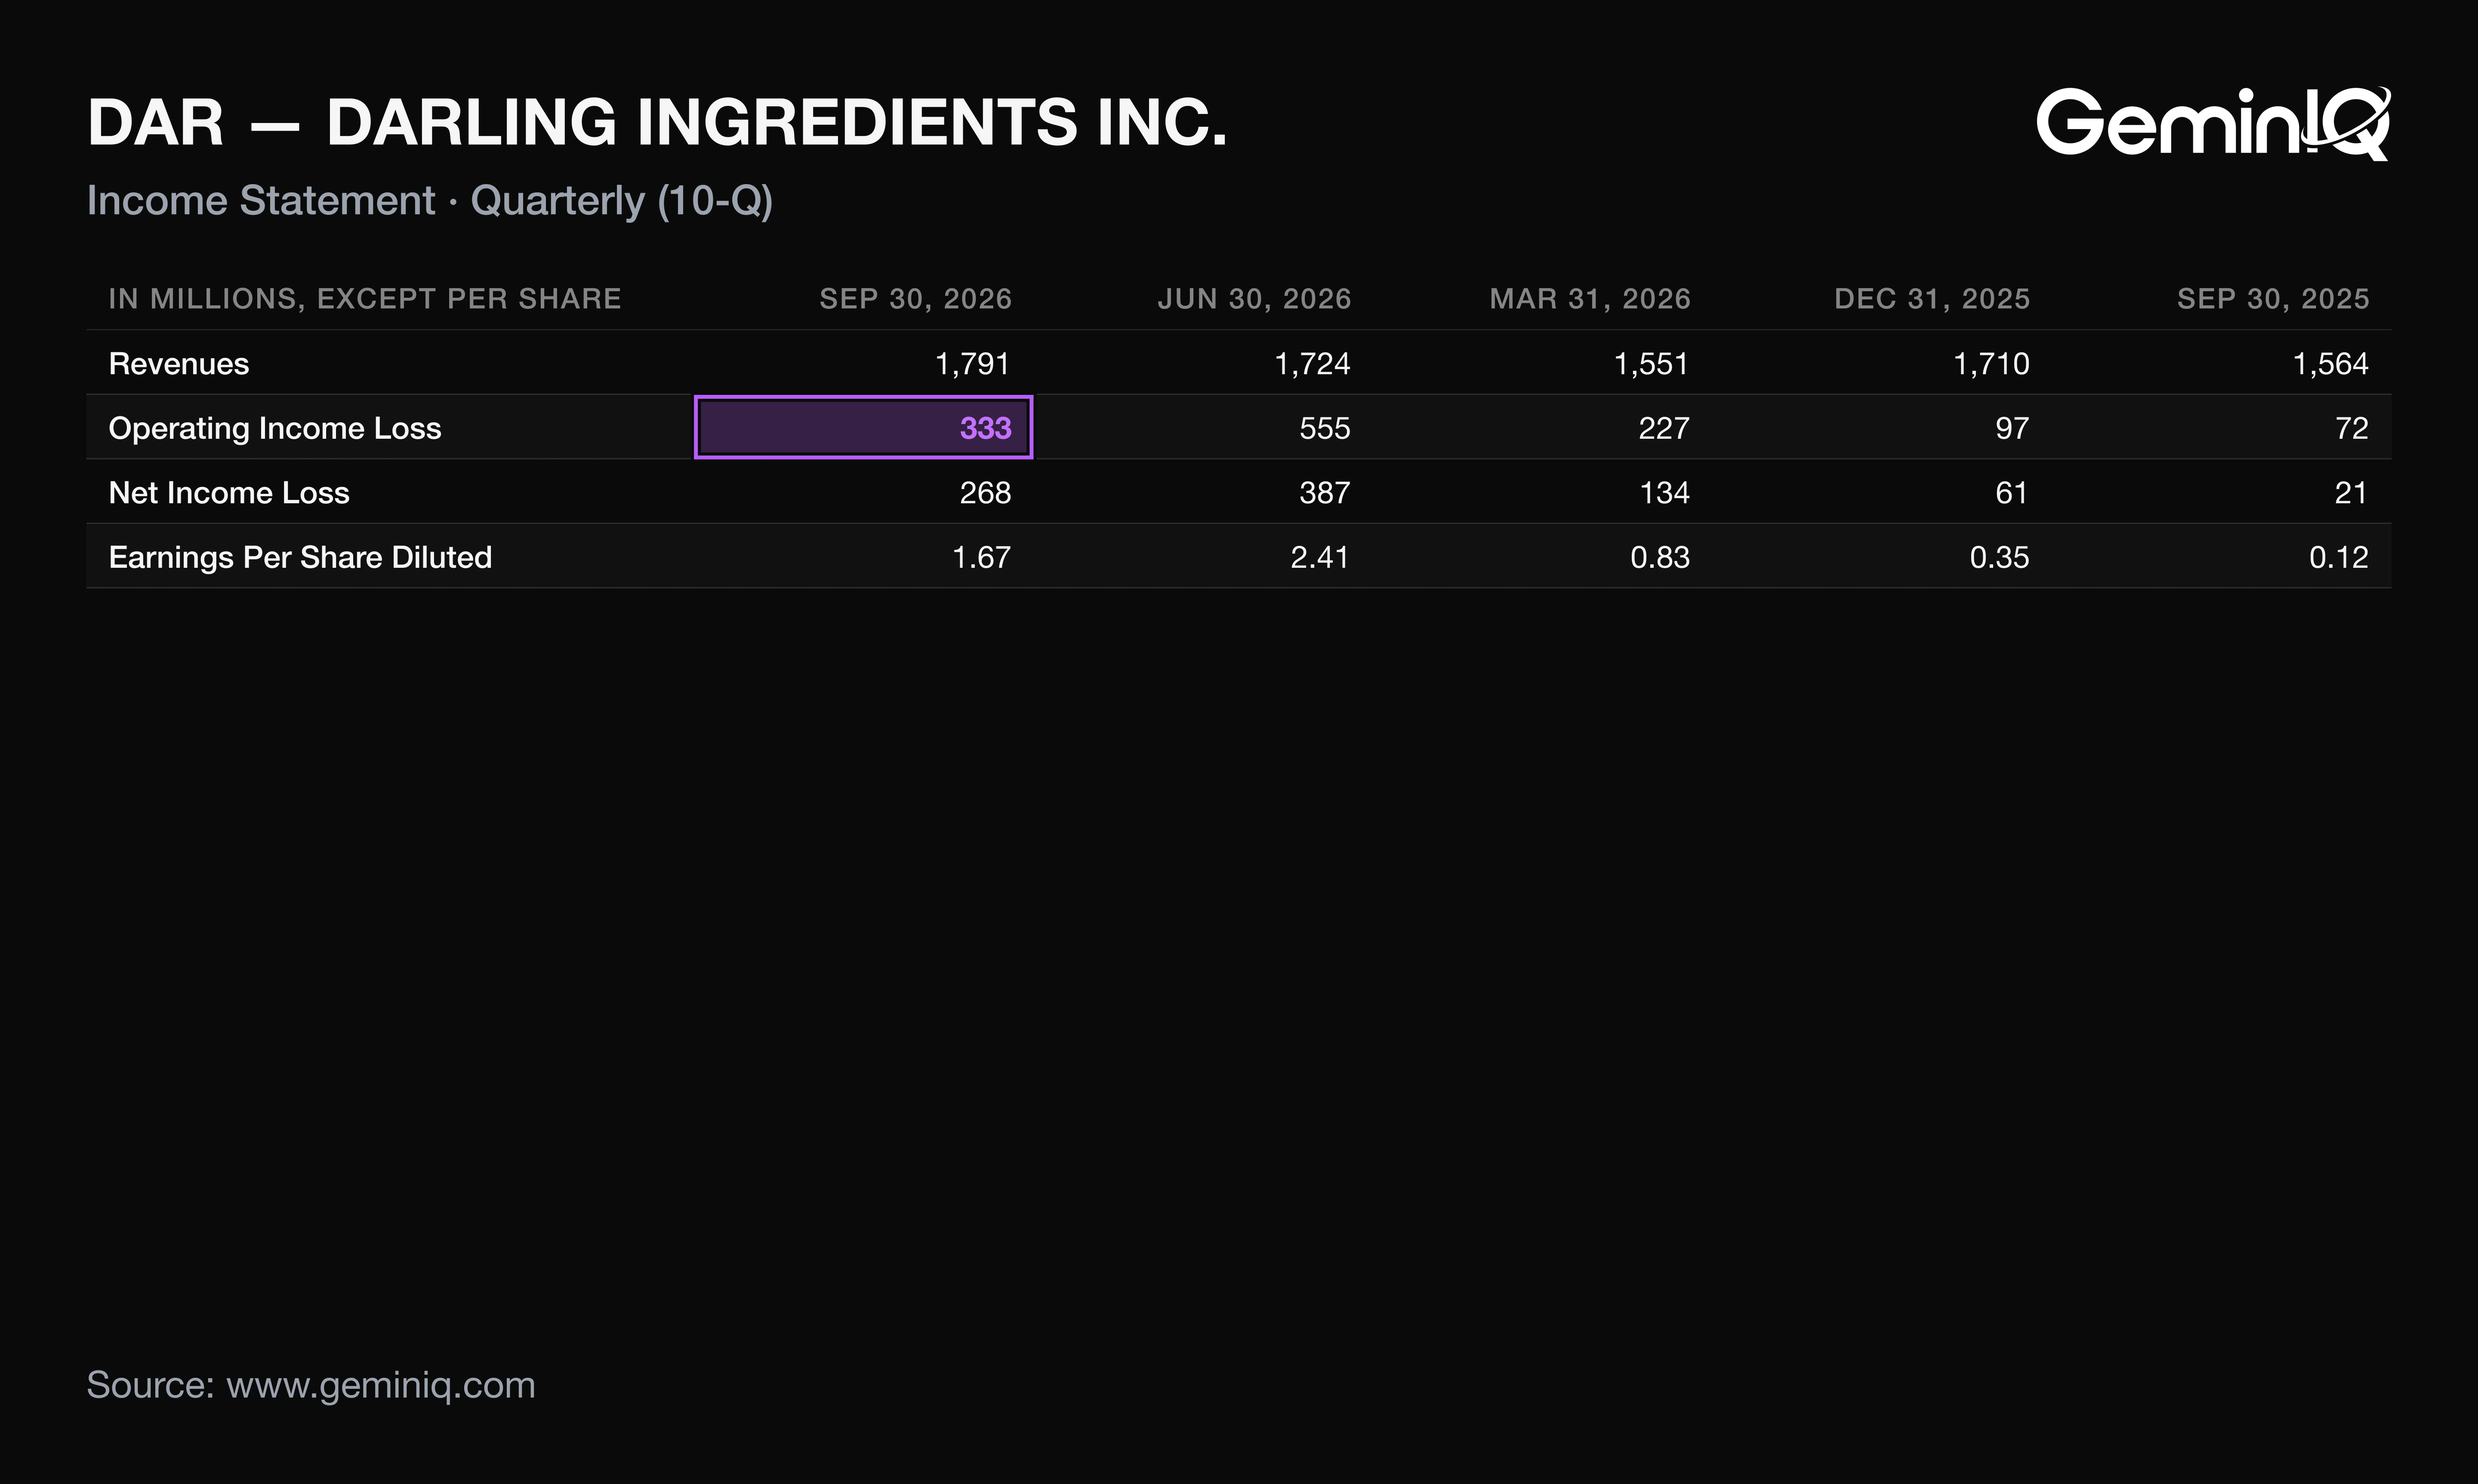
Darling Ingredients (NYSE: DAR) reported Q3 FY2026 revenue of $1.79 billion, up 14.5%, and diluted EPS of $1.67 against $0.12 a year earlier, for the quarter ended October 3, 2026 (released October 28; 10-Q filed November 10). Of the quarter's $333.3 million operating income, $165.6 million was equity income from the Diamond Green Diesel (DGD) joint venture, which lost $45.8 million a year earlier. That swing supplied 81% of the $261.5 million rise in operating income, and a $63.5 million gain on business sales sits below it in pretax income.
| Field | Value |
|---|---|
| Company | Darling Ingredients ($DAR) |
| Quarter | Q3 FY2026, period ended October 3, 2026 |
| Earnings release | October 28, 2026 (Form 8-K) |
| 10-Q filed | November 10, 2026 |
| Revenue | $1.79 Billion (+14.5% YoY) |
| Diluted EPS | $1.67 (+1291.7% YoY) |
| Operating margin | 18.6% (+14.0 pts YoY) |
| Operating cash flow (TTM) | $1.59 Billion |
| DGD share of operating income | 49.7% |
Darling Ingredients Q3 2026 Revenue, EPS and Margins
Darling's Q3 2026 revenue was $1.79 billion, up 14.5% from $1.56 billion, and diluted EPS was $1.67, up from $0.12. Revenue growth looks like a volume story; the 10-Q says it was mostly price.
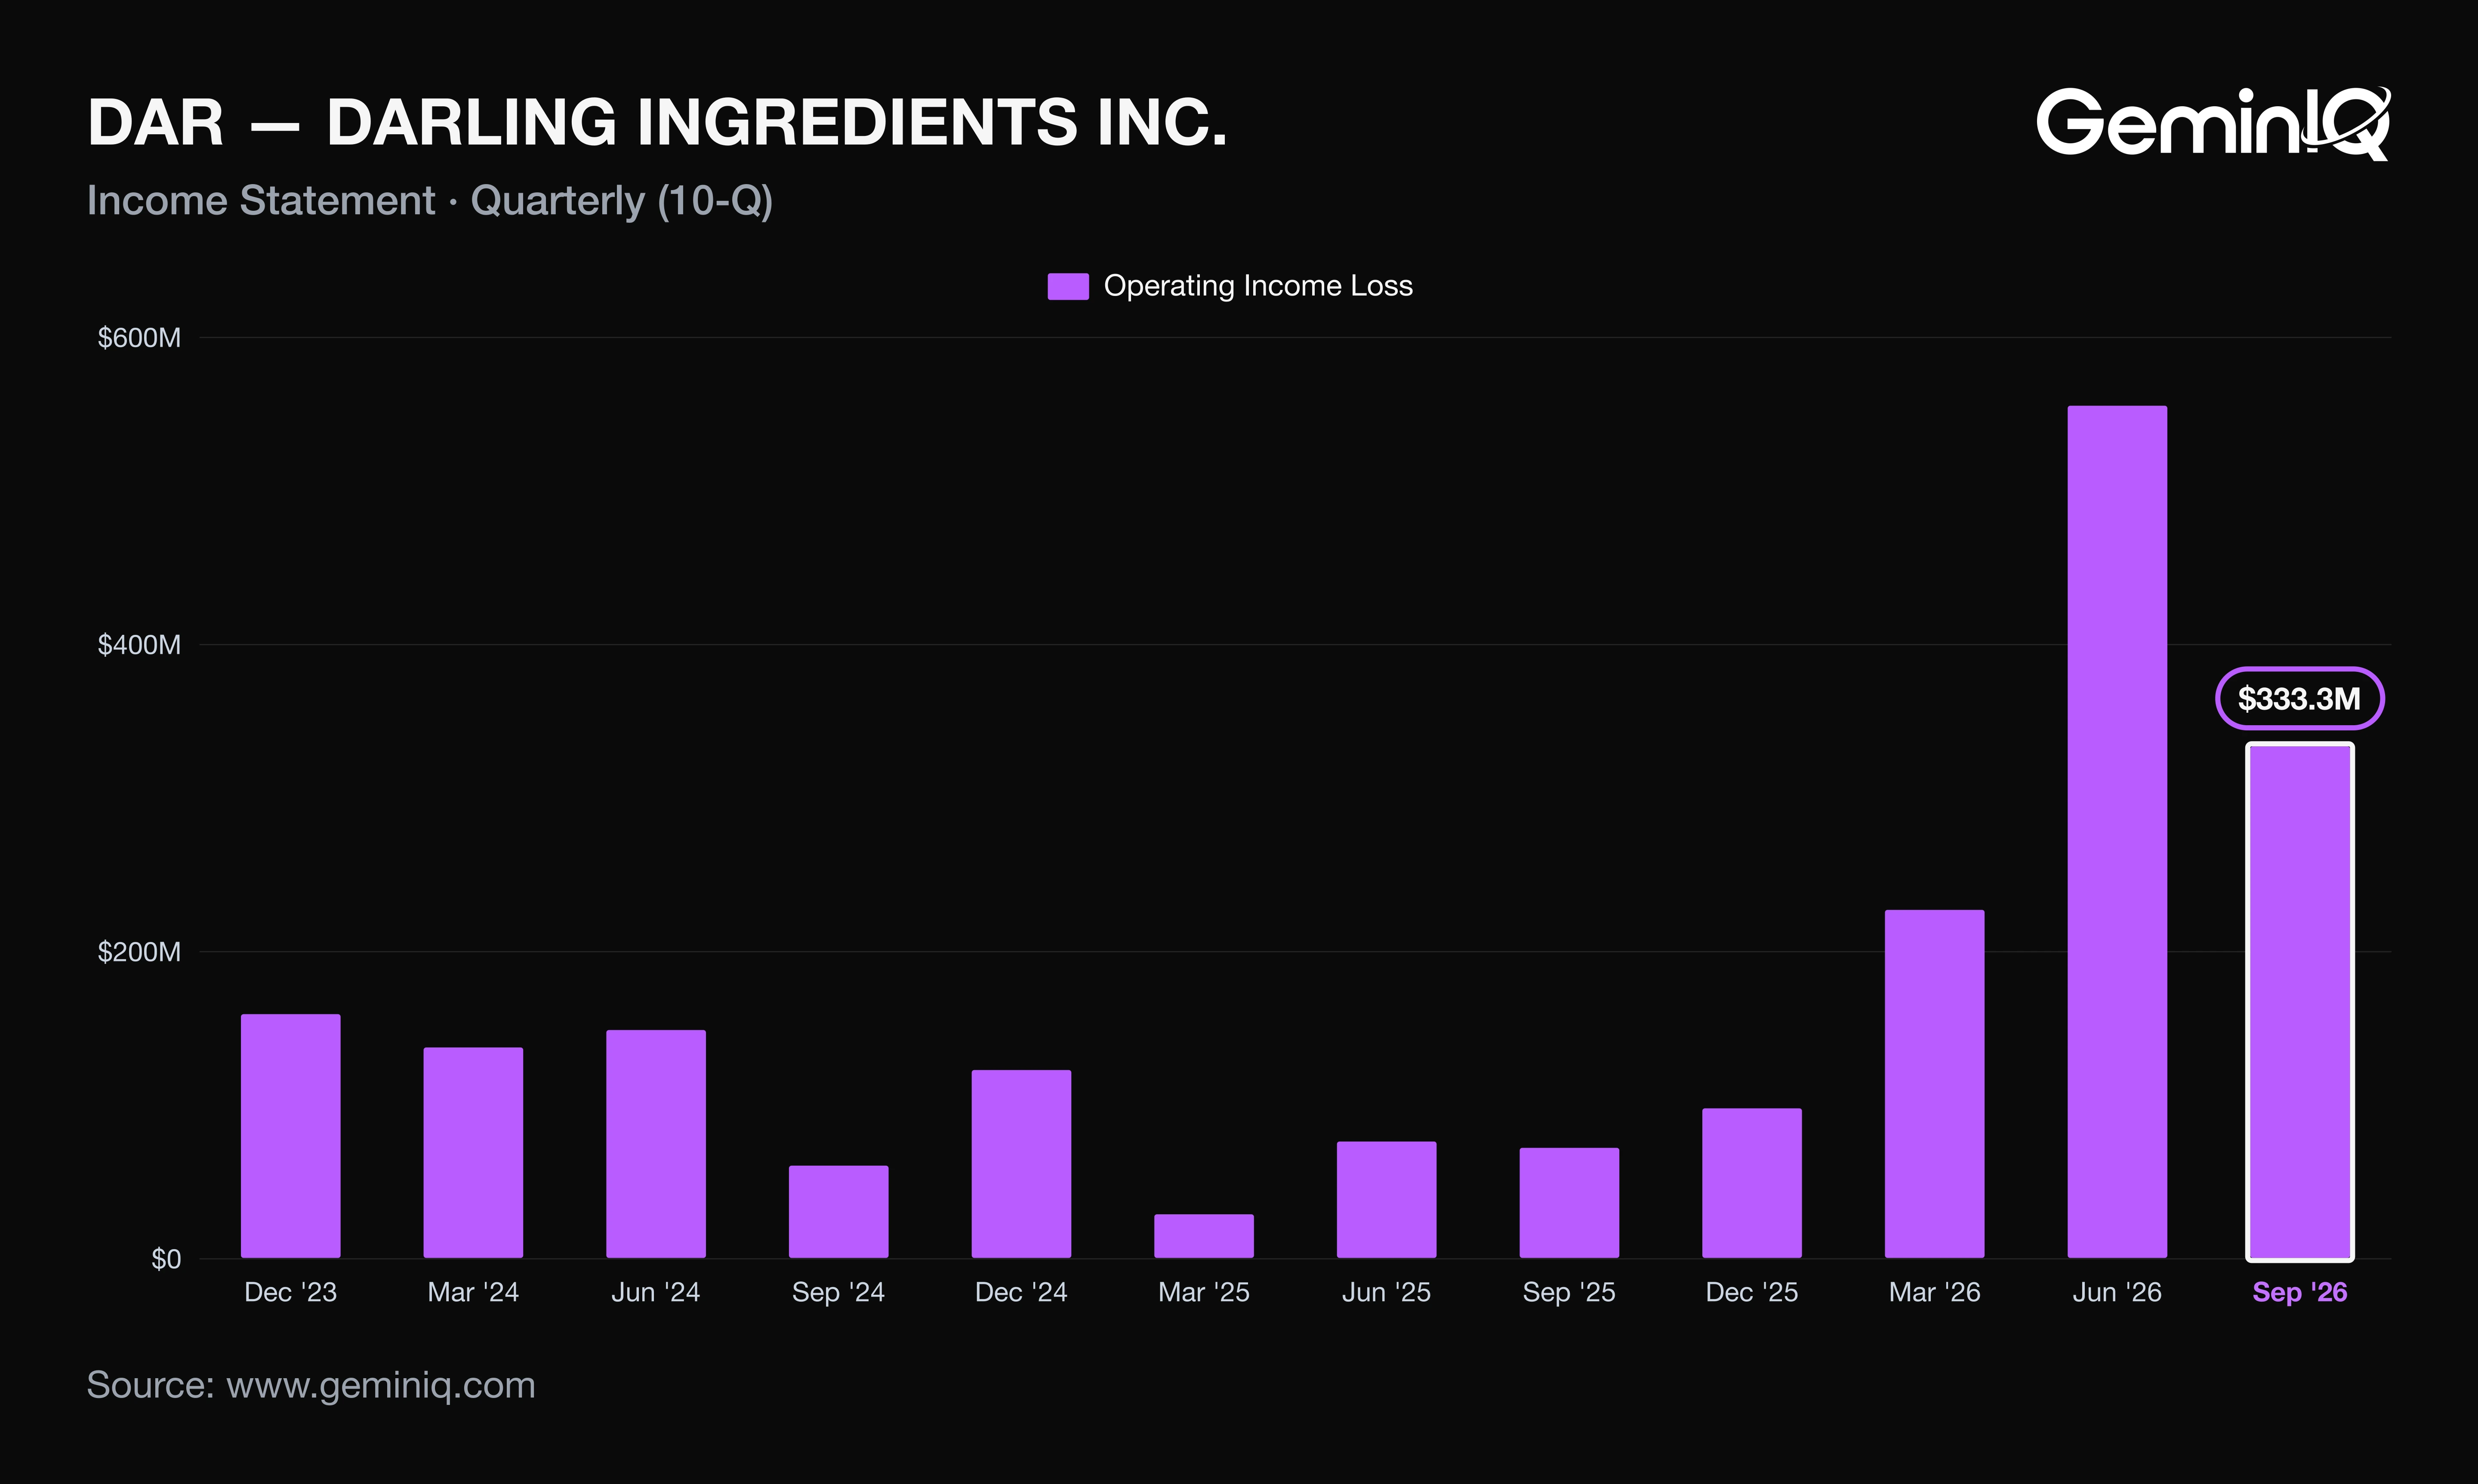
The Data: Feed Ingredients sales rose $177.6 million, of which finished-product prices contributed $154.5 million and volumes $36.8 million. Gross margin was 26.7%, up 1.9 points from a year earlier and the third highest of the last 16 quarters. Operating income of $333.3 million was the third highest of those 16 quarters, though it fell 40.0% from $555.2 million in Q2.
Why: Fat and protein prices rose, and the company attributes the 27.7% Feed gross margin to them. The larger driver sits below gross profit: equity income from DGD moved from a $45.8 million loss to a $165.6 million profit, a $211.5 million swing, 81% of the operating-income gain. Operating margin was 18.6% against 32.2% in Q2, which was itself lifted by DGD. Net income of $268.3 million was the second highest of the last 16 quarters, and diluted shares of 160.13 million were within 0.1% of a year ago, so EPS growth is earnings growth.
What Darling Ingredients' 10-Q Shows Beyond the Press Release
Darling's release led with Combined Adjusted EBITDA of $514.3 million, against $244.9 million a year ago, and the 10-Q shows how much of that figure is DGD. Darling's share of DGD Adjusted EBITDA was $204.2 million, 40% of the combined total, against a $2.9 million loss a year earlier. The release's non-GAAP figure and the GAAP operating line both lean on one partner's spread.
The Data: DGD's equity income was 49.7% of operating income. Pretax income of $345.1 million also contained the $63.5 million gain on the sale of the grease trap and natural casings businesses, 18% of the total. Removing both leaves pretax income of about $116.0 million, against about $64.0 million a year earlier (derived from the 10-Q's reported lines).
Why: Strip the joint venture and the gains out and the core business still grew, by roughly 81% on that derived basis, so the quarter is not hollow. The disclosure that changes the reading is the dependence: the Fuel segment's $210.8 million operating-income gain came, in the company's words, from higher volumes, higher Renewable Identification Number values after the EPA finalized 2026-27 volume obligations, and higher diesel prices. Corporate overhead also rose $12.9 million on incentive pay, so the partner is carrying more than the headline implies.
Darling Ingredients Q3 2026 Cash Flow, Buybacks and Debt
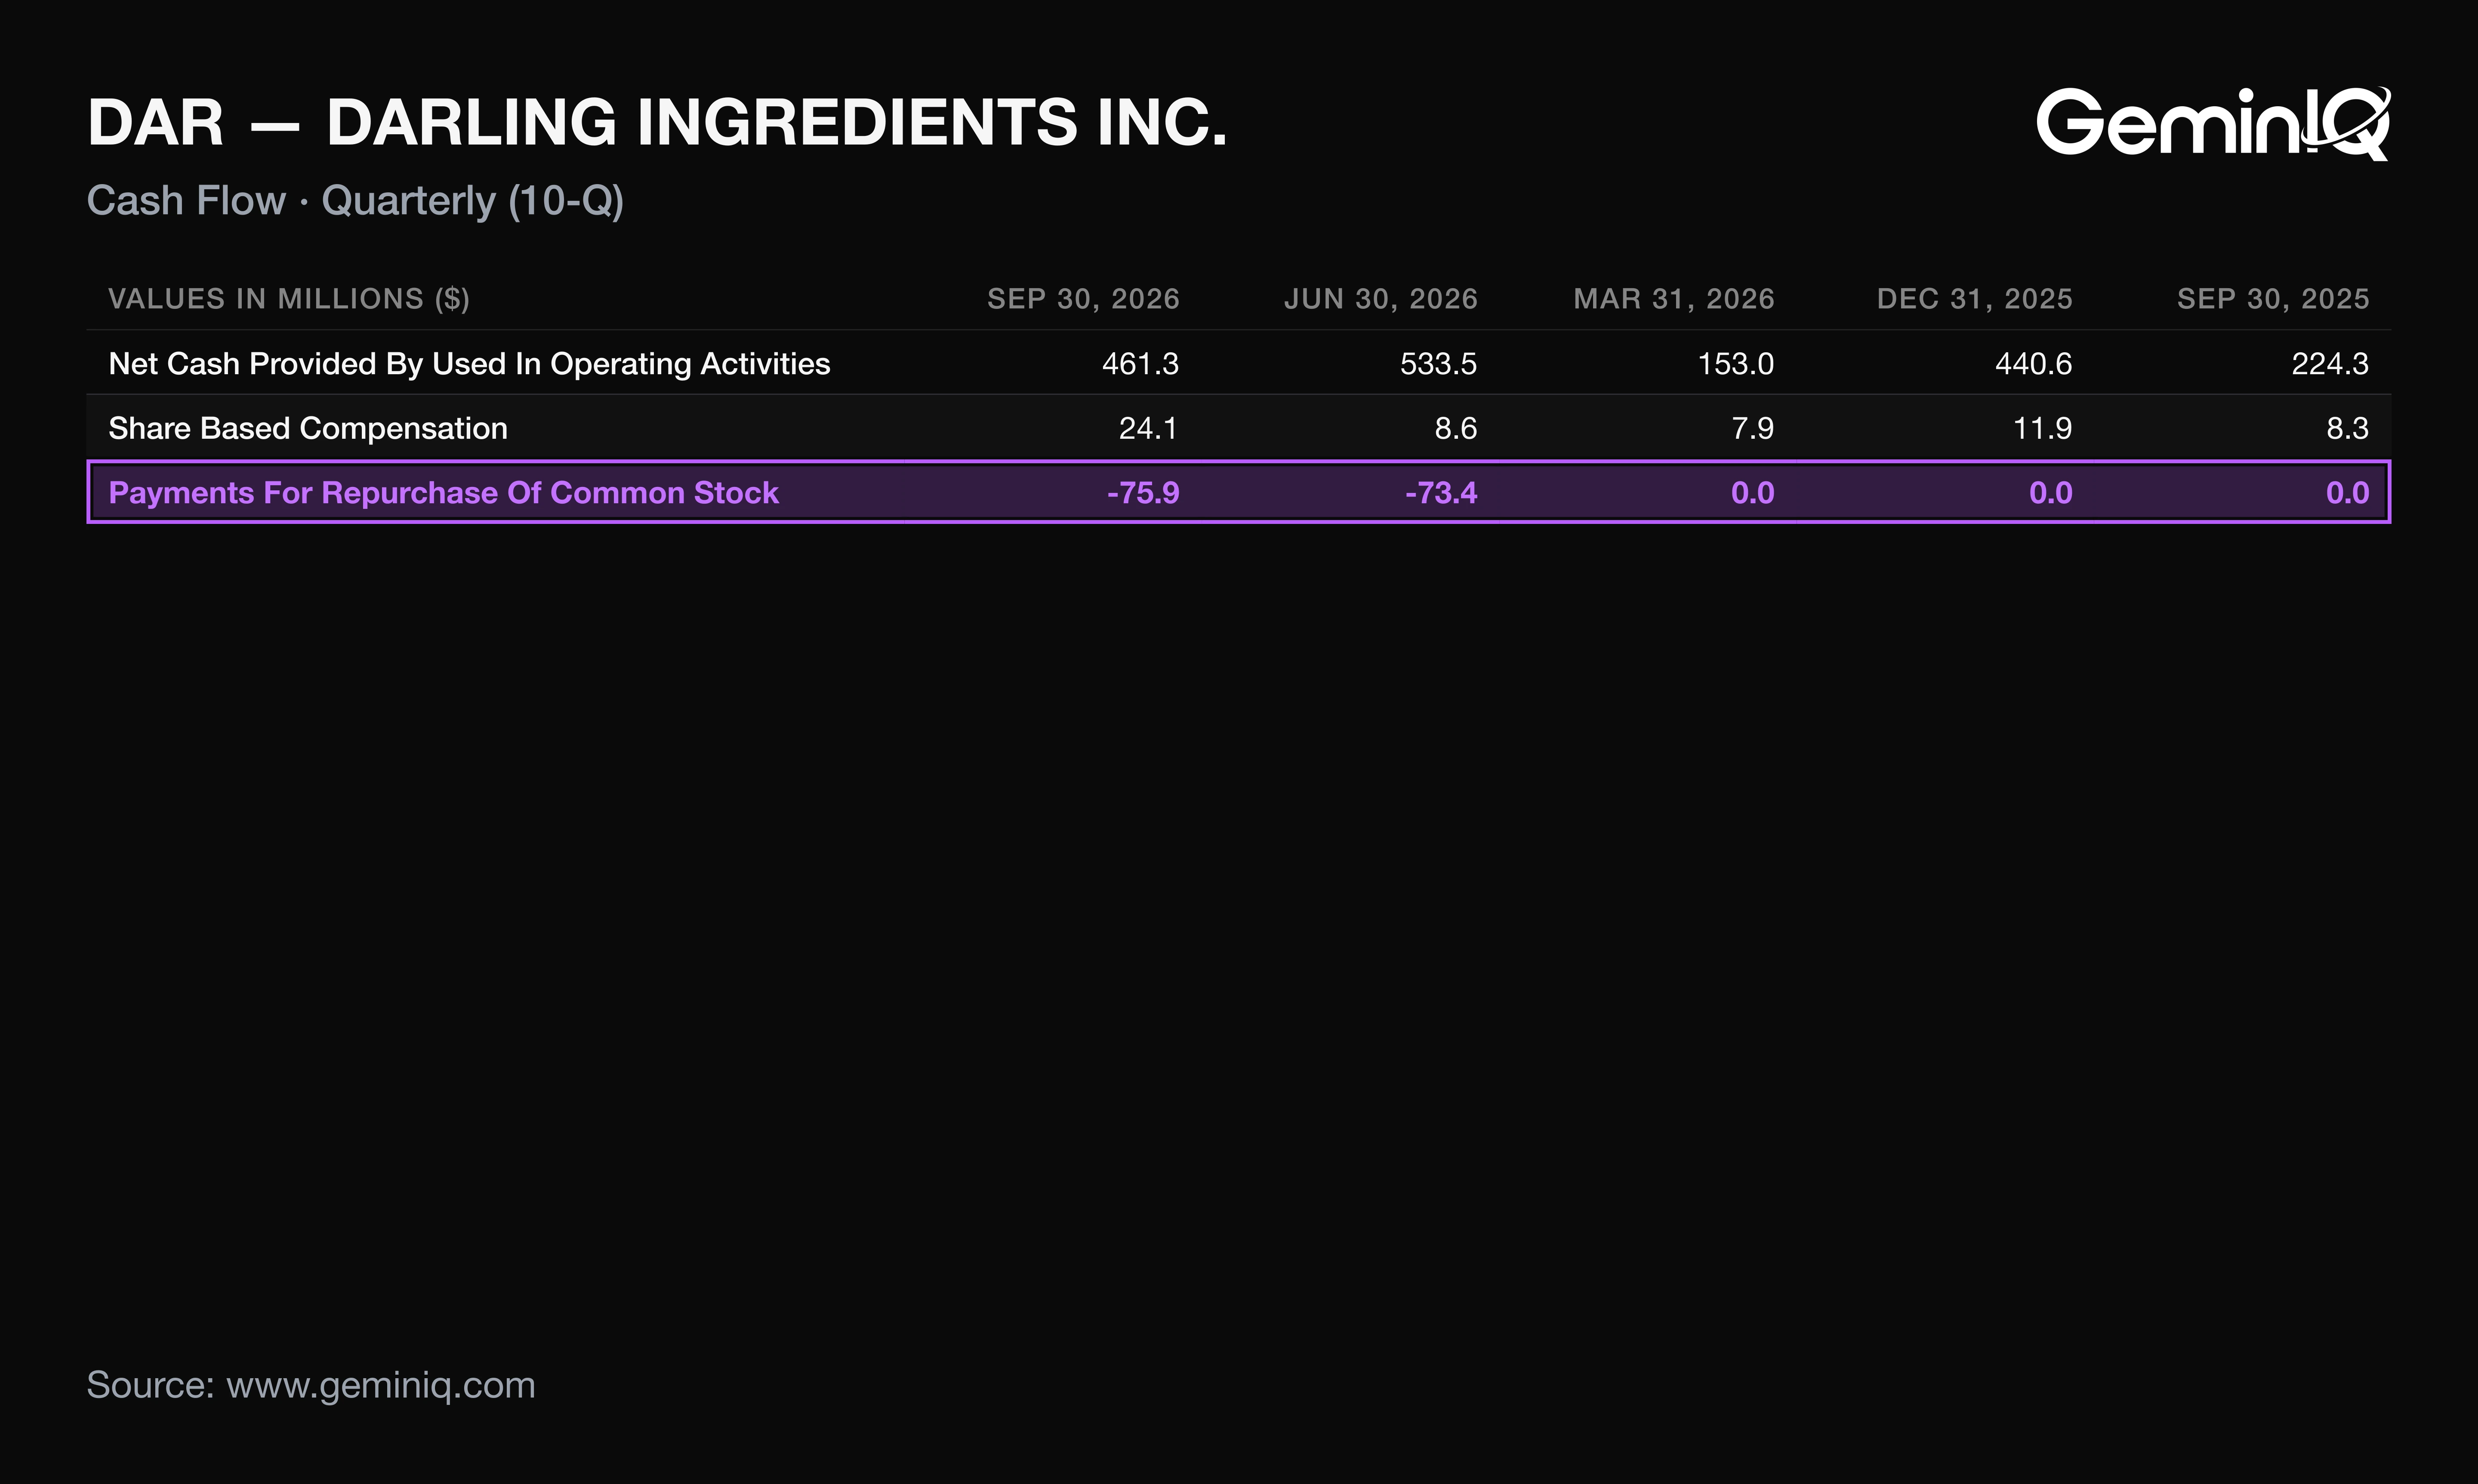
Darling's Q3 2026 operating cash flow was $461.3 million, up 105.6% from $224.3 million and the second highest of the last 16 quarters, though down 13.5% from Q2. The release credits DGD for much of it.
The Data: The release reports $171.0 million received from DGD, $33.4 million in dividends and $137.6 million from production tax credit sales, equal to 37% of operating cash flow (derived). The company repurchased $75.9 million of stock in the quarter and $149.4 million year to date. Yet diluted shares were 160.13 million, against 159.95 million a year earlier. The release says net debt fell about $420 million; GeminIQ's Net Debt to EBITDA was 1.87x against 4.90x a year ago.
Why: Buybacks absorbed share issuance rather than shrinking the count: $149.4 million spent, no net reduction over twelve months. Deleveraging is where the cash went. Dividends paid rose to $8.2 million, the highest of the last 16 quarters, but that is 1.8% of operating cash flow.
Darling Ingredients' 2026 Guidance After Q3
Darling reaffirmed fiscal 2026 Combined Adjusted EBITDA guidance of $2.2 billion to $2.3 billion in the 8-K. Nine-month Combined Adjusted EBITDA was $1.66 billion, so the guide implies a fourth quarter of $537 million to $637 million (derived).
The Data: Q3 Combined Adjusted EBITDA was $514.3 million. The low end of the range needs a Q4 4.4% above Q3; the top end needs 23.8% above. The company also anticipates net debt at or below $3.0 billion and leverage below 1.5x at year-end, against $3.37 billion of net debt and a preliminary 1.7x covenant ratio at October 3.
Why: A reaffirmation after a $514.3 million quarter is a statement that Q3 was not a peak, since even the range's floor sits above it. The debt target implies roughly $370 million more net debt reduction in one quarter (derived), close to Q3's $420 million pace. The company guided; whether DGD's spread holds is what decides it.
How DAR Stock Has Moved After Past Earnings Reports
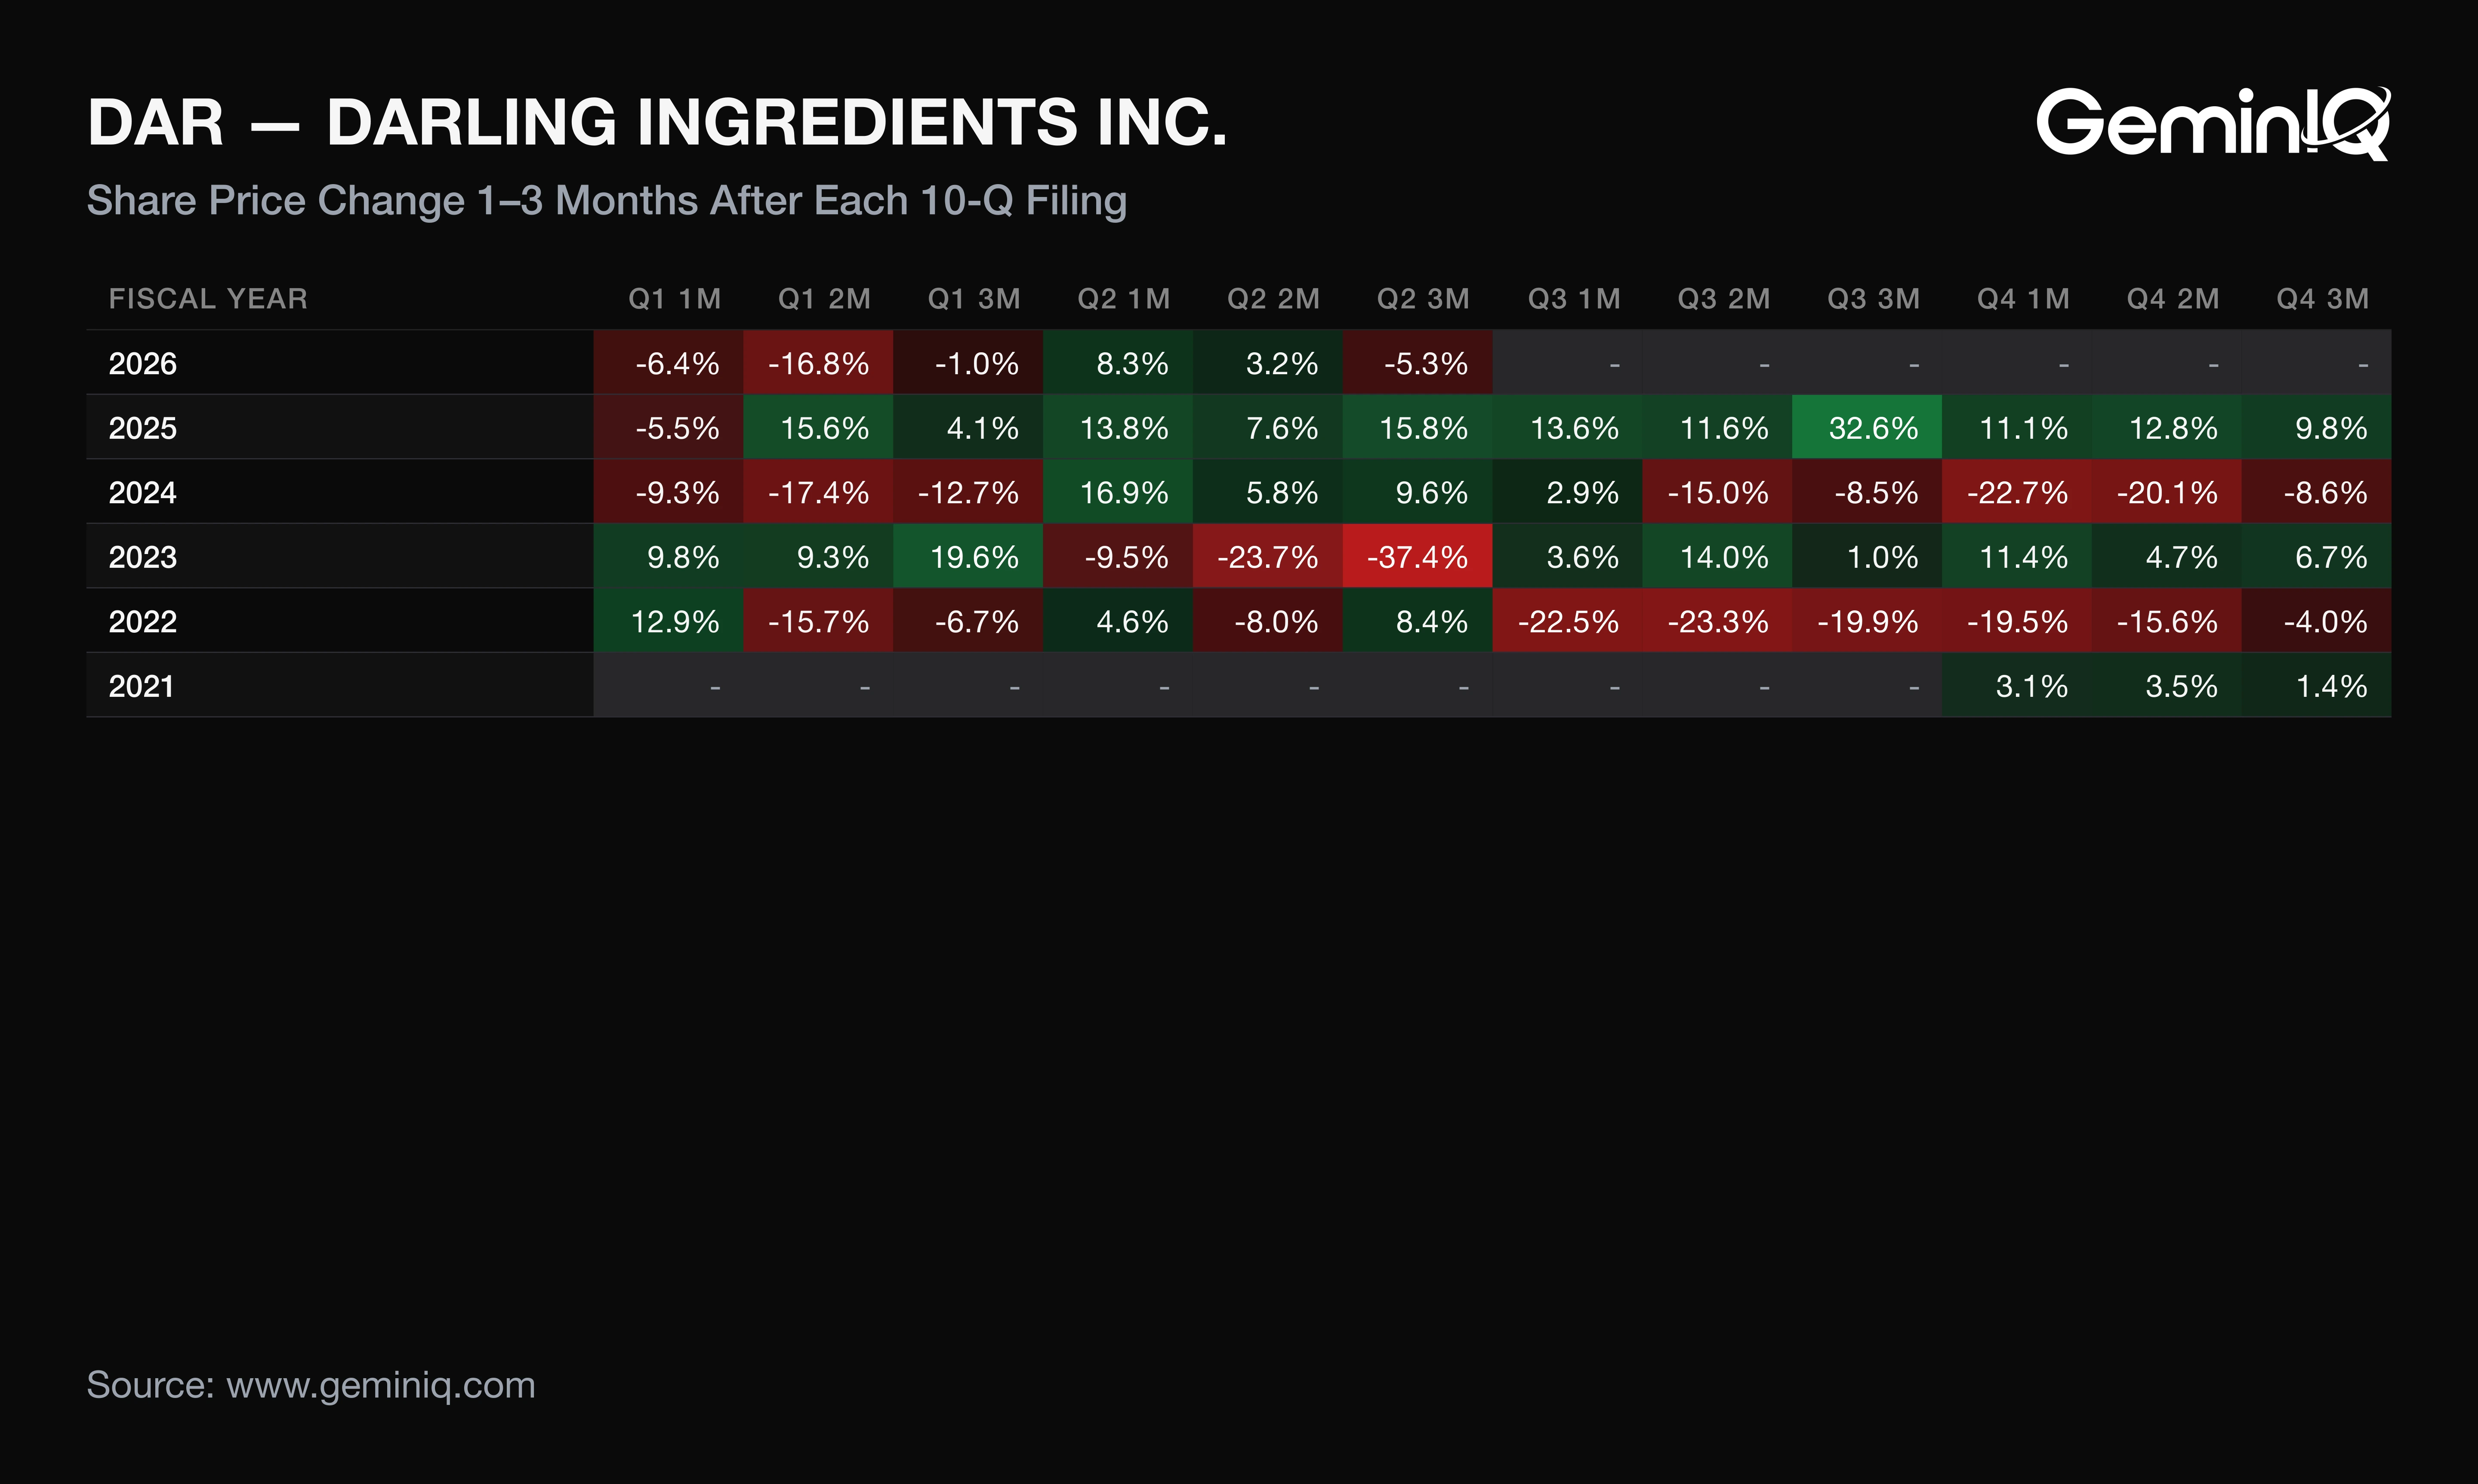
These figures describe how Darling's stock moved after its past filings; they are a historical association, not a forecast. Across the last 12 10-Q filings with a completed window (November 2023 to August 2026), the one-month return after filing had a median of +5.9% and was positive 8 times, ranging from -22.7% to +16.9%.
The Data: The three-month median was +2.5%, positive after 7 of 12, with a low of -12.7% and a high of +32.6%. The Q3 filing has no return yet because its window has not elapsed. The Earnings Reaction Heat Map below shows each filing.
Why: The spread is wide enough that a typical one-month move says little about any single filing. Insider activity adds little: in the 12 months of Form 4 filings through September 2, 2026, there were 13 sales totaling $5.3 million and one $61,000 purchase on July 31, against 7 sales totaling $5.7 million in the prior 12 months. Sales outnumber purchases, which is the normal pattern.
A quarter whose operating income rests on an equity-method partner is only as repeatable as that partner's margin.
Frequently Asked Questions
When does Darling Ingredients report earnings?
Darling Ingredients reported Q3 2026 results on October 28, 2026 and filed its 10-Q on November 10. Last year it filed its fourth-quarter results on March 3, 2026, which is a pattern from the filing record, not a forecast of the next date.
Does Darling Ingredients pay a dividend?
Darling paid $8.2 million of dividends in Q3 2026, up from $4.9 million a year earlier, and $10.8 million over the trailing twelve months, against $4.9 million a year before. The trailing figure is 0.7% of trailing operating cash flow of $1.59 billion.
Is Darling Ingredients doing well financially?
Darling's trailing net profit margin was 12.56%, against 1.86% a year ago. GeminIQ's Return on Invested Capital was 11.00%, against 3.41%, and the current ratio was 1.42x. Both gains lean on DGD, whose equity income was half of Q3 operating income.
How has DAR stock reacted to past Q3 reports?
One-month returns after the last three Q3 filings were +3.6% (FY2023), +2.9% (FY2024) and +13.6% (FY2025). Three-month returns were +1.0%, -8.5% and +32.6%. Three observations are a thin base, and this history is an association, not a forecast.
Wall Street's data. Main Street's price.
Institutional terminals charge thousands a year for as-filed accuracy. GeminIQ gives you the same thing for a fraction of the cost: financials built directly from raw SEC EDGAR filings, not third-party APIs, with full XBRL traceability back to the original 10-K or 10-Q. No normalized guesswork, just calculated metrics, charts, screeners, and watchlists built on numbers exactly as the company reported them. Start researching now at GeminIQ.com.
All financial figures cited in this article reference DARLING INGREDIENTS INC.'s Q3 2026 10-Q (filed November 10, 2026, period ending September 30, 2026), with guidance and management commentary drawn from the company's Form 8-K earnings release (filed October 28, 2026). All SEC filings are publicly available at SEC EDGAR and SEC EDGAR.
Disclaimer: The content in this blog is for educational and entertainment purposes only and does not constitute financial, legal, or tax advice. Investing involves risk, including the loss of principal. The views expressed are my own and not intended as financial advice or a guarantee of future performance.