
Choose Your Plan
All subscriptions include a 7-day free trial
Cancel anytime. Secure payment via Stripe.
- Every number traceable to its SEC source — no 3rd party APIs✓
- Historical financial data3 years
- Calculated financial metrics27
- Interactive financial statement visualizationsLimited
- Post-earnings price reaction analysisLimited
- Stock screener with 100+ stackable filtersLimited
- Insider transaction tracking from Form 4 filingsLimited
- Institutional ownership monitoringLimited
- Watchlists with price targets, thesis notes and alerts✕
- Comps — dedicated peer comparison workspace✕
- One-click Excel export of every dataset✕
- Stock price movement analysisLimited
- Next-day filing availability✓
- 7-day free full trial, no risk✕
- Discount compared to monthly-
- Every number traceable to its SEC source — no 3rd party APIs✓
- Historical financial data17+ years
- Calculated financial metrics90+
- Interactive financial statement visualizations✓
- Post-earnings price reaction analysis✓
- Stock screener with 100+ stackable filters✓
- Insider transaction tracking from Form 4 filings✓
- Institutional ownership monitoring✓
- Watchlists with price targets, thesis notes and alerts✓
- Comps — dedicated peer comparison workspace✓
- One-click Excel export of every dataset✓
- Stock price movement analysis✓
- Next-day filing availability✓
- 7-day free full trial, no risk✓
- Discount compared to monthly26% Discount
- Every number traceable to its SEC source — no 3rd party APIs✓
- Historical financial data17+ years
- Calculated financial metrics90+
- Interactive financial statement visualizations✓
- Post-earnings price reaction analysis✓
- Stock screener with 100+ stackable filters✓
- Insider transaction tracking from Form 4 filings✓
- Institutional ownership monitoring✓
- Watchlists with price targets, thesis notes and alerts✓
- Comps — dedicated peer comparison workspace✓
- One-click Excel export of every dataset✓
- Stock price movement analysis✓
- Next-day filing availability✓
- 7-day free full trial, no risk✓
- Discount compared to monthly✕
Free $0/month | Annual Plan $29/month(billed annually) | Monthly Plan $39/month | |
|---|---|---|---|
| Every number traceable to its SEC source — no 3rd party APIs | ✓ | ✓ | ✓ |
| Historical financial data | 3 years | 17+ years | 17+ years |
| Calculated financial metrics | 27 | 90+ | 90+ |
| Interactive financial statement visualizations | Limited | ✓ | ✓ |
| Post-earnings price reaction analysis | Limited | ✓ | ✓ |
| Stock screener with 100+ stackable filters | Limited | ✓ | ✓ |
| Insider transaction tracking from Form 4 filings | Limited | ✓ | ✓ |
| Institutional ownership monitoring | Limited | ✓ | ✓ |
| Watchlists with price targets, thesis notes and alerts | ✕ | ✓ | ✓ |
| Comps — dedicated peer comparison workspace | ✕ | ✓ | ✓ |
| One-click Excel export of every dataset | ✕ | ✓ | ✓ |
| Stock price movement analysis | Limited | ✓ | ✓ |
| Next-day filing availability | ✓ | ✓ | ✓ |
| 7-day free full trial, no risk | ✕ | ✓ | ✓ |
| Discount compared to monthly | - | 26% Discount | ✕ |
Everything Included in Your Subscription
Monthly and yearly plans include every feature below. See the full features breakdown.
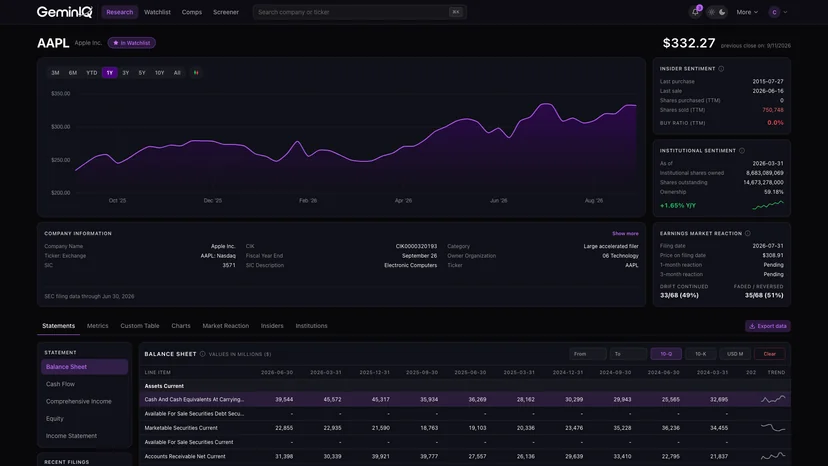
Company Snapshot
Price, insider and institutional sentiment, and post-filing drift for any company on a single screen.
Learn more →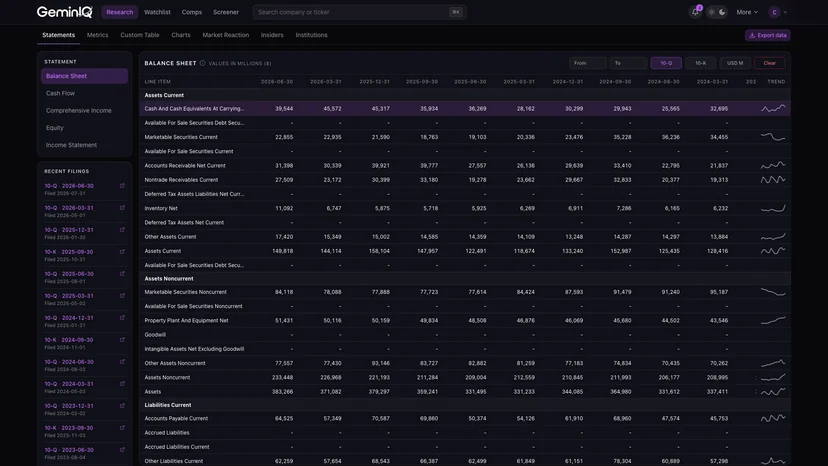
Financial Statements
10-Q and 10-K data exactly as filed with EDGAR, every figure tagged to its XBRL source, with 17+ years of history.
Learn more →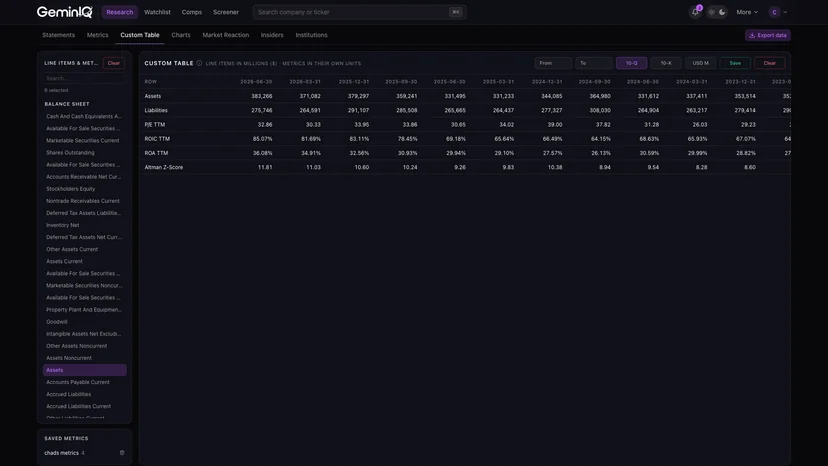
Custom Tables
Put any as-filed line item beside any calculated metric, then save the layout to reuse on every company.
Learn more →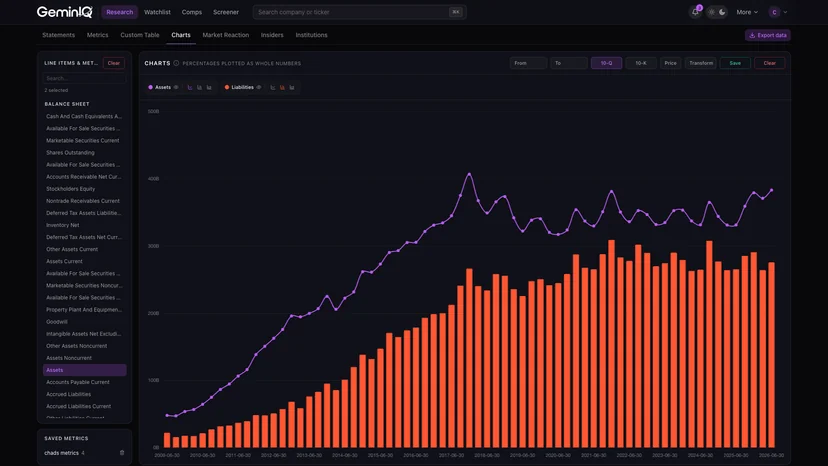
Interactive Charts
Mix line, bar and area series, overlay the share price, and normalize wildly different scales onto one axis.
Learn more →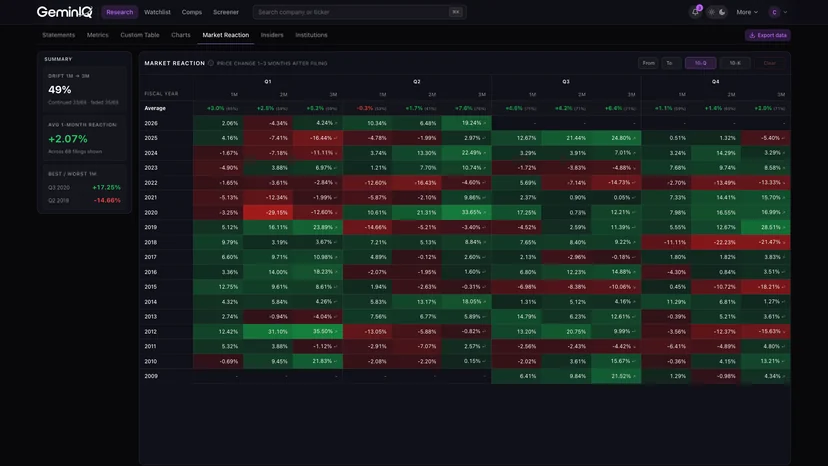
Earnings Market Reaction
A heat map of how the stock moved 1 to 12 months after every filing, summarized into drift statistics.
Learn more →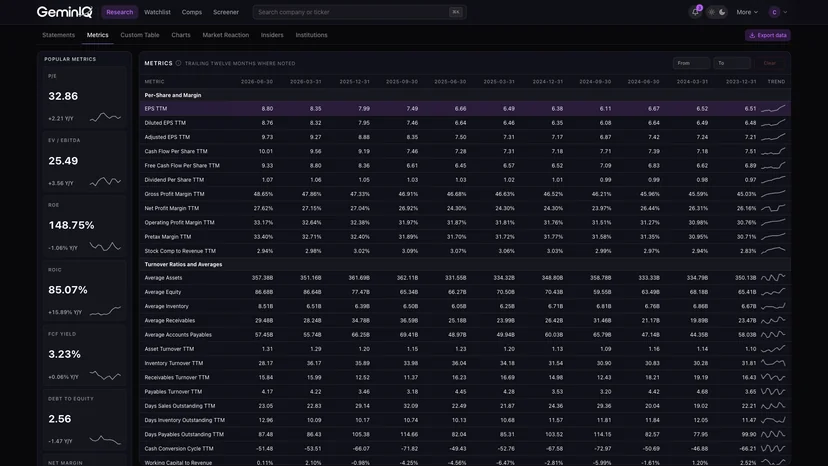
90+ Calculated Metrics
ROIC, Altman Z-Score, EV/EBITDA, FCF yield and more, recomputed from source with every new filing.
Learn more →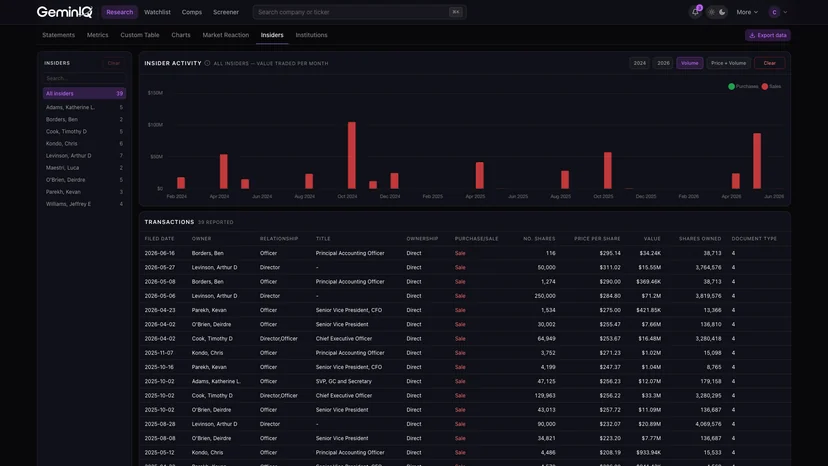
Insider Transactions
Form 4 buying and selling on a timeline and plotted on the price chart, filterable down to a single insider.
Learn more →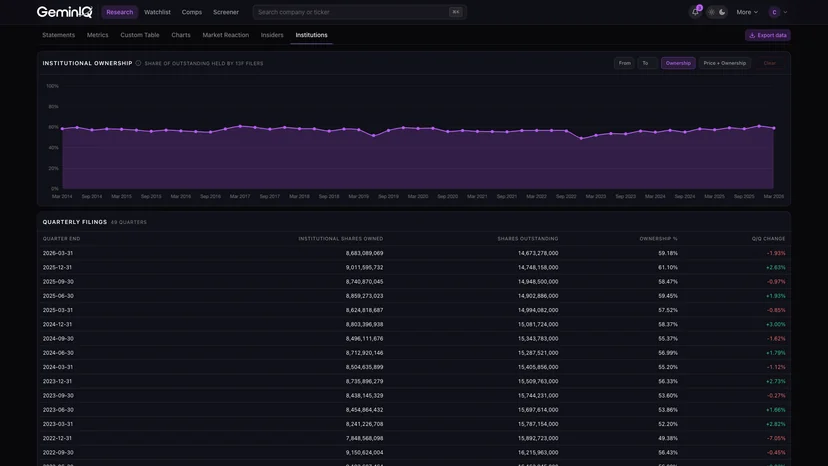
Institutional Ownership
Aggregate 13F ownership over time, with the quarters institutions added or cut marked on the price chart.
Learn more →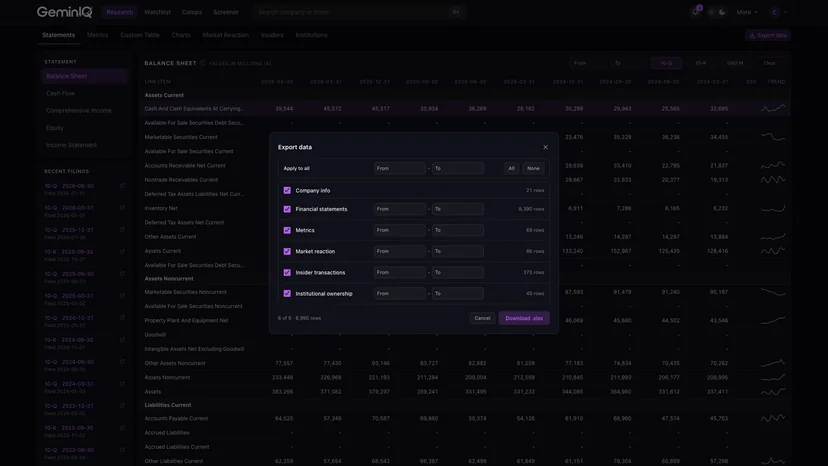
One-Click Data Export
Every dataset for a company in one .xlsx, each with its own date range and raw numeric values.
Learn more →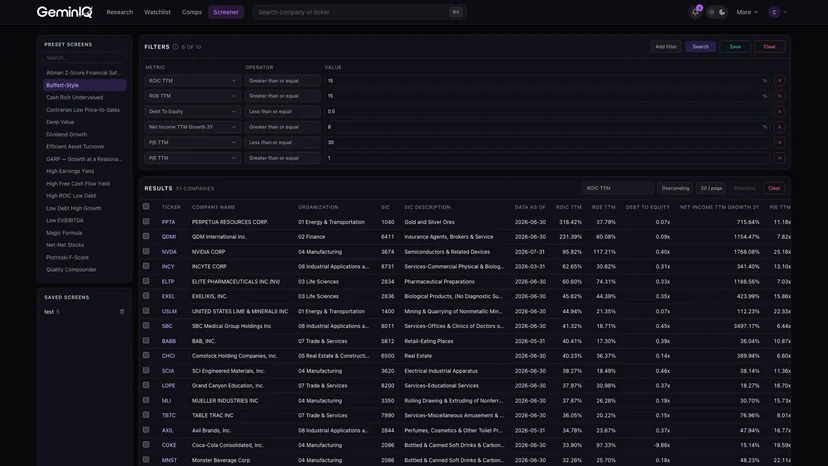
Stock Screener
Stack up to 10 filters across 100+ metrics, or start from 18 prebuilt strategies like the Magic Formula.
Learn more →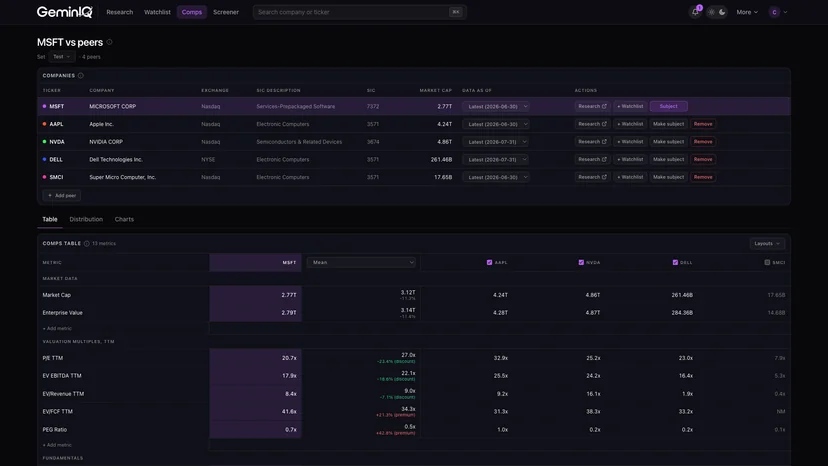
Comps
Saved peer sets with median, mean or harmonic benchmarks, distribution views and implied valuation ranges.
Learn more →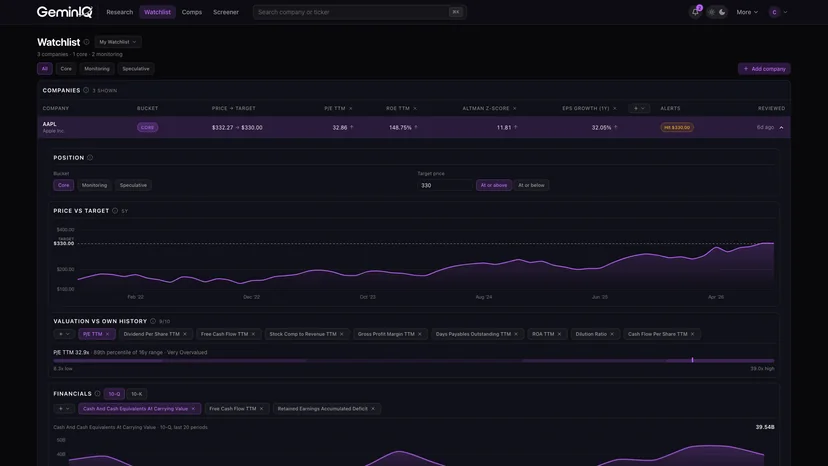
Watchlists
Conviction buckets, price targets, thesis notes and alerts on every position, plus valuation vs. its own history.
Learn more →Frequently asked questions
Have questions?
We have answers.
GeminIQ is an investment research platform designed to help you research faster and invest smarter. We replace the need to dig through fragmented PDF filings by organizing SEC data into a seamless, interactive timeline with built-in metrics.
All of our financial data is sourced directly from official SEC filings, including 10-Q (quarterly) and 10-K (annual) reports.
Most financial tools use third-party APIs that simplify data by grouping similar metrics into broad categories. While this makes data easier to process, it strips away the specific details found in the original reports. We don't use third-party aggregators. Instead, we parse the raw 10-Q and 10-K filings directly. This allows us to present the financial line items as they appear in the official report, preserving company-specific labels and XBRL tags that aggregated platforms typically strip out.
Unlike platforms that rely on third-party APIs to normalize metrics into generic categories, and going beyond platform's document-viewing capabilities, GeminIQ offers the best of both worlds. We parse 10-Q and 10-K filings directly to create a structured database of raw metrics. This means you get the auditability of a filing viewer with the analytical power of a terminal, without the data loss inherent in third-party aggregation.
We use a combination of advanced algorithms and human oversight to process the data. GeminIQ parses raw EDGAR XBRL and preserves the company's own reported values, labels, and XBRL tags. It does not remap line items into generic vendor buckets. We also validate figures to correct known filing errors, providing you with institutional-quality accuracy.
We offer next-day filing availability, ensuring you have timely access to the latest financial statements and market data to make informed decisions.
We provide comprehensive historical data without the arbitrary "3-year limits, 5-year limits, etc.” found on tier pricing. Our goal is to give you the complete picture of a company's cycle, not just the recent snapshot.
GeminIQ provides over 90 calculated core financial metrics. From margins and turnover ratios, to growth rates and valuation ratios. You can easily switch between balance sheet, income statement, cash flow, equity, and comprehensive income views to see the full picture of a company's health.
Yes. This is our biggest difference. "Terminal" style sites force you to read rows of static tables. GeminIQ transforms 10-K and 10-Q data into interactive timelines. You can visualize trends, spot anomalies, and see the story behind the numbers instantly, rather than digging through endless columns of text.
Yes. Our platform includes tools for insider sentiment monitoring and institutional data monitoring, allowing you to see how company insiders and major institutions are reacting to market changes.
Absolutely. You can build custom tables from any statement line item or calculated metric, save those layouts and reapply them to any ticker, run the screener across 100+ financial metrics with up to 10 stackable filters, and keep a stock watchlist organized by conviction with your own price target, investment thesis and built-in stock alerts on every position.
Yes. Comps is a dedicated stock comparison tool for benchmarking a company against its peers. Start from a subject company, add peers each with their own filing period, and compare them three ways: a side-by-side table with a selectable median, mean or harmonic-mean statistic and a premium/discount readout, a distribution view showing where each company sits across the peer range, and small-multiple charts tracking every metric over time. For valuation multiples it also states the implied value range the peer quartiles put on the subject company.
Yes. Any company's data can be exported to a single Excel workbook in one click — company info, financial statements, metrics, market reaction, insider transactions and institutional ownership. Each dataset can carry its own date range and shows the row count it will produce before you download, and the .xlsx is written as raw numeric values with no formatting layer, so it drops straight into your own models.
Yes, we offer a 7-day free trial with both our annual and monthly plans. This gives you full access to test our timelines, metrics, and search tools before you commit.
Both plans include all features, such as interactive timelines, price variance tools, and over 90 financial metrics, with no ads. The annual plan offers a discounted rate compared to the flexible pay-as-you-go monthly plan.
Yes. Whether you are on a monthly or annual plan, you can manage your subscription settings directly through your account.