Grocery Outlet (GO) Q3 2026 Earnings: EPS Up 8%

By Chad Hartman
Published · Last updated
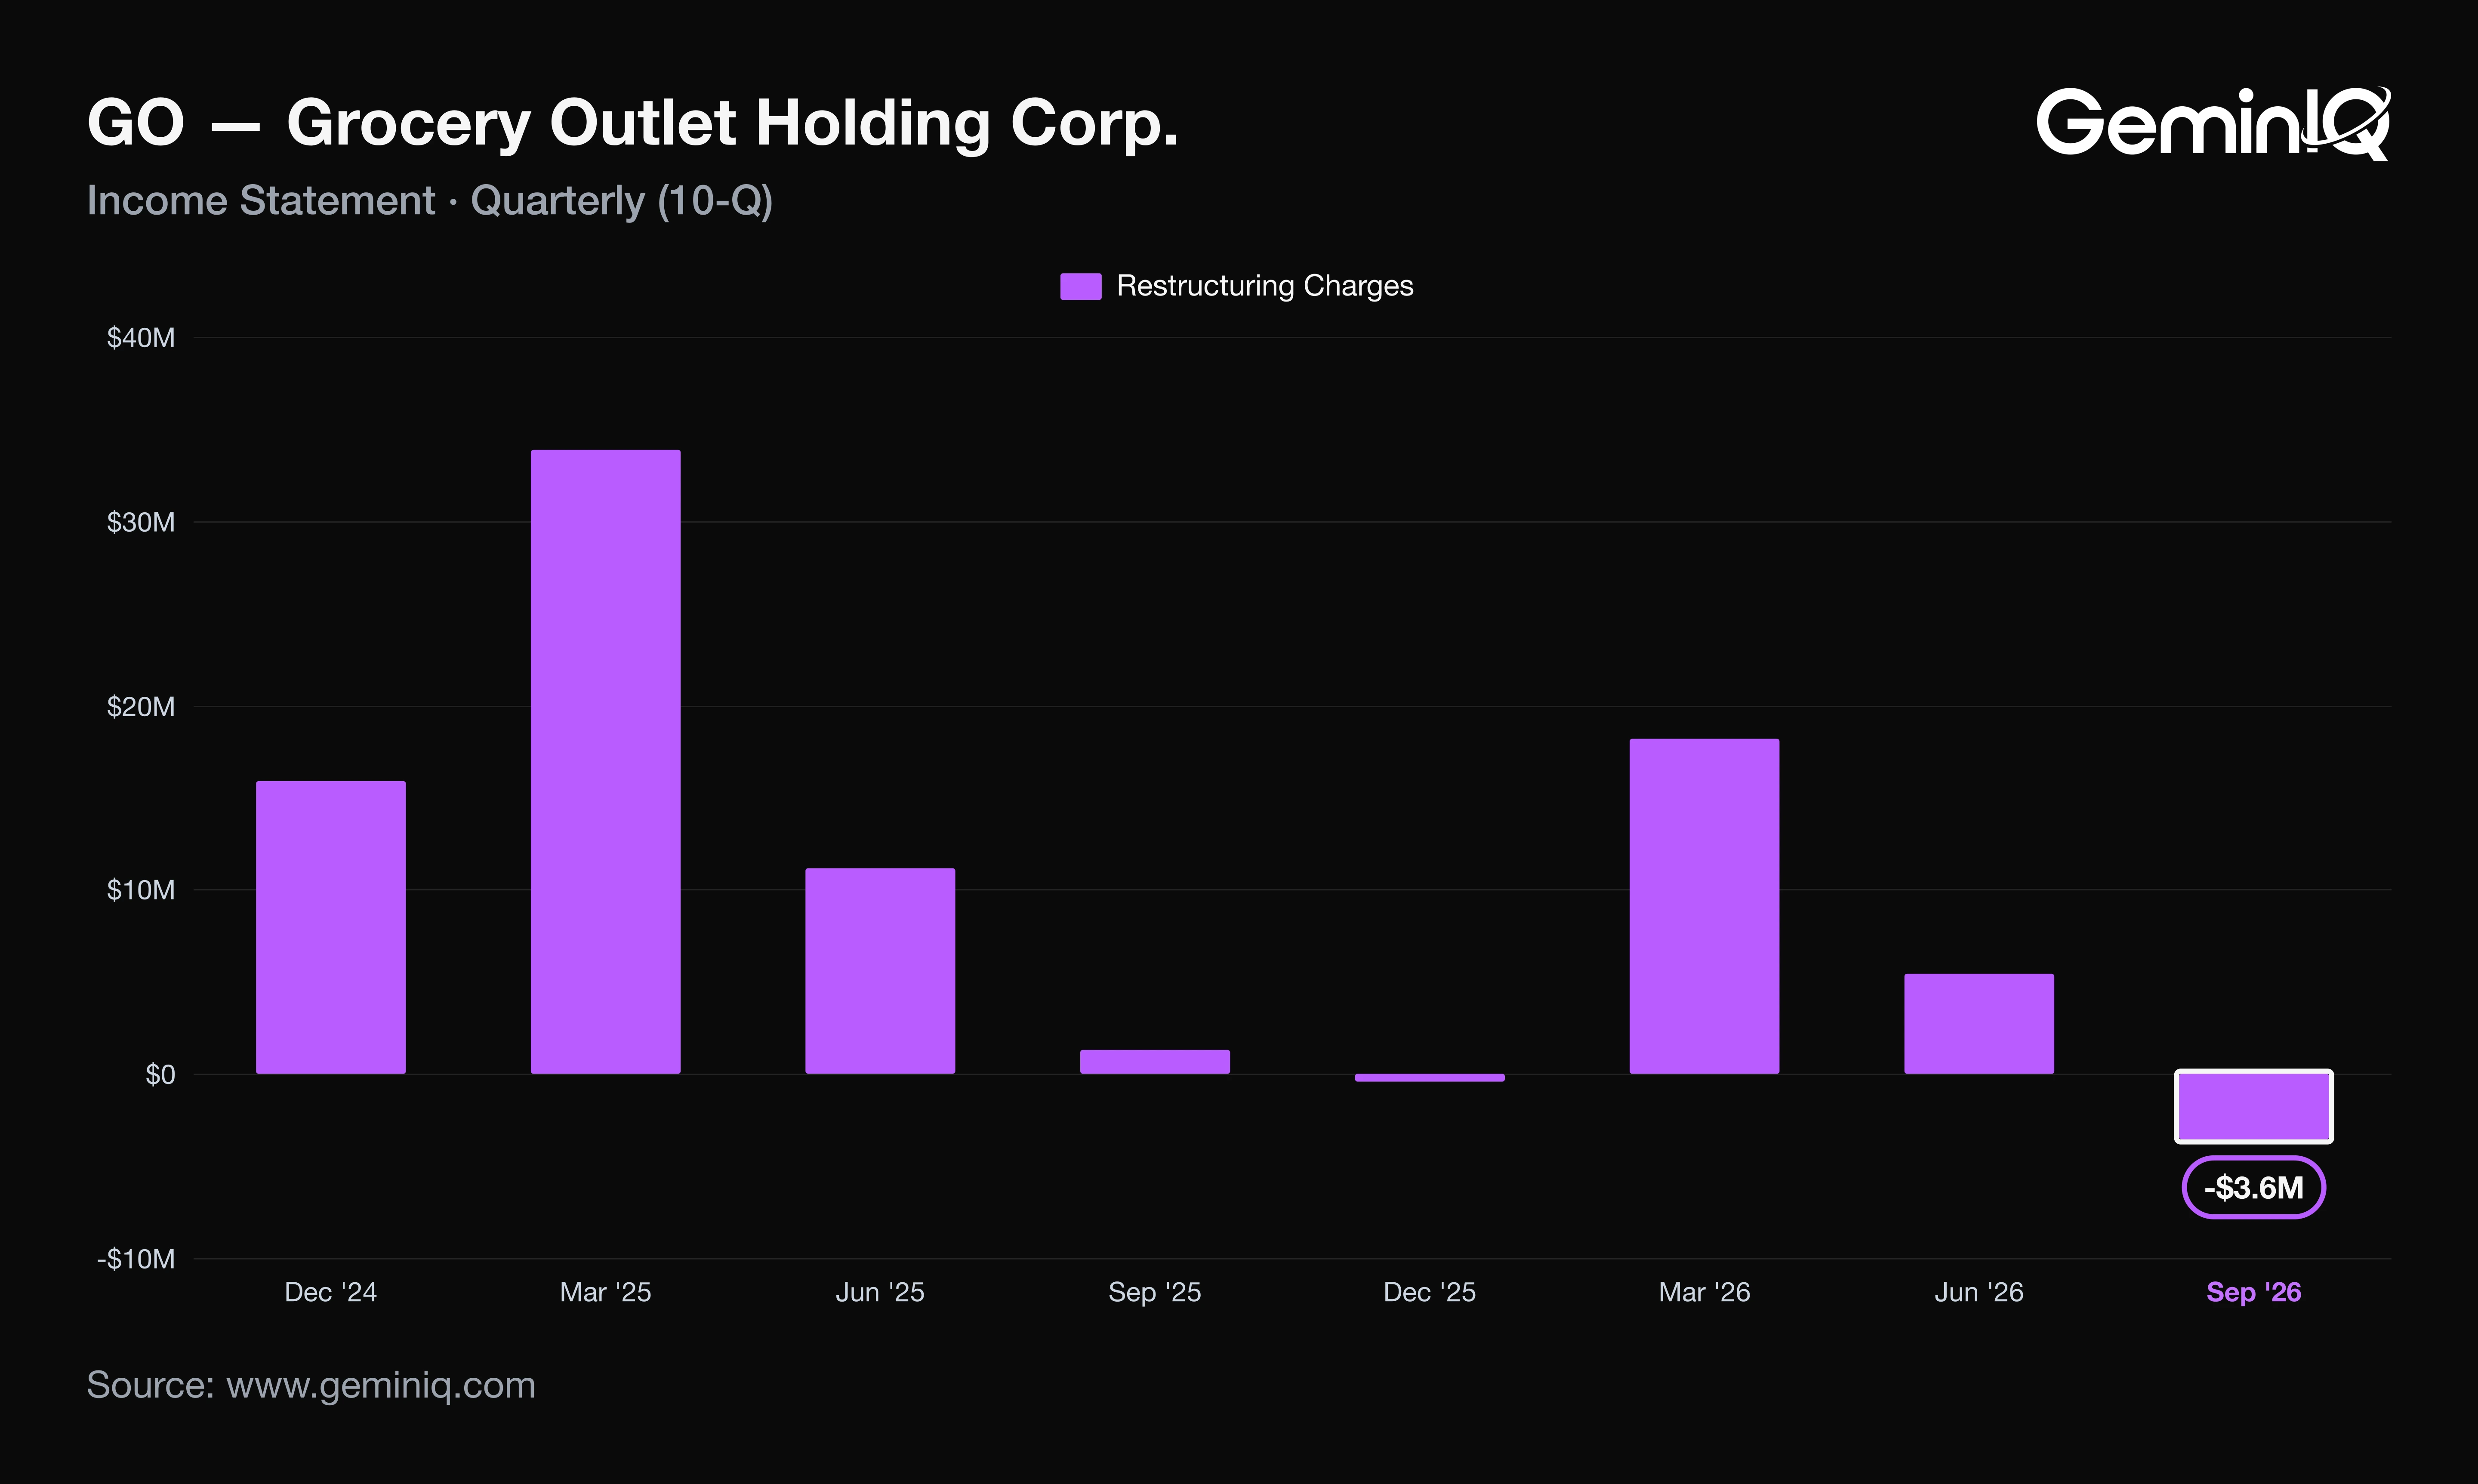
Grocery Outlet (GO) reported Q3 FY2026 revenue of $1.18 billion, up 0.9%, and diluted EPS of $0.13, up 8.3%, for the 13 weeks ended October 3, 2026; the 8-K release and the 10-Q were both filed November 10, 2026. The company's own adjusted EPS fell to $0.16 from $0.21, because the GAAP gain rests on a lower tax rate and a $3.6 million net restructuring credit. Operating cash flow was $18.2 million and free cash flow was negative.
| Field | Value |
|---|---|
| Company | Grocery Outlet ($GO) |
| Quarter | Q3 FY2026, 13 weeks ended October 3, 2026 |
| Earnings release | November 10, 2026 (Form 8-K) |
| 10-Q filed | November 10, 2026 |
| Revenue | $1.18 Billion (+0.9% YoY) |
| Diluted EPS | $0.13 (+8.3% YoY) |
| Operating margin | 2.0% (+0.1 pts YoY) |
| Operating cash flow (TTM) | $186.18 Million |
| Adjusted diluted EPS (8-K, non-GAAP) | $0.16 (-23.8% YoY) |
Grocery Outlet Q3 2026 Revenue, EPS and Margins
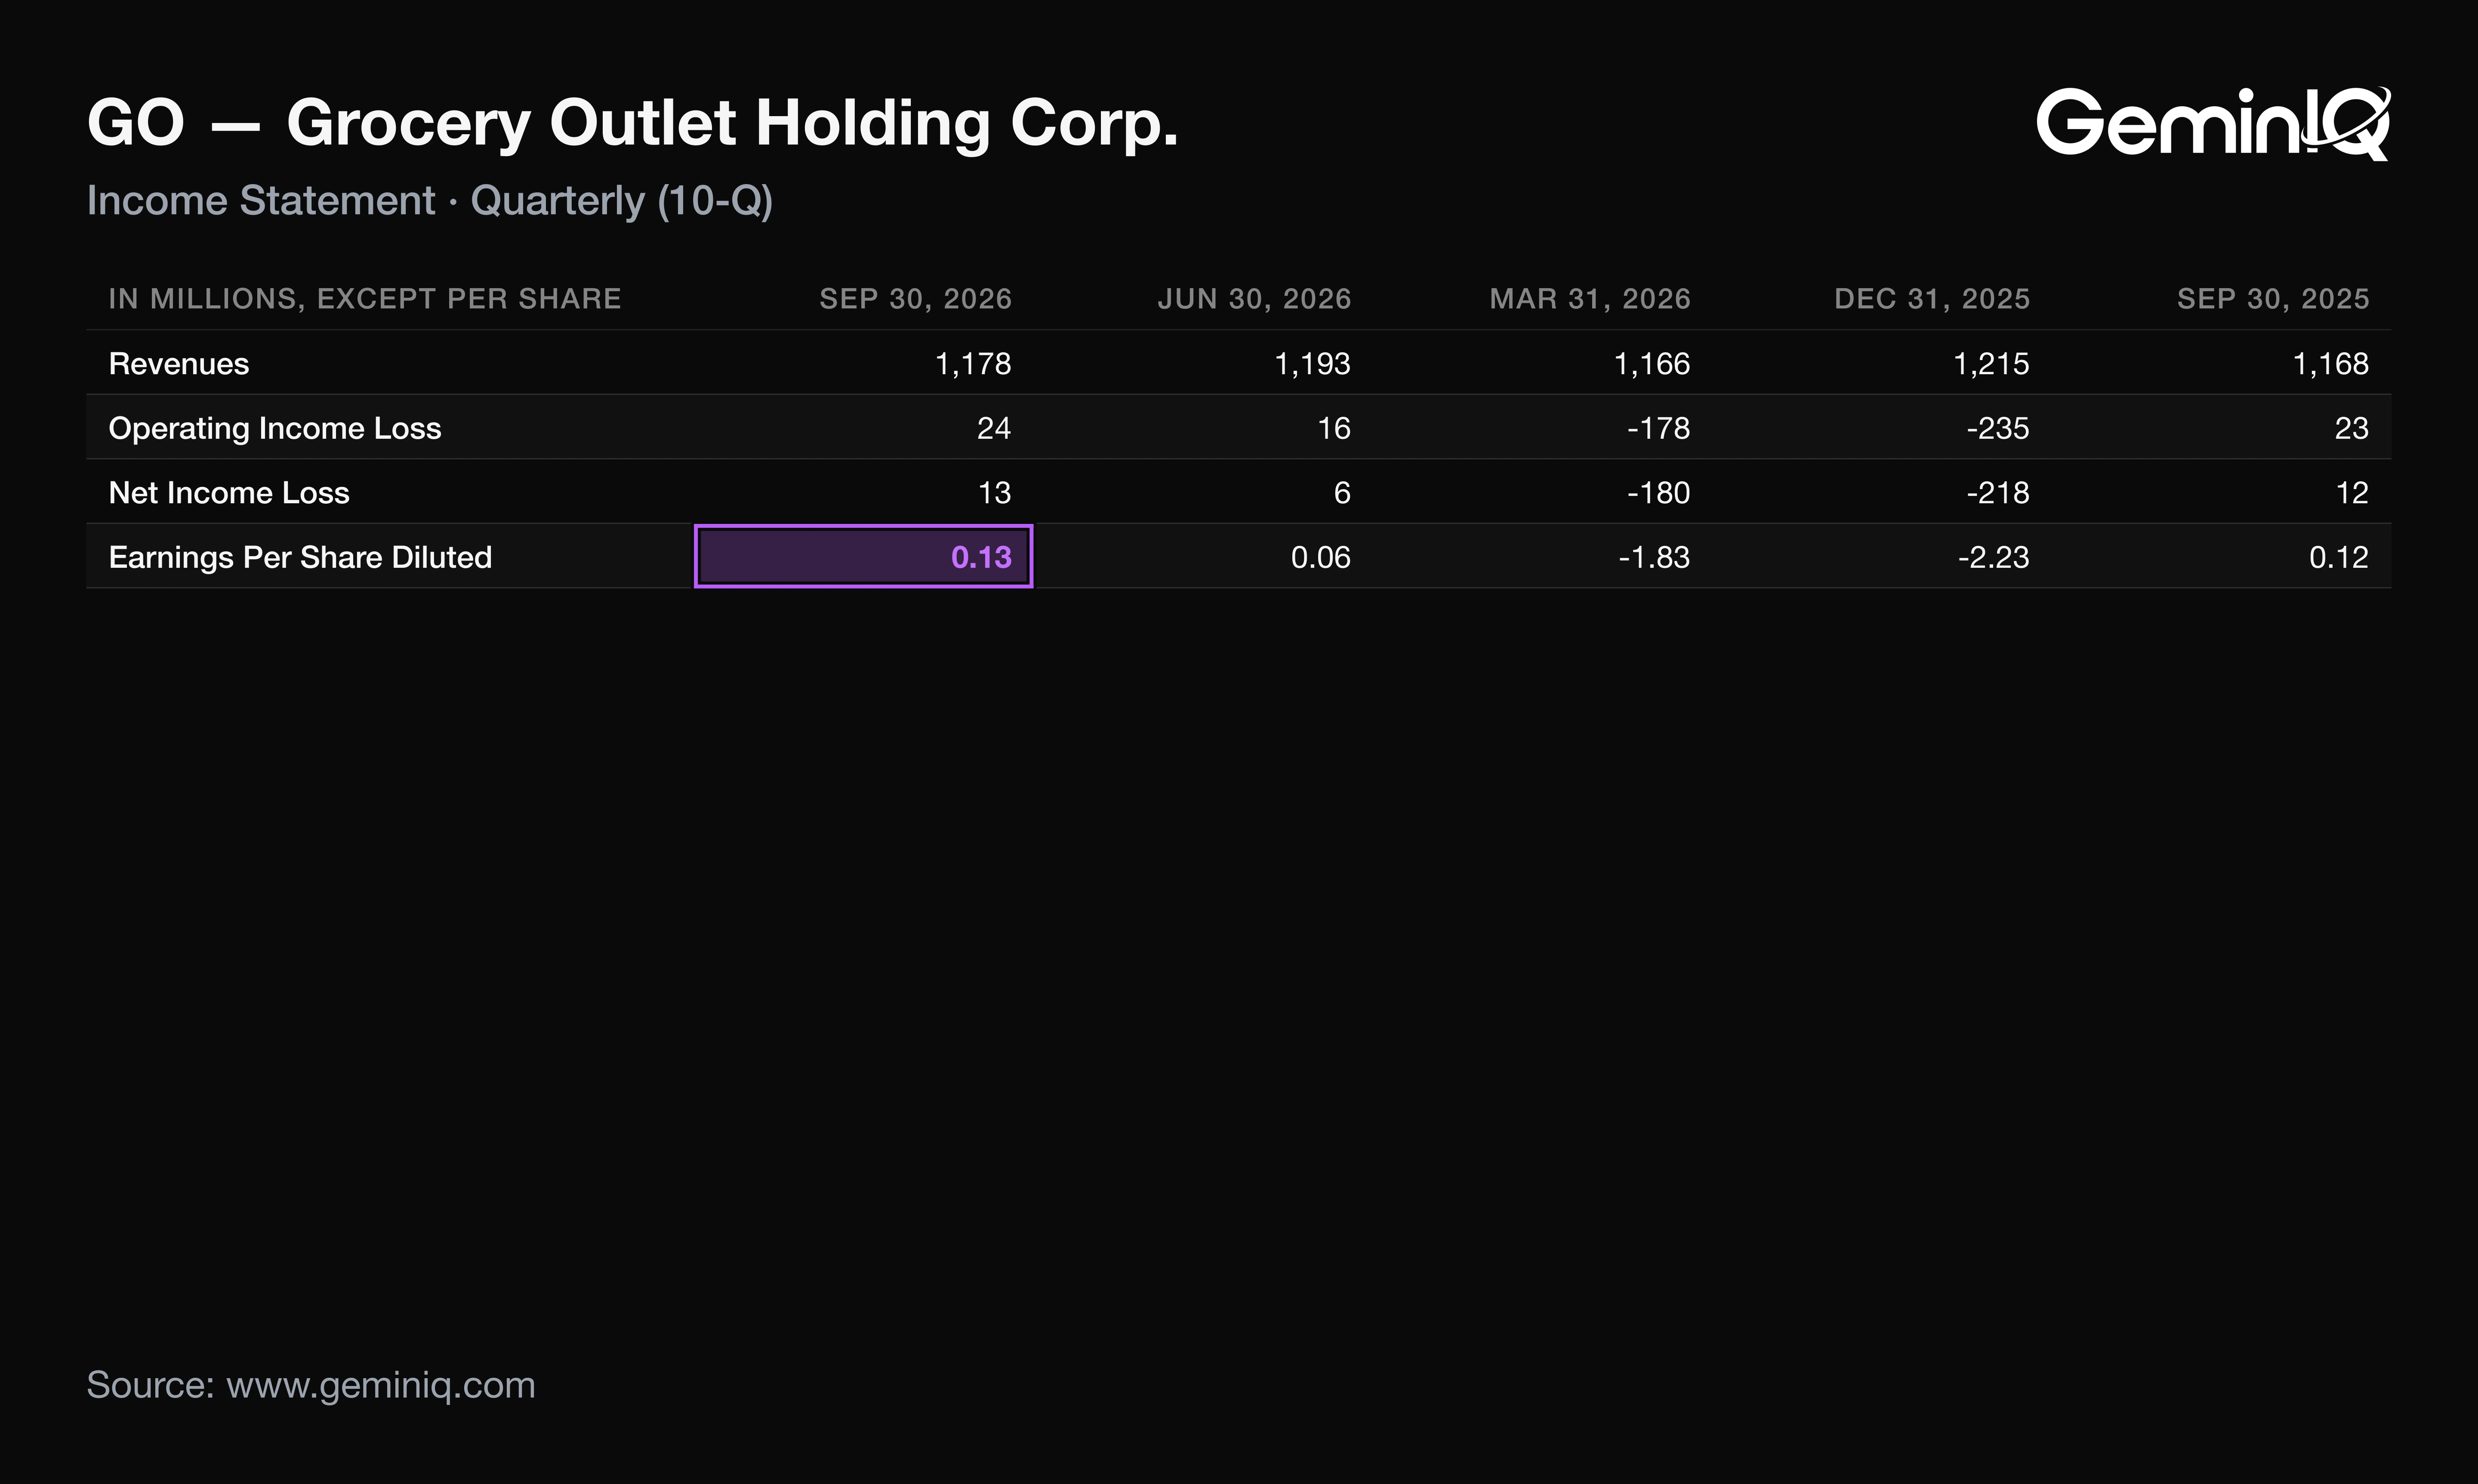
Grocery Outlet's Q3 2026 diluted EPS was $0.13, up 8.3% from $0.12, on revenue of $1.18 billion, up 0.9%. The gain came from the tax line, not from gross profit.
The Data: Gross profit fell 0.6% to $353.0 million, and gross margin slipped to 30.0% from 30.4%, the fifth-lowest of the last 16 quarters. Operating income rose 5.3% to $24.0 million, and pretax income rose 5.4% to $17.0 million. Net income rose 14.5%, and diluted shares rose 1.6% to 100.29 million.
Why: The effective tax rate fell to 21.8% from 28.0%; the 10-Q attributes the drop to a cumulative adjustment from returning to the estimated annual rate method. Had the tax rate held at 28.0%, net income would have been about $12.2 million and diluted EPS $0.12, flat with last year (derived). The higher share count then took six points off EPS growth relative to net income growth.
Operating margin of 2.0% was the seventh-highest of the last 16 quarters, so the quarter was ordinary, not weak. EPS growth without the tax cut was zero.
What Grocery Outlet's 10-Q Shows Beyond the Press Release
The release led with a return to positive comparable store sales, up 0.5%, and the 8-K's own reconciliation shows adjusted net income down 24.7% to $15.6 million and adjusted EBITDA down 10.9% to $59.4 million. A reader who saw positive comps would expect profit to follow. Instead, the 10-Q shows the profit line carried by a non-cash credit.
The Data: Operating income of $24.0 million included a $3.6 million net restructuring credit, against a $1.3 million charge a year earlier. Excluding restructuring in both quarters, operating income was about $20.5 million against $24.1 million, down roughly 15% (derived). The 8-K splits the credit into $15.8 million of non-cash credits, mostly lease write-offs, offset by $12.2 million of cash charges.
Why: Comparable sales rose on a 2.4% increase in transactions, while average transaction size fell 1.9%. The company attributes the gross margin decline to promotions, higher transportation costs and a Cyclospora-related drop in produce demand, and says it does not expect the outbreak to have a material ongoing effect. It also raised its total estimated net restructuring charges to $22 million to $29 million, now substantially complete by the fourth quarter of fiscal 2027.
The credit came from writing off leases, not from selling more groceries.
Grocery Outlet Q3 2026 Free Cash Flow, Debt and Capital Spending
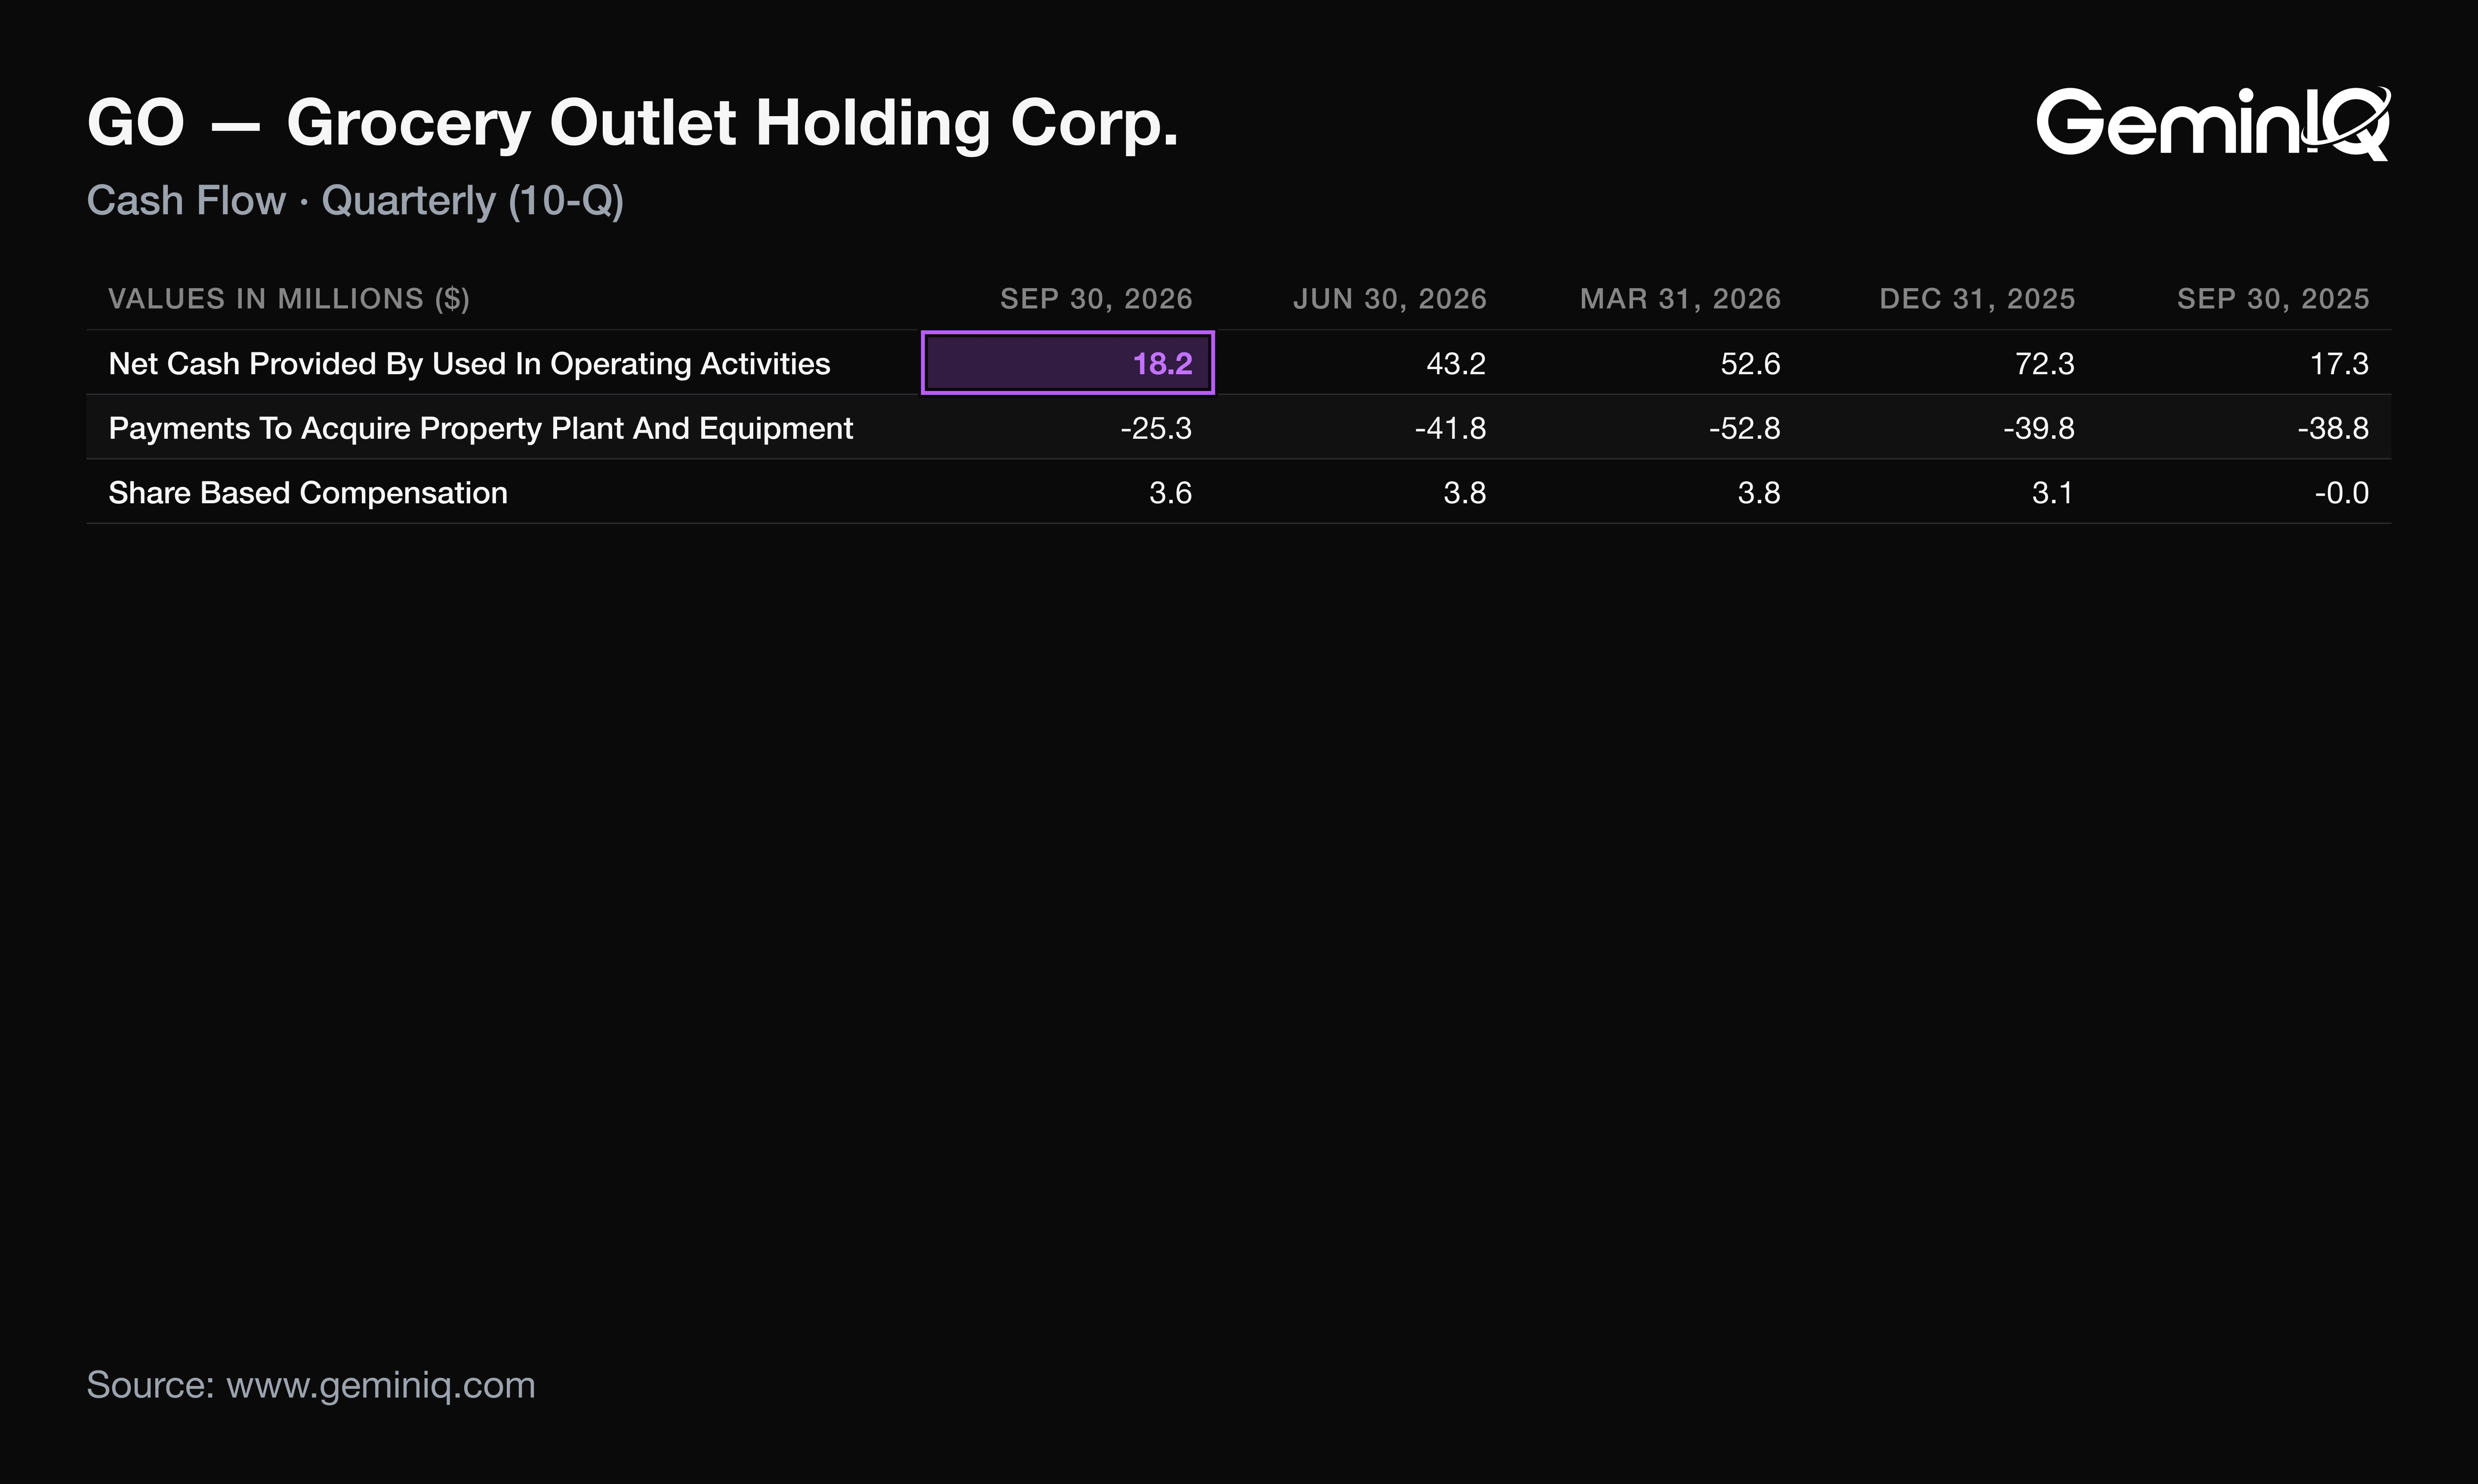
Grocery Outlet's Q3 2026 operating cash flow was $18.2 million, up 5.2% from $17.3 million a year earlier and down 57.9% from $43.1 million in Q2. That was the third-lowest of the last 16 quarters.
The Data: Capital expenditure fell 35.0% to $25.3 million, the lowest of the last 16 quarters, so free cash flow was -$7.1 million against -$21.6 million a year earlier. GeminIQ's pre-calculated Free Cash Flow for the trailing twelve months was $26.6 million, up from -$28.3 million.
Why: Of the $14.4 million year-over-year improvement in quarterly free cash flow, $13.5 million came from lower capital spending and $0.9 million from operating cash. The 8-K attributes lower capex to fewer new-store and warehouse projects. The revolver rose to $240.0 million from $220.0 million in January, with $153.8 million of capacity left and $59.8 million of cash. No shares were repurchased, and the $100.0 million authorization is untouched.
The 10-Q puts expected cash costs for the lease exits at $57 million to $64 million, so cash for the plan is still to be paid.
Grocery Outlet's 2026 Guidance After Q3
In the 8-K, Grocery Outlet raised its fiscal 2026 comparable sales guide to 0.2% to 0.4% from -0.5% to 0.0%, and trimmed its adjusted EBITDA guide to $225 million to $229 million from $225 million to $235 million. The comps raise did not reach the profit guide.
The Data: Adjusted EBITDA of $168.2 million through 39 weeks implies $56.8 million to $60.8 million for Q4, against $59.4 million in Q3. Diluted adjusted EPS guidance of $0.52 to $0.55, less $0.41 for 39 weeks, implies $0.11 to $0.14, against $0.16 in Q3 (derived). Net sales guidance was unchanged at $4.70 billion to $4.72 billion.
Why: The company guided gross margin to 29.8% to 30.0%, unchanged, and capex to $170 million, unchanged. So the higher comp guide comes with no higher margin guide, and the top of the EBITDA range sits at roughly the Q3 level. In the prior quarter's 8-K the company raised floors instead: adjusted EBITDA to $225 million from $220 million and adjusted EPS to $0.51 from $0.45.
The company's own implied fourth quarter is no better than its third.
How GO Stock Has Moved After Past Earnings Reports
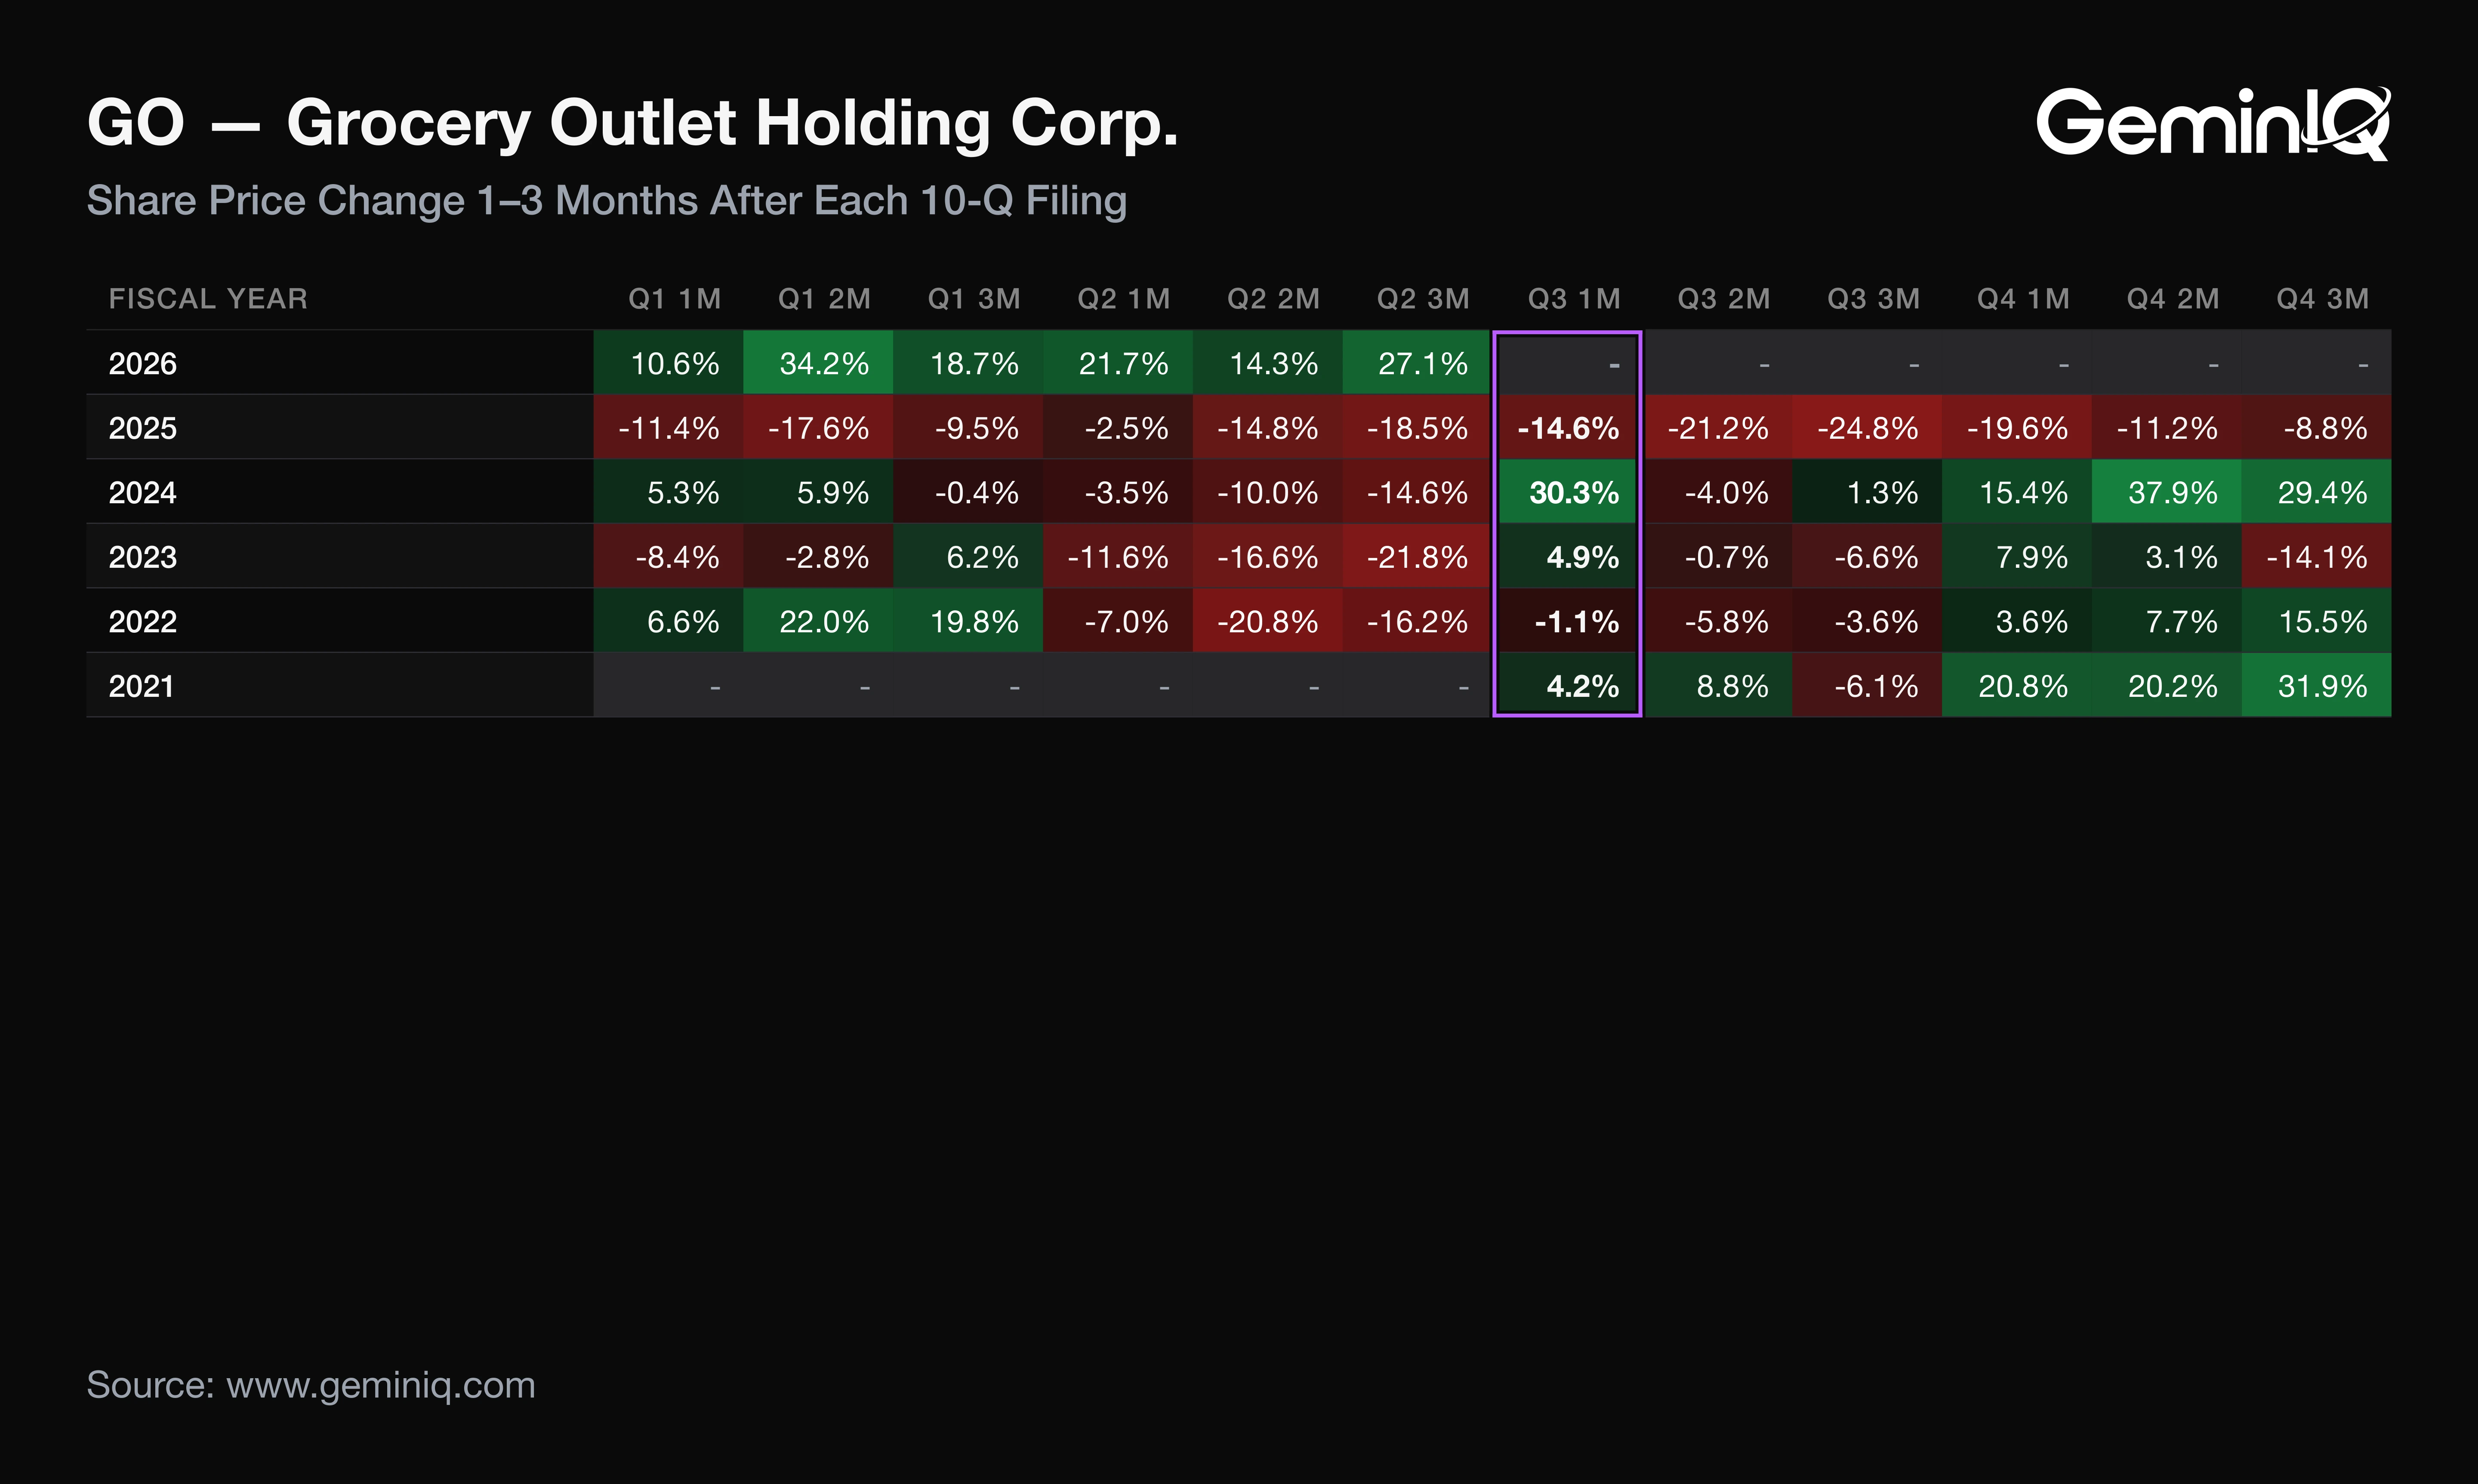
The last 12 10-Q filings with a completed one-month window, filed November 2023 to August 2026, were followed by a median one-month return of +5.1%, positive after 7 of 12, in a range from -19.6% to +30.3%.
The Data: The three-month median was -7.7%, positive after only 4 of 12. Past Q3 filings were followed by +4.9% / -6.6% (FY2023), +30.3% / +1.3% (FY2024) and -14.6% / -24.8% (FY2025), one-month and three-month. This filing's window has not elapsed. The GeminIQ Earnings Reaction Heat Map shows each cell; see also GeminIQ's earnings-reaction study.
Why: The sign flips between windows rather than between quarters, so a one-month gain has not historically been held through three months. These figures describe how Grocery Outlet's stock moved after its past filings; they are a historical association, not a forecast.
As context, SEC Form 13F data put institutional ownership at 94.66% of shares at June 30, 2026, the third-lowest of the last 16 quarter ends. SEC Form 4 data, filed through August 27, 2026, show 17 insider purchases totaling $8.3 million against 12 sales totaling $923 thousand over the prior 12 months, a reversal of the 21 sales ($5.5 million) and 7 purchases ($4.9 million) a year earlier. Both sets predate this release.
Any quarter whose profit growth rests on a tax-rate drop and a non-cash credit should have its cash flow statement read before its EPS.
Frequently Asked Questions
When does Grocery Outlet report earnings?
Grocery Outlet reported Q3 FY2026 results and filed its 10-Q on November 10, 2026. Last year it filed its Q3 10-Q on November 5, 2025, and its fourth-quarter results on March 4, 2026. That is a filing pattern, not a forecast of the next date.
Does Grocery Outlet pay a dividend?
Grocery Outlet paid no dividends in Q3 FY2026 or over the trailing twelve months. The 10-Q states the company has not historically paid, and does not expect to pay, cash dividends on its common stock.
Is Grocery Outlet profitable?
Grocery Outlet earned $13.3 million in Q3 FY2026, a 1.1% net margin, but its trailing-twelve-month net profit margin was -7.99%. A $158.0 million non-cash goodwill impairment in Q1 drove a 39-week net loss of $161.4 million. The current ratio was 1.30x.
Where can I verify Grocery Outlet's Q3 2026 figures?
The 10-Q and the 8-K earnings release are on SEC EDGAR, both filed November 10, 2026. The 10-Q reports 561 stores at October 3, 2026.
Wall Street's data. Main Street's price.
Institutional terminals charge thousands a year for as-filed accuracy. GeminIQ gives you the same thing for a fraction of the cost: financials built directly from raw SEC EDGAR filings, not third-party APIs, with full XBRL traceability back to the original 10-K or 10-Q. No normalized guesswork, just calculated metrics, charts, screeners, and watchlists built on numbers exactly as the company reported them. Start researching now at GeminIQ.com.
All financial figures cited in this article reference Grocery Outlet Holding Corp.'s Q3 2026 10-Q (filed November 10, 2026, period ending September 30, 2026), with guidance and management commentary drawn from the company's Form 8-K earnings release (filed November 10, 2026). All SEC filings are publicly available at SEC EDGAR and SEC EDGAR.
Disclaimer: The content in this blog is for educational and entertainment purposes only and does not constitute financial, legal, or tax advice. Investing involves risk, including the loss of principal. The views expressed are my own and not intended as financial advice or a guarantee of future performance.