How to Read SEC Form 4: Insider Buying and Selling Explained
By Chad Hartman
Published June 4, 2026 · Last updated June 14, 2026
SEC Form 4 is a two-page document. Most investors either ignore it entirely or glance at the headline number and move on. Both approaches miss most of what the filing actually contains. The real information in a Form 4 is not the share count — it is the transaction code, the ownership type, the price paid, the post-transaction total, and whatever the footnotes say. Together, those five elements tell you whether an insider made an economic decision or a mechanical one. This guide walks through every field in the document so you can read any Form 4 that hits EDGAR and know exactly what it means.
Table of Contents
- What Form 4 Is and Who Has to File It
- The Header: Reporting Person and Issuer
- Table I: Non-Derivative Securities
- The Transaction Codes: The Most Important Column on the Form
- Table II: Derivative Securities
- The Footnotes: Where the Context Lives
- Direct vs. Indirect Ownership: A Distinction That Matters
- The Two-Business-Day Rule and What It Means for Timing
- How to Track Form 4 Filings Without Reading Each One Manually
What Form 4 Is and Who Has to File It
Form 4 is a Statement of Changes in Beneficial Ownership. The SEC requires it from anyone who qualifies as an "insider" under Section 16 of the Securities Exchange Act of 1934. The definition of insider is more precise than the word suggests. It covers three groups: corporate officers, directors, and any person or entity that beneficially owns more than 10% of a class of the company's registered equity securities.
The officer definition goes further than most investors expect. Under SEC rules, an officer for Form 4 purposes includes the president, principal financial officer, principal accounting officer, any vice president in charge of a principal business unit or division, any other officer who performs a policy-making function, and any person who performs a similar policy-making function regardless of title. A regional sales manager with no policy-making authority does not trigger the filing requirement. A chief revenue officer who sits in on board strategy sessions almost certainly does.
Directors are straightforward — every member of the board of directors must file. The 10% beneficial ownership threshold applies to large shareholders: hedge funds, activist investors, or any other entity that accumulates a stake above that level.
The filing requirement is triggered by any transaction that changes the insider's beneficial ownership: open-market purchases, open-market sales, option exercises, RSU vestings, tax-withholding dispositions, and gifts. Each transaction type generates a Form 4. Understanding which type you are looking at is the first step in reading the filing correctly.
The Header: Reporting Person and Issuer
The top section of Form 4 establishes who is filing and for which company. It looks administrative, but several fields here carry analytical weight.
Line 1 (Name of Reporting Person) identifies the insider filing the report. Note whether the reporting person is an officer, a director, or a 10% beneficial owner — this is stated explicitly in the checkbox fields just below the name. A filing by a director carries different interpretive weight than a filing by the CFO. A filing by a 10% holder carries different weight still, since that entity's motivations may be entirely separate from any view on the company's near-term fundamentals.
Line 2 (IRS Identification) can be an individual's Social Security number (typically redacted for individuals, appearing as the last four digits or a placeholder) or an entity's EIN for corporate filers. For individual insiders, this field rarely matters. For entity filers — a hedge fund, an LLC, a family trust — cross-referencing the EIN against other SEC filings can reveal whether multiple Form 4 filers share the same beneficial ownership structure.
Line 4 (Relationship of Reporting Person to Issuer) is where the checkboxes appear: Director, Officer (with title specified), 10% Owner, and Other. This is the field to read before anything else on the form. The relationship determines how much weight the transaction carries. An open-market purchase by the CFO is a fundamentally different signal than an open-market purchase by a board member who holds no operational role.
Line 5 (If Amendment) tells you whether this is an original filing or an amendment. Amended Form 4s — filed as 4/A — exist to correct errors in prior filings, update ownership totals, or add footnote disclosures. Always check whether a filing you are reading is original or amended. If it is an amendment, find the original and compare.
Table I: Non-Derivative Securities
Table I is the primary table for the vast majority of Form 4 analysis. It covers transactions in non-derivative securities — common stock, preferred stock, restricted stock units that have vested into shares, and any other direct equity holding. If an insider buys or sells actual shares, it appears here.
The table has eight columns. Reading them left to right:
Column 1 (Title of Security) names the class of shares involved. For most public companies this is simply "Common Stock." Where it says something else — Class A Common Stock, Class B, Series B Preferred — note the distinction. Different share classes carry different voting rights, and the column 1 entry tells you which class the insider is transacting in.
Column 2 (Transaction Date) is the date the transaction executed, not the date the Form 4 was filed. The gap between these two dates should be no more than two business days. A filing that shows a transaction date significantly earlier than the filing date may indicate a late-filed report — something the SEC tracks and penalizes. Late filings are worth noting because they suggest the insider may have less rigorous compliance practices, or in rare cases, that the transaction date was recorded incorrectly.
Column 3 (Deemed Execution Date) is used only when a transaction was executed on a different date than it was deemed effective — common in certain derivative exercises and plan-based transactions. For most standard open-market buys and sells, this column is blank.
Column 4 (Transaction Code) is the single most important column in the entire form. It is covered in full in the next section.
Column 5 (Amount of Securities Acquired or Disposed Of) shows the number of shares and whether they were acquired (A) or disposed of (D). This is the headline number most investors look at. Context matters far more than the raw share count — a sale of 10,000 shares by a CEO who owns 5 million shares is a very different event than a sale of 10,000 shares by a director whose total ownership was 12,000.
Column 6 (Price of Security) shows the price per share at which the transaction executed. For open-market purchases and sales, this is the actual market price paid or received. For RSU vestings and option awards, this is often left blank or entered as zero because no cash changed hands. When the price column is blank on a transaction that appears to be a purchase or sale, that is a signal to check the transaction code — the field in Column 4 that explains why.
Column 7 (Amount of Securities Beneficially Owned Following Reported Transaction) is the post-transaction ownership total. This is the number to track over time. The direction of this figure — rising, falling, or stable — across multiple Form 4 filings tells you more than any single transaction. An insider who has been filing steady RSU vesting events for three years, with a rising total ownership number because they are not selling the vested shares, is behaving differently than one whose total ownership number has been declining steadily despite routine RSU grants.
Column 8 (Direct or Indirect Ownership) is addressed in detail later in this guide. The short version: D means the insider holds the shares personally; I means the shares are held through some other entity — a trust, an LLC, a spouse, a foundation.
The Transaction Codes: The Most Important Column on the Form
Column 4 is where most investors stop reading carefully — and where most of the analytical signal lives. The transaction code is a single letter that categorizes every transaction on Form 4. The codes that matter most for fundamental research are the following.
P — Open-Market Purchase. The insider spent their own money to buy shares at the current market price. No compensation plan required this. No option exercise triggered it. No vesting schedule delivered it. The insider made an affirmative decision to allocate personal capital to the stock. This is the only transaction code that represents a completely voluntary, out-of-pocket equity investment by an insider. P transactions are the primary signal in insider transaction analysis.
S — Open-Market Sale. The insider sold shares at the current market price on the open market. Like P, this is a voluntary decision. Unlike P, it is far more common — executives accumulate large equity positions through RSU grants and option awards, and routine diversification selling is rational regardless of the insider's view of the stock. An S transaction requires significant additional context before it carries analytical weight. How large is the sale relative to total holdings? Is there a footnote indicating a 10b5-1 plan? Has the insider been filing S transactions at a consistent cadence, or is this unusual?
A — Grant, Award, or Other Acquisition Pursuant to the Compensation Plan. An RSU grant, a stock option award, or any other equity compensation delivered through the company's plan. The insider did not choose this. The compensation committee granted it. An A transaction increases the insider's share count but represents no economic decision. It should not be interpreted as bullish conviction. The vast majority of Form 4 filings with large share counts are A transactions — which is precisely why the transaction code must be read before the share count.
D — Disposition to the Issuer. Shares returned or surrendered to the company. This most commonly appears when an executive forfeits unvested RSUs upon departure or when shares are tendered back to the company as part of a specific plan provision. A D transaction reduces share count but typically reflects a structural employment event, not a market view.
F — Payment of Exercise Price or Tax Liability. This is the tax-withholding code. When an RSU vests, the insider owes ordinary income tax on the fair market value of the vested shares. Rather than writing a check, most executives instruct the company to withhold a portion of the vested shares to cover the tax obligation. Those withheld shares appear as an F transaction — a disposition, reducing the insider's share count. F transactions generate a significant amount of the "insider selling" that appears in financial news headlines. They represent no economic decision on the insider's part. The shares were never received in cash form; they were surrendered automatically to pay a tax bill.
M — Exercise or Conversion of Derivative Security. An insider exercising stock options or converting a derivative instrument into common shares. The exercise itself is mechanical — options are exercised when they are in-the-money and approaching expiration. What matters is what happens immediately after. If the M transaction is followed by an S transaction on the same day or the next business day, the insider sold the acquired shares immediately — an exercise-and-sell that produces cash but signals no equity conviction. If the M transaction appears without a corresponding S transaction, the insider retained the acquired shares — a more meaningful signal.
G — Gift. Shares transferred as a gift, typically to family members or charitable foundations. G transactions appear as dispositions on the insider's Form 4. They carry no investment signal — the insider received no cash and is not expressing a negative view of the company by giving shares away.
The remaining codes — J, K, L, U, W, X, Z — cover special transactions such as small acquisitions, equity swaps, tender offers, and inherited securities. These appear infrequently in normal corporate filing activity and require individual assessment when they do.
Table II: Derivative Securities
Table II covers derivative securities: stock options, warrants, convertible notes, performance share units, and any other instrument that gives the insider the right or obligation to acquire or dispose of the underlying equity at a future date or price.
The structure of Table II is more complex than Table I. Each row covers a specific derivative instrument, and the columns capture both the derivative transaction itself and the underlying equity it converts into.
Column 1 (Title of Derivative Security) names the instrument — "Employee Stock Option (Right to Buy)," "Restricted Stock Unit," "Performance Share Unit," or similar. The exact instrument name matters because different derivatives have different exercise mechanics, expiration terms, and vesting conditions.
Column 2 (Conversion or Exercise Price) shows the strike price for options and warrants — the price at which the insider can purchase the underlying shares. For RSUs and performance share units, this is typically left blank or entered as zero because these instruments convert to shares automatically upon vesting without any cash outlay. The spread between Column 2 and the current market price tells you whether an option is in-the-money or out-of-the-money.
Column 3 (Transaction Date) and Column 4 (Transaction Code) function identically to their Table I counterparts.
Column 5 (Number of Derivative Securities Acquired or Disposed Of) shows how many derivative units were granted, exercised, or sold.
Column 6 (Date Exercisable and Expiration Date) is the window during which the derivative can be exercised. For stock options, this tells you the earliest exercise date (often tied to a vesting schedule) and the final date before expiration. An option exercise occurring close to the expiration date is far less informative than one occurring well ahead of it — near-expiration exercises are often forced by the ticking clock rather than by the insider's view of the stock.
Column 7 (Title and Amount of Securities Underlying Derivative) identifies the underlying security and the number of shares the derivative converts into. This is the figure to compare against Table I ownership to understand total beneficial ownership on a fully-converted basis.
Column 8 (Price of Derivative Security) captures the price paid or received for the derivative instrument itself — relevant for secondary-market transactions in exchange-traded derivatives. For most employee compensation derivatives (options, RSUs), this is zero because the instrument was granted, not purchased.
Column 9 (Amount of Derivative Securities Beneficially Owned Following Reported Transaction) shows the post-transaction derivative position, parallel to Column 7 of Table I.
Column 10 (Ownership Form) again distinguishes direct from indirect ownership.
For most analytical purposes, Table II is secondary to Table I. The P and S transaction codes in Table I — voluntary open-market transactions — carry the primary signal. Table II matters most when an insider's total equity exposure needs to be assessed on a fully-diluted basis, or when an M transaction in Table I (an option exercise) needs to be traced back to the derivative instrument that generated it.
The Footnotes: Where the Context Lives
Every Form 4 has a footnotes section at the bottom. Standard financial news coverage never mentions the footnotes. This is the single biggest gap between how most investors read Form 4 data and how it should be read.
The footnotes are where the following information typically appears: whether a transaction is executed pursuant to a pre-established Rule 10b5-1 trading plan, the adoption date of that plan if disclosed, whether shares are held in specific trust structures, whether a transaction is part of a planned divestiture program, whether the filing amends a prior report and what the correction is, and any other context the insider or their legal counsel believes is material to understanding the transaction.
The 10b5-1 footnote is the most important one to identify. Rule 10b5-1 allows insiders to establish pre-planned trading schedules — setting the price, volume, and timing of future transactions — when they are not in possession of material non-public information. Once a valid 10b5-1 plan is in place, transactions can proceed automatically even during otherwise restricted windows, such as the period immediately before an earnings release. A sale executed under such a plan will almost always carry a footnote disclosure: language such as "This sale was made pursuant to a Rule 10b5-1 plan adopted on [date]."
When that footnote is present, the transaction carries substantially less analytical weight than a discretionary sale. The decision to sell was made on the plan adoption date — possibly months earlier — under conditions that may no longer be relevant. The current sale is mechanical execution of a prior decision.
When a large S transaction has no 10b5-1 footnote and no other disclosed reason, it deserves more scrutiny. That is a discretionary sale: the insider chose, within the current trading window, to convert equity into cash at the current market price. It is not automatically bearish — diversification, tax planning, and liquidity needs are all legitimate motivations — but the absence of a plan disclosure means the analytical context is thinner and requires more investigation.
The SEC tightened the 10b5-1 rules in 2023. For officers and directors, plans now require a mandatory cooling-off period of 90 days or until the next open trading window after adoption, whichever is later, with a maximum of 180 days. This reform reduced the ability to create plans immediately in advance of anticipated news events. A plan adopted under the post-2023 rules carries somewhat more credibility than plans established before the reform.
Direct vs. Indirect Ownership: A Distinction That Matters
Column 8 of Table I and Column 10 of Table II require the filer to indicate whether each position is held directly (D) or indirectly (I). The indirect category covers a wide range of structures: revocable trusts, irrevocable trusts, family limited partnerships, LLCs, and positions held by a spouse or other family member for whose securities the insider is deemed to have beneficial ownership.
Direct ownership — shares held personally by the insider — is the cleanest signal. A direct open-market purchase means the individual, personally, spent their own money on the stock. A direct open-market sale means the individual, personally, converted shares to cash.
Indirect ownership is murkier. A sale of shares held in a family trust might reflect estate planning, a trustee's decision, a beneficiary's liquidity need, or the insider's own portfolio management — any of these, or some combination. A purchase of shares through an LLC could reflect the insider's personal investment decision or a vehicle the LLC uses for reasons unrelated to the underlying stock. The existence of indirect ownership is not itself suspicious, but it reduces the precision of the signal. When a Form 4 shows both direct and indirect transactions, weigh the direct transactions more heavily.
Where indirect ownership gets interesting is the nature column — Form 4 requires filers to describe the indirect holding in a footnote. "By the John Smith Revocable Trust" tells you one thing. "By the John Smith 2019 Charitable Remainder Trust" tells you another. "By Clearwater Capital Partners LP" tells you a third. The structure of the vehicle can illuminate the purpose of the transaction in ways the transaction code alone cannot.
The Two-Business-Day Rule and What It Means for Timing
Before the Sarbanes-Oxley Act of 2002, insiders had up to 40 days to report a transaction on Form 4. The 2002 reform compressed that window to two business days from the transaction date. This change fundamentally altered the usefulness of Form 4 data for investors.
With a two-business-day window, Form 4 filings are nearly real-time. When an insider transacts today, the filing is typically public by Thursday or Friday of the same week. This means the information reaches the public market while the context is still fresh — price levels, recent news, and company events that were current when the decision was made are all still visible.
What the two-day rule also means is that late filings are detectable. If the transaction date in Column 2 is, say, March 3, and the filing date on the Form 4 header is March 14, the filing is late. The SEC tracks late Section 16 filings and companies are required to disclose them in their annual proxy statement. A pattern of late filings from a particular insider or a particular company's officers is a governance signal worth noting — it suggests either lax compliance culture or, in rare cases, deliberate delay.
For research purposes, the gap between transaction date and filing date is visible in EDGAR's filing metadata. GeminIQ's Insider Transactions feature displays the Filed Date for every transaction in a sortable table alongside owner name, relationship, title, ownership type, purchase/sale classification, share count, and price per share — so the lag between execution and disclosure is immediately visible without manual EDGAR comparison.
How to Track Form 4 Filings Without Reading Each One Manually
A company with ten officers and board members, all receiving regular RSU grants and participating in 10b5-1 plans, may file dozens of Form 4s per quarter. Reading each one individually — parsing the codes, checking footnotes, calculating net position changes — is impractical as a routine research process.
The analytical value of Form 4 data compounds over time. A single filing tells you a transaction occurred. Twelve months of filings tells you the baseline pattern. Five years of filings tells you the structural behavior — who buys, who never buys, who sells consistently versus who rarely sells, and when the pattern breaks. The pattern break is the signal. But identifying a pattern break requires the full history, and assembling that history from individual EDGAR downloads is a significant manual effort.
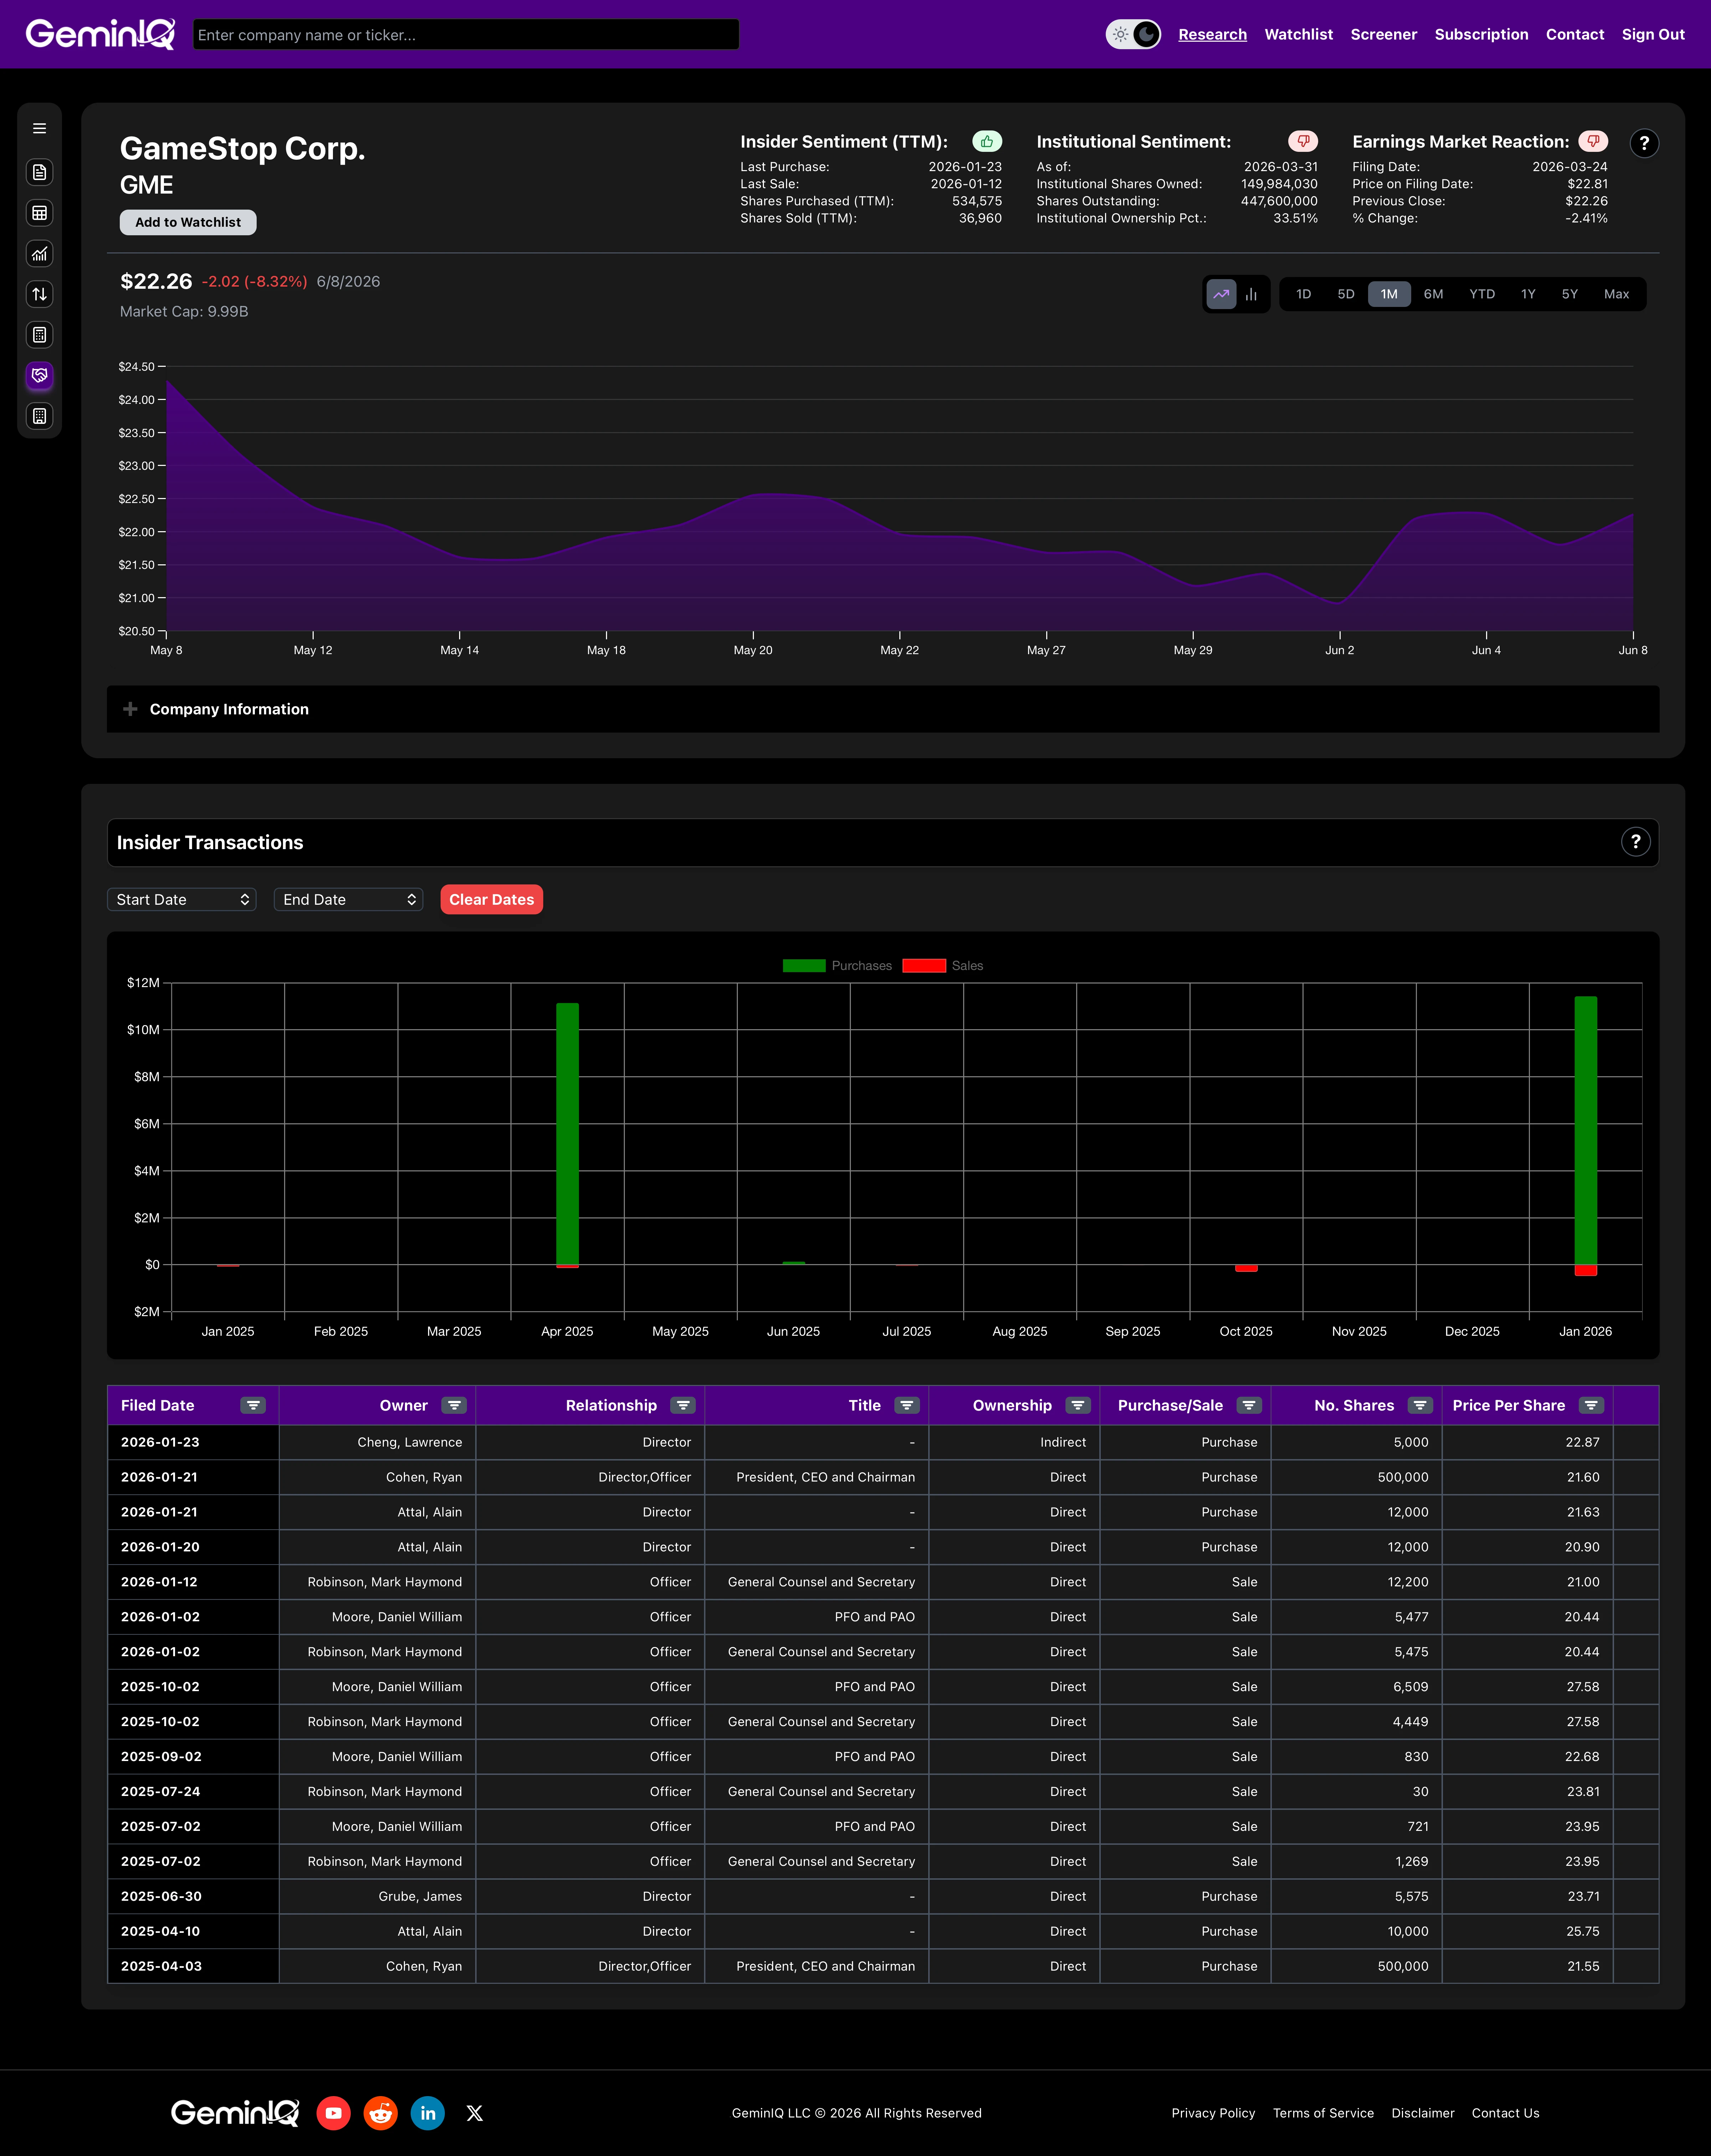
GeminIQ's Insider Transactions feature pulls directly from the raw Form 4 feed and displays every transaction in two views: a bar chart that plots total purchase and sale dollar volume by month — green bars for purchases, red bars for sales — filtered by any custom date range, and a sortable transaction table below it. The table shows eleven columns for every row: Filed Date, Owner, Relationship, Title, Ownership type (Direct or Indirect), Purchase/Sale classification, number of shares, price per share, total transaction value in dollars, shares owned after the transaction, and Document Type. Every column is filterable, so you can isolate, for example, all direct open-market transactions by officers within a specific date window in seconds.
Because GeminIQ sources from the raw SEC filing rather than a third-party aggregator, the ownership type, relationship, and title fields are preserved exactly as filed. The distinction between a direct sale by the CFO and an indirect sale through a family trust — which changes the analytical weight of the transaction entirely — is visible in the table without cross-referencing the original EDGAR document. The Shares Owned column, updated after each transaction, lets you track the direction of an insider's total position across the full history without manually reconstructing it from individual filings. The pattern break — when an insider who has never purchased shares on the open market suddenly does — is immediately visible. That is the signal. For a deeper look at how to interpret what Form 4 patterns reveal over time, see Insider Trading Tracker: How to Read Form 4 Signals Like a Pro.
Related Reading
Form 4 is one filing in a broader information system. For the full picture of how SEC disclosures fit together:
- Complete Guide to SEC Filing Types for Investors — covers 10-K, 10-Q, 8-K, DEF 14A, S-1, and Form 4 in a single reference.
- How to Read a 10-K: A Value Investor's Guide — the foundational annual filing that Form 4 data sits alongside.
- Hidden Information in SEC Filings: What Most Investors Overlook — how insider transaction patterns combine with balance sheet shifts and cash flow signals for a complete picture.
Research Faster. Invest Smarter.
Most financial websites rely on third-party aggregators that simplify or process data before you ever see it. We built GeminIQ because we believe you deserve a better fundamental analysis tool—one that goes beyond basic price charts and processed numbers. We extract our data directly from SEC 10-K and 10-Q filings to ensure that when you look at a balance sheet or a cash flow statement, you are seeing the numbers exactly how the company reported them. Our goal is to give you the tools to verify the narrative for yourself using clean, traceable data. Start researching now at GeminIQ.com.
Disclaimer: The content in this blog is for educational and entertainment purposes only and does not constitute financial, legal, or tax advice. Investing involves risk, including the loss of principal. The views expressed are my own and not intended as financial advice or a guarantee of future performance.