
Lam Research (LRCX) Q1 FY2027 Earnings: EPS Up 77%, OCF 1.27x Income

By Chad Hartman
Published · Last updated
Lam Research (LRCX) reported Q1 FY2027 revenue of $8.22 billion, up 54.4% from a year earlier, and diluted EPS of $2.19, up 76.6%, for the quarter ended September 27, 2026. The company released results on October 21, 2026 and filed its 10-Q on October 22. Operating cash flow of $3.50 billion was 127% of net income, but the June quarter's was 64%, so the cash line that looks like the quarter's strongest figure is mostly a timing swing: across the two quarters combined, operating cash flow was about 99% of net income.
| Field | Value |
|---|---|
| Company | Lam Research ($LRCX) |
| Quarter | Q1 FY2027, period ended September 27, 2026 |
| Earnings release | October 21, 2026 (Form 8-K) |
| 10-Q filed | October 22, 2026 |
| Revenue | $8.22 Billion (+54.4% YoY) |
| Diluted EPS | $2.19 (+76.6% YoY) |
| Operating margin | 40.0% (+5.6 pts YoY) |
| Operating cash flow (TTM) | $7.58 Billion |
| Operating cash flow ÷ net income (Q1 FY2027) | 127% |
Lam Research Q1 FY2027 Revenue, EPS and Margins
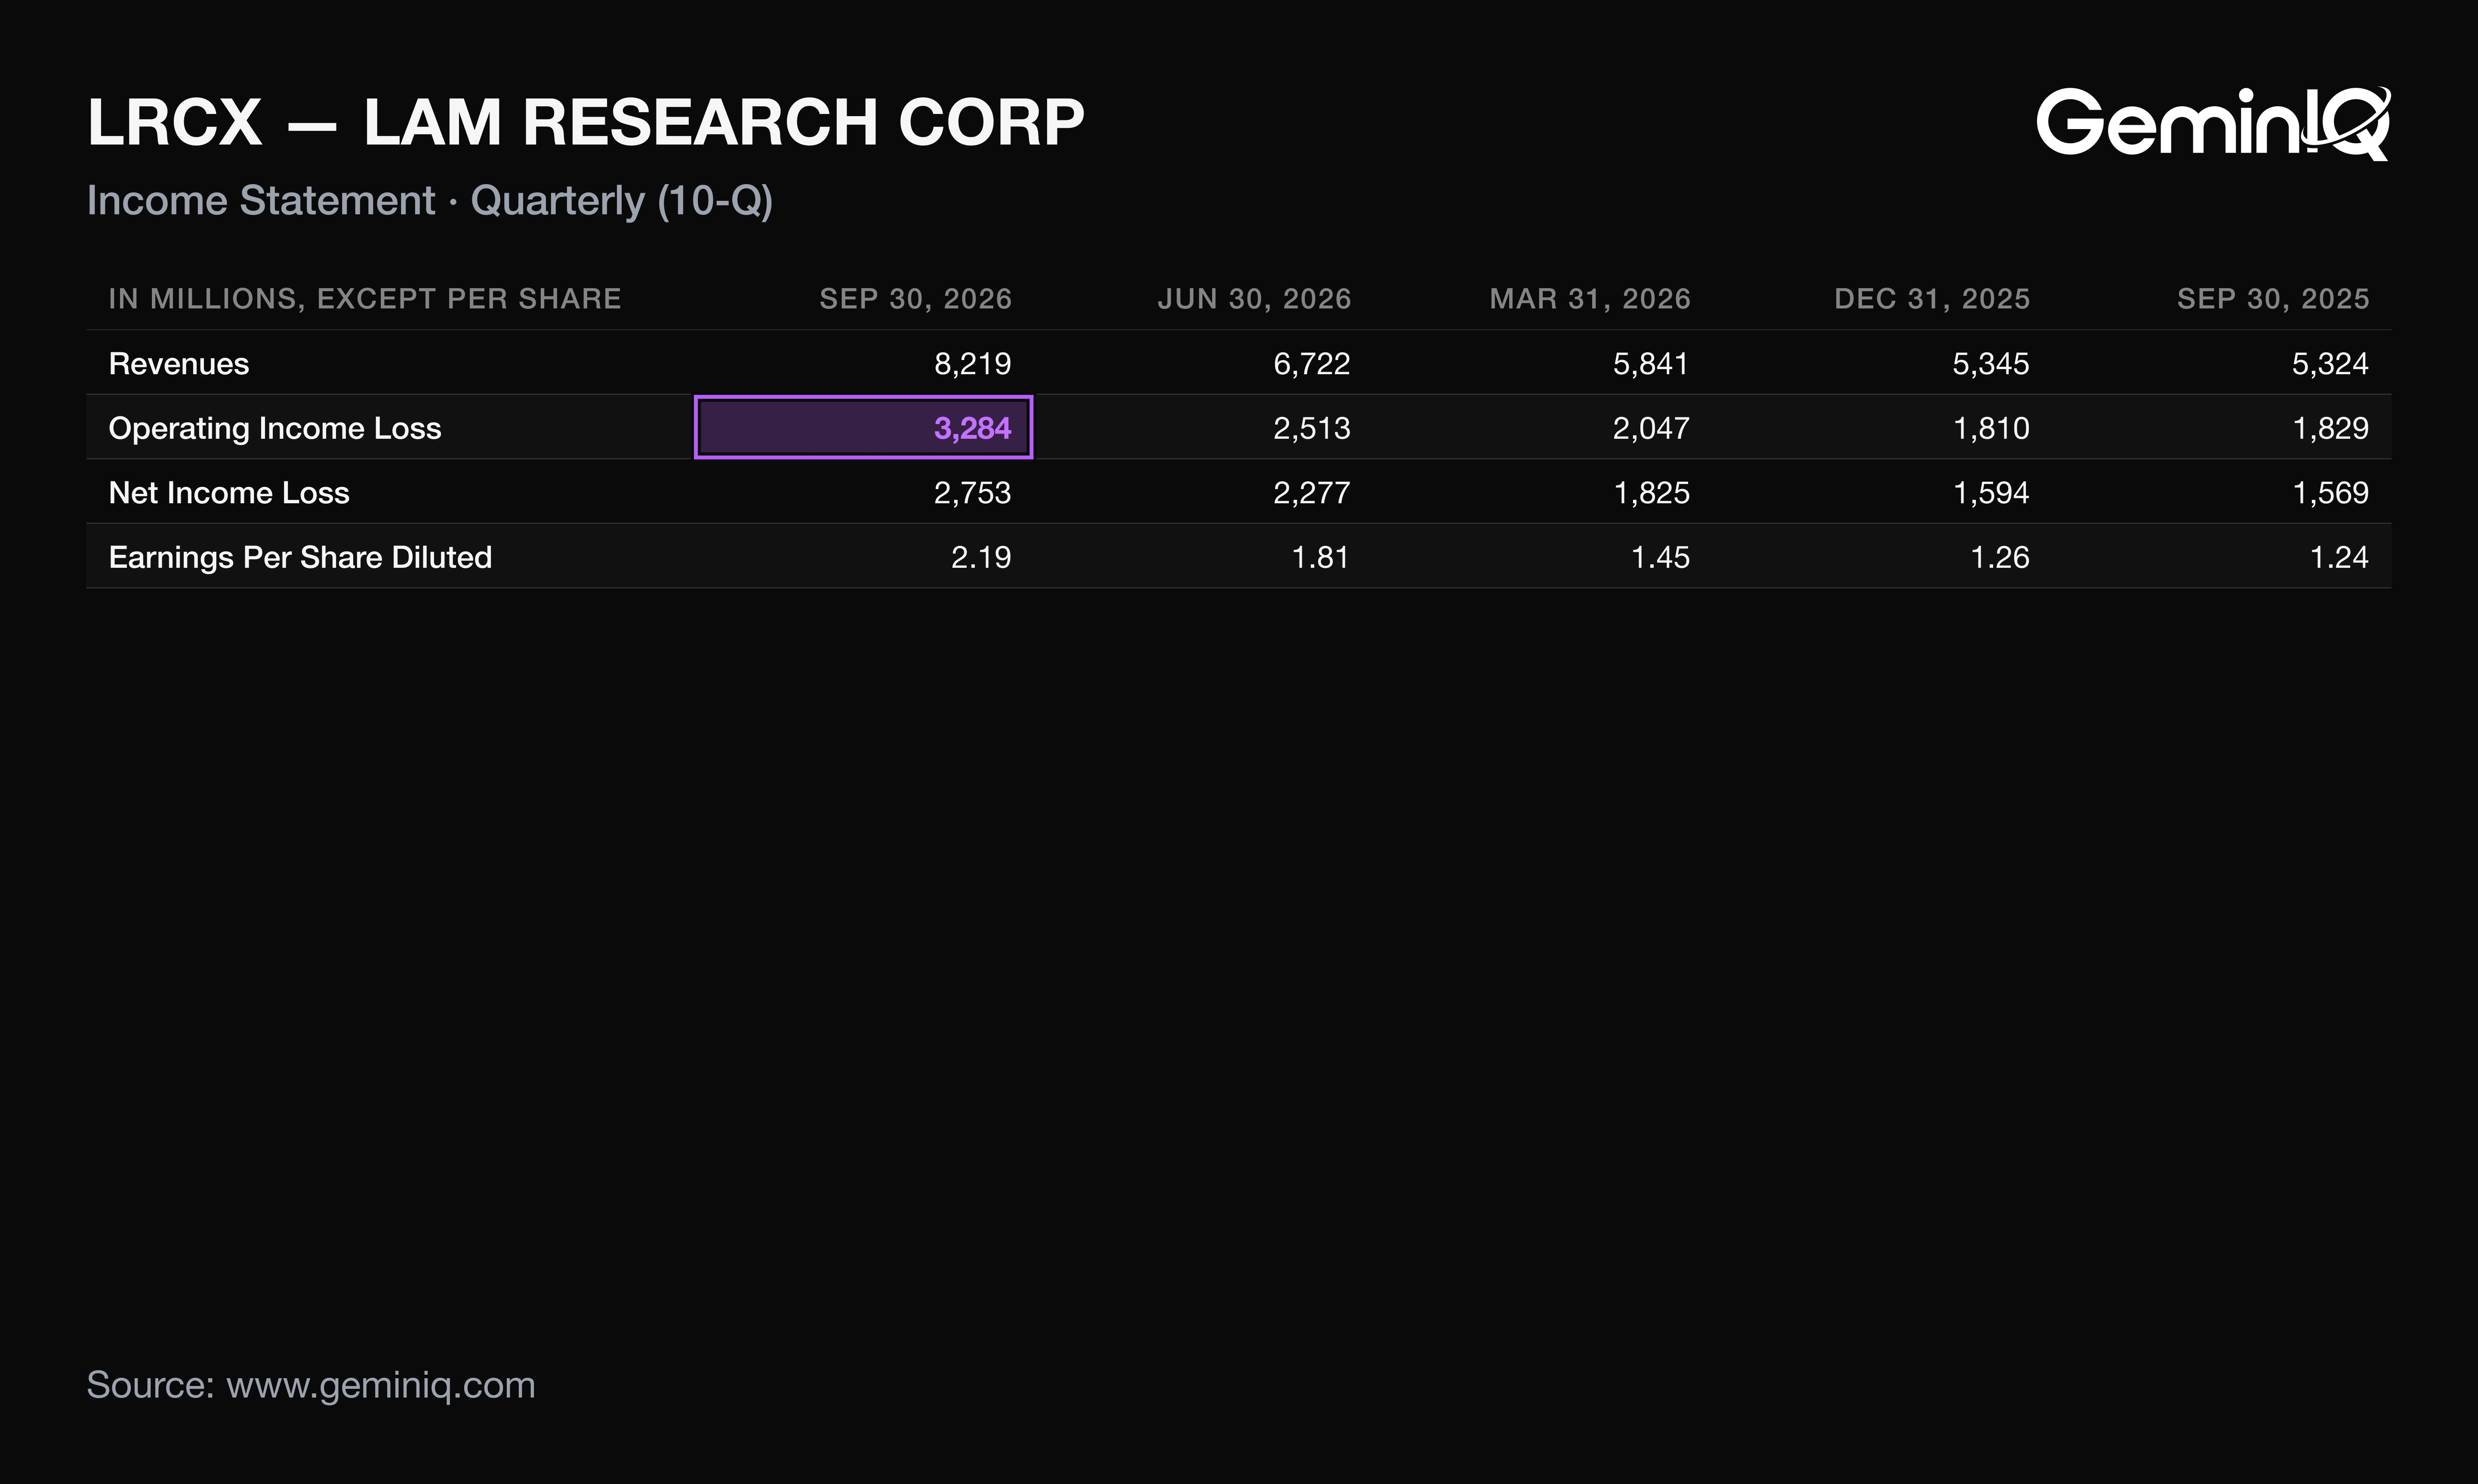
Lam Research's Q1 FY2027 revenue was $8.22 billion, up 54.4% from $5.32 billion a year earlier and the highest of the last 16 quarters. Operating income grew much faster than net income did from the June quarter, and the gap sits in the tax line.
The Data: Operating income was $3.28 billion, up 79.5% year over year and 30.6% from June, with operating margin at 40.0%, the highest of the last 16 quarters. Net income rose only 20.9% sequentially to $2.75 billion, so net margin slipped to 33.5% from 33.9%. Diluted EPS of $2.19 rose 76.6%, helped by diluted shares falling 1.1% to 1.256 billion, the lowest of the last 16 quarters.
Why: The effective tax rate jumped to 16.9% from 10.9% in June. The 10-Q attributes that to a higher NCTI tax rate, a shift in income across jurisdictions, and expense from a change in U.S. tax law; GeminIQ's pre-calculated Effective Tax Rate tracks the same jump. Had the rate held at June's 10.9%, diluted EPS would have been about $2.35 instead of $2.19. Year over year, revenue growth and a 5.6-point margin gain carried the 76.6% EPS rise. Operations set a 16-quarter high in margin; tax is the reason net margin still fell.
What Lam Research's 10-Q Shows Beyond the Press Release: Q1 FY2027 Operating Cash Flow
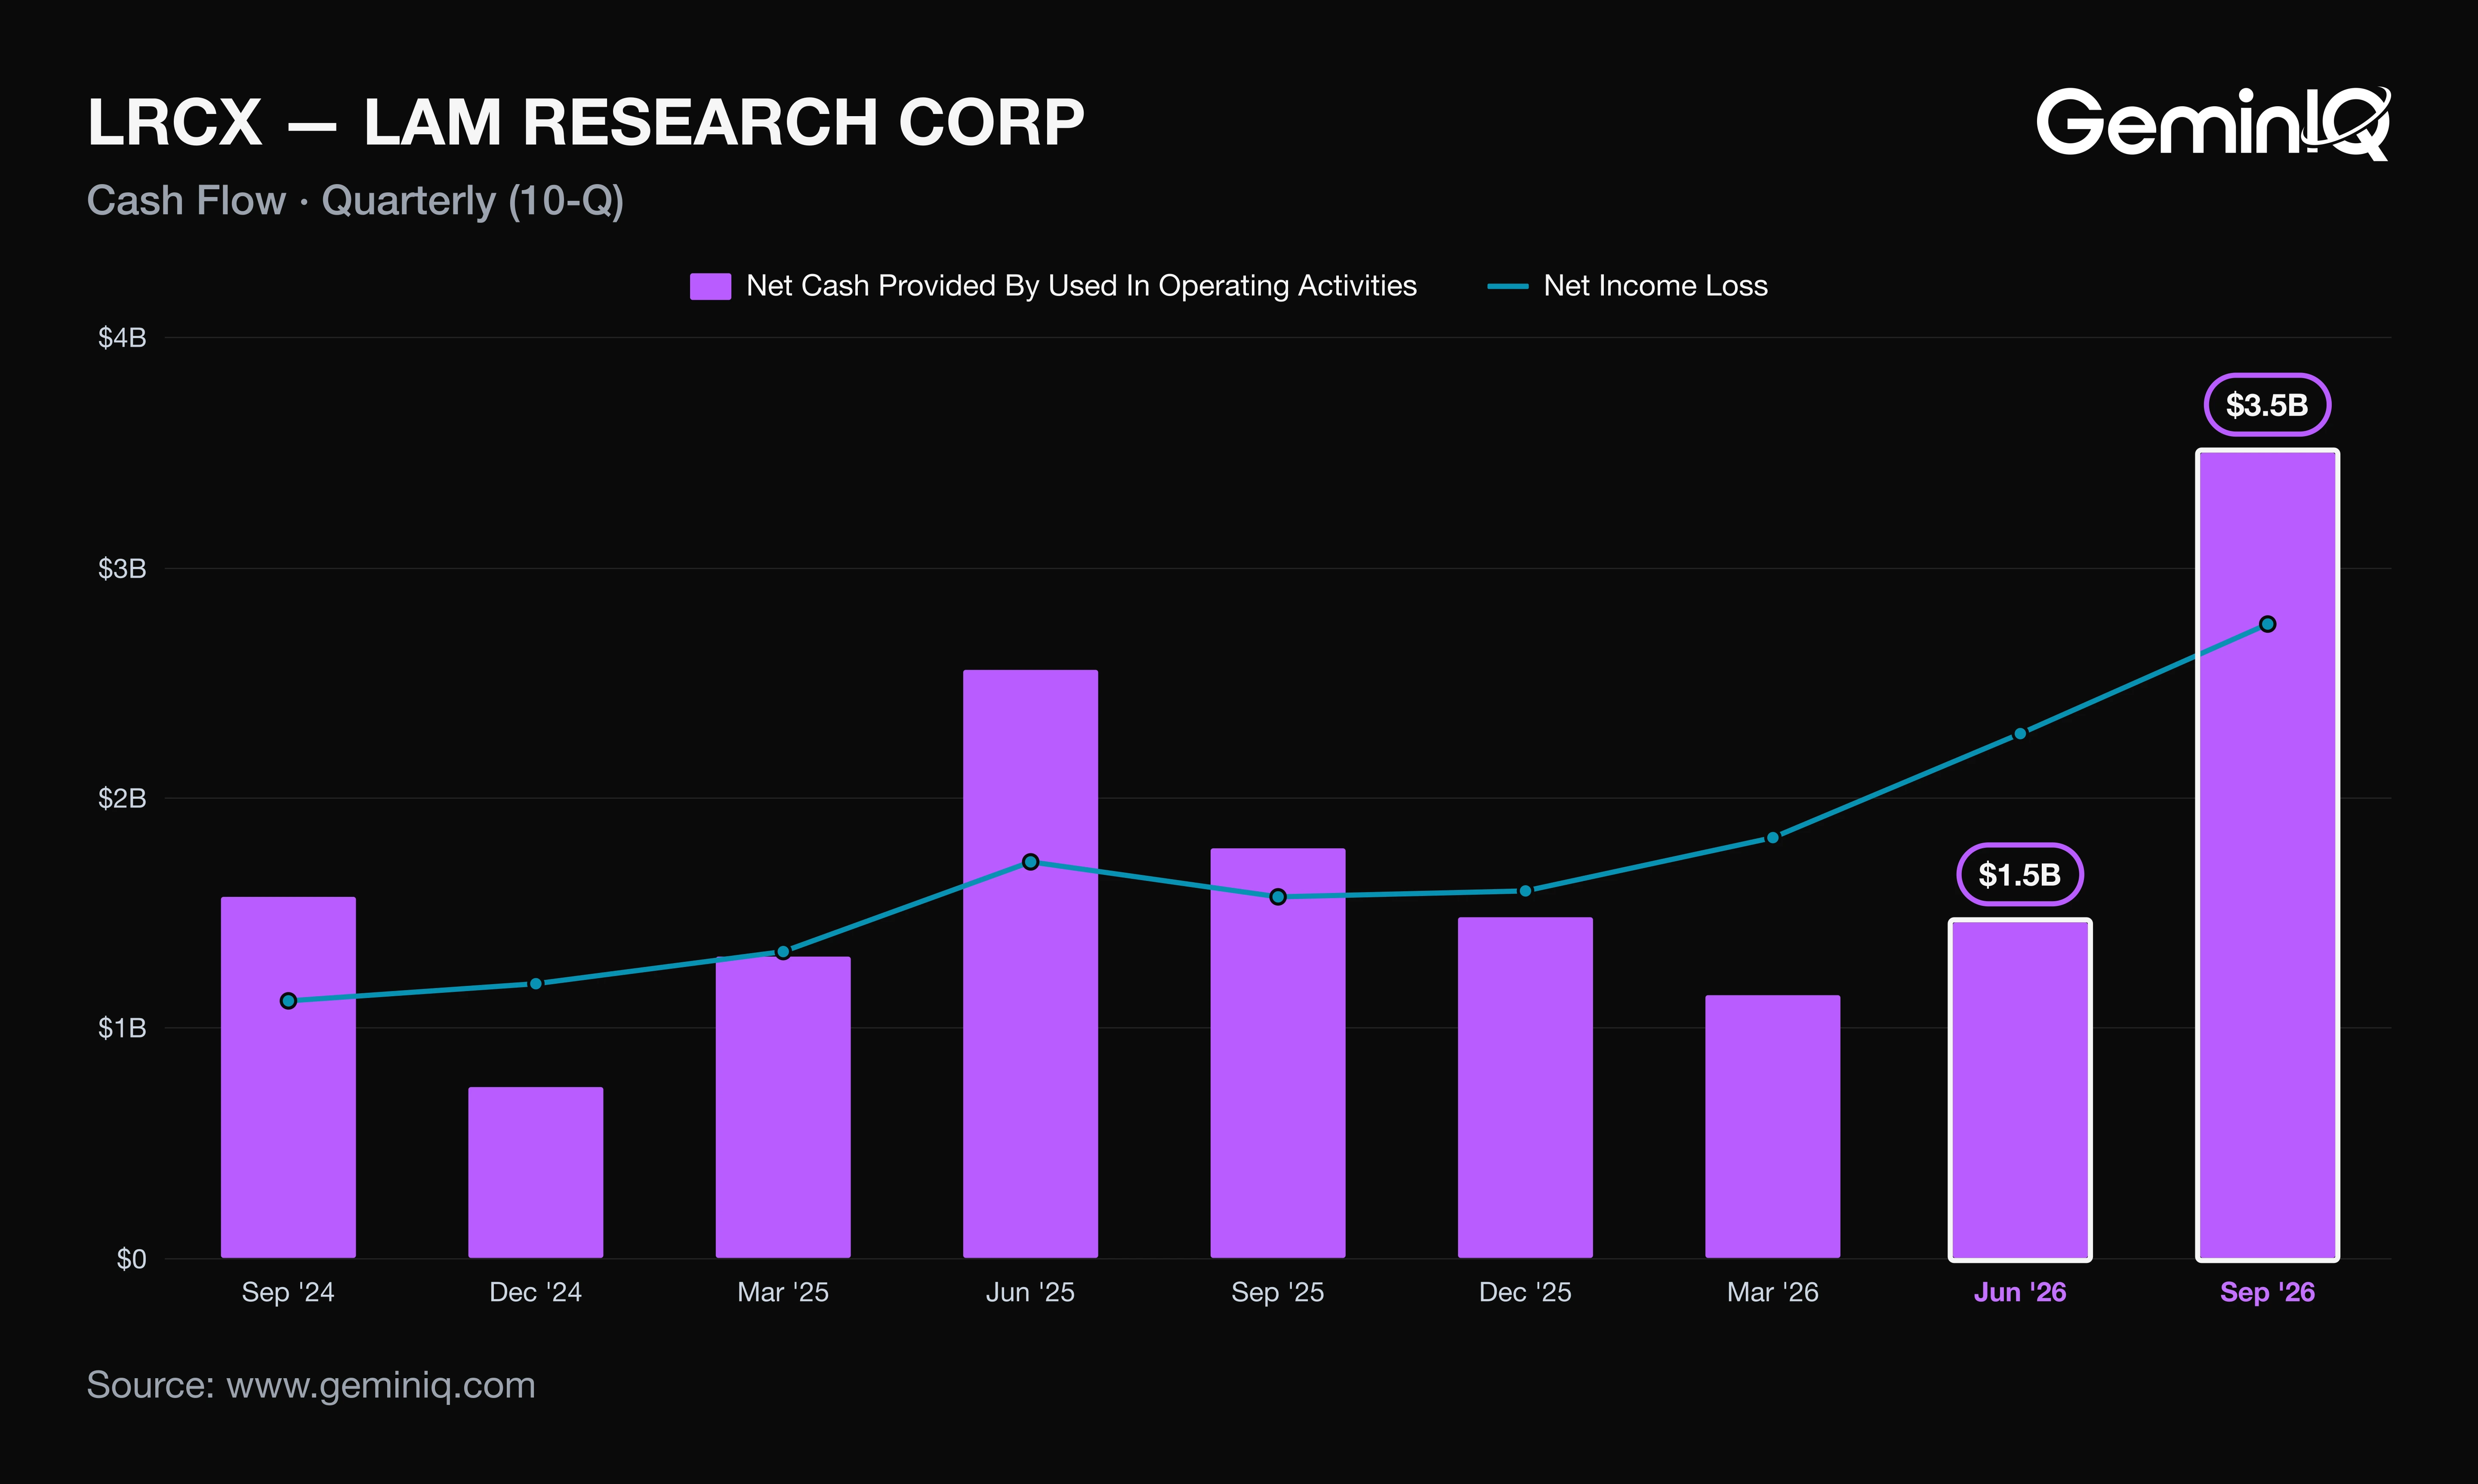
Lam Research generated $3.50 billion of operating cash flow in Q1 FY2027, up 96.6% year over year and the highest of the last 16 quarters. The release led with record revenue, profit and EPS and credited the $7.45 billion cash balance to operating cash flow; the 10-Q's cash flow discussion shows what that cash flow was made of.
The Data: Operating cash flow equaled 127% of net income, against 64% in the June quarter ($1.46 billion on $2.28 billion). Changes in operating assets and liabilities added $535.4 million, versus $76.2 million a year earlier. Accrued expenses and other liabilities supplied $832.7 million of that, while receivables absorbed $342.1 million and inventory $311.3 million. Free cash flow was $3.24 billion, the highest of the last 16 quarters.
Why: A record-profit quarter would be expected to produce record cash, and it did, but the transmission channel is liabilities rather than collections. The 10-Q does not break out the $832.7 million, yet income tax expense of $559.1 million was double June's $277.9 million, and operating expenses carried higher incentive compensation; both sit in accrued liabilities until paid. Receivables are not the culprit: they rose 55.8% year over year against revenue's 54.4%, and only 6.0% from June. Over June and September together, operating cash flow of about $4.96 billion matched net income of $5.03 billion almost exactly.
Lam Research Q1 FY2027 Buybacks, Dividends and Share Count
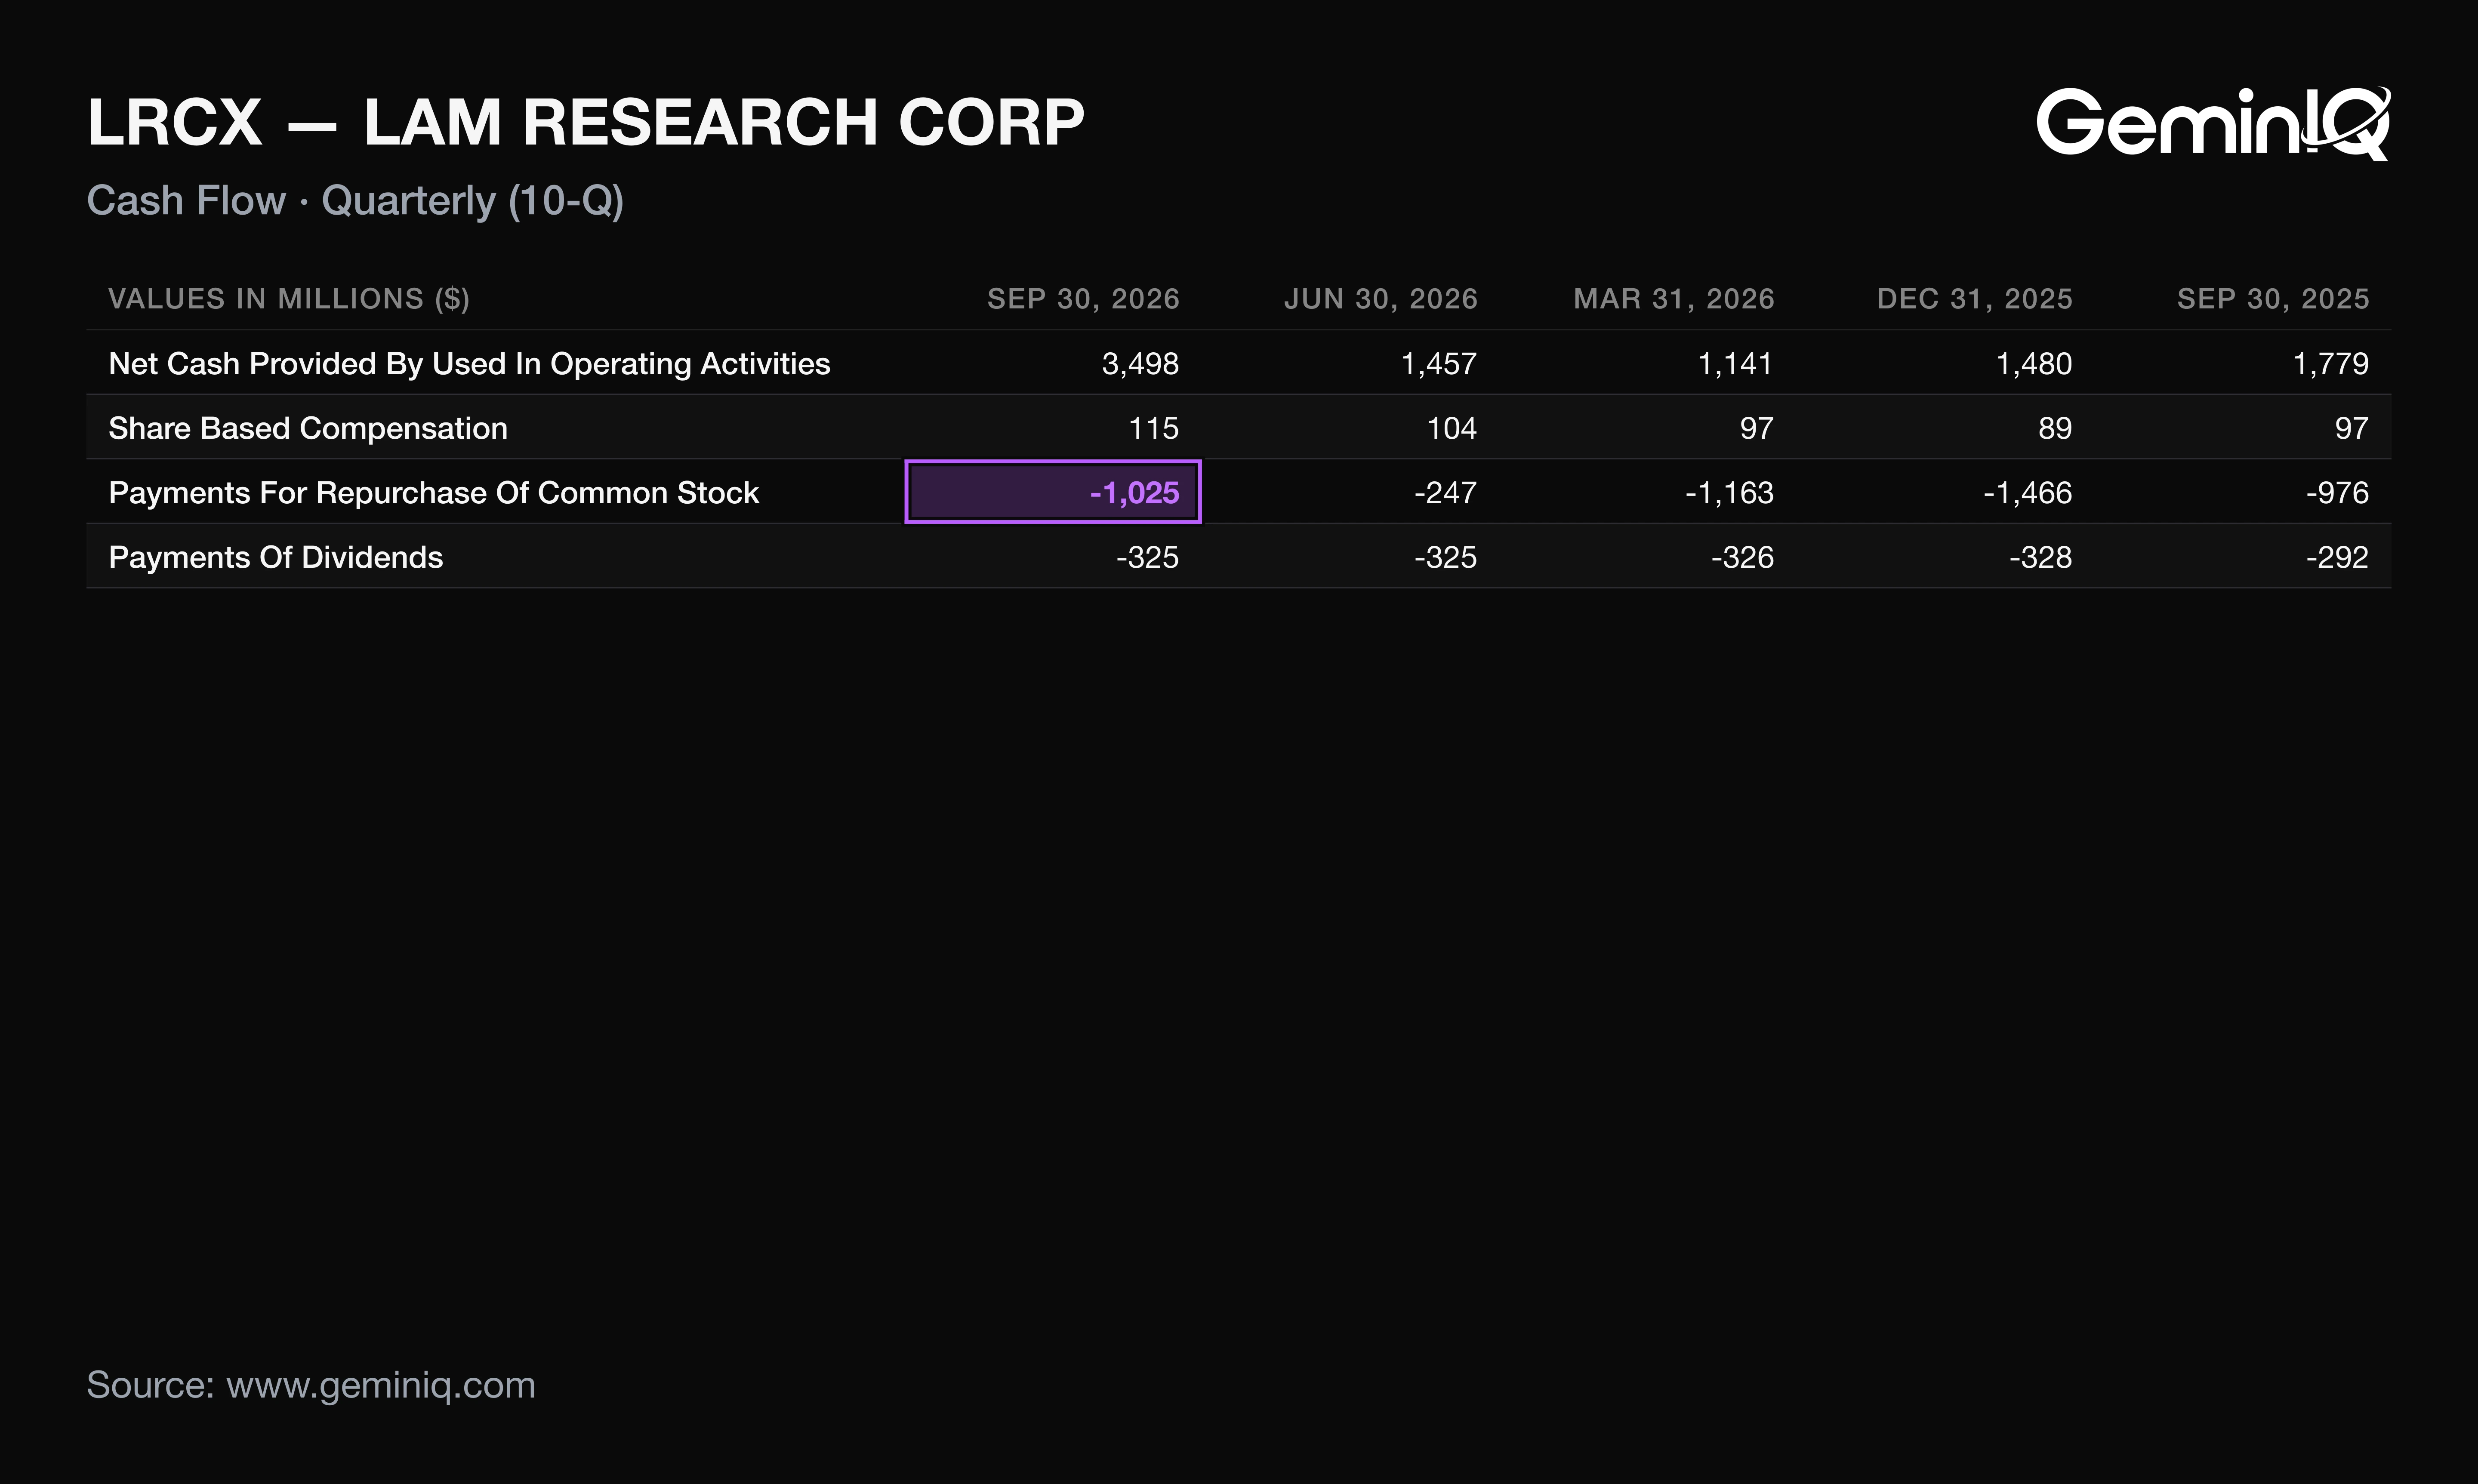
Lam Research spent about $1.02 billion on share repurchases in Q1 FY2027, including $1.00 billion of accelerated repurchase agreements, yet diluted shares fell only 0.4% from June. A buyback that size should shrink the count visibly; this one has not finished.
The Data: The 10-Q reports 2.34 million shares repurchased at an average $329.17, excluding the accelerated agreements, and $3.03 billion left on the authorization. Equity-based compensation expense was $114.7 million, so repurchases ran roughly nine times stock compensation. Dividends paid were $325.4 million, flat with June, even though the declared dividend rose to $0.33 per share from $0.26.
Why: The accelerated agreements delivered an initial 2.3 million shares, 75% of the prepayment divided by the closing price on the execution date; the rest settles by the quarter ending December 27, 2026. The company's guided diluted share count of 1.253 billion implies a further 0.2% decline. Buybacks plus dividends took about 42% of free cash flow, so the count is falling because of buybacks, not merely offsetting dilution.
Lam Research's December 2026 Quarter Guidance After Q1 FY2027
In its October 21, 2026 8-K, Lam Research guided December-quarter revenue of $8.60 billion, plus or minus $400 million, and GAAP EPS of $2.33, plus or minus $0.15. The low end of that revenue range, $8.20 billion, sits almost exactly on September's $8.22 billion.
The Data: The company had guided September revenue of $8.10 billion plus or minus $400 million; the reported $8.22 billion landed $120 million above that midpoint, inside the range. GAAP EPS of $2.19 compared with a guided $2.15, operating margin of 40.0% with 39.5%, and gross margin of 52.3% with 52.0%. The new midpoint implies 4.6% sequential growth against 22.3% in the quarter just reported, and EPS growth of 6.4% to $2.33. Guided operating margin is 40.5%.
Why: Customer support-related revenue was flat at $2.49 billion, so September's step came from systems revenue, up 35% sequentially. China supplied 35% of revenue against 26% in June, and the 10-Q ties the foundry share to the timing of mature-node investments there.
How LRCX Stock Has Moved After Past Earnings Reports, Plus Insider and Institutional Record
Across Lam Research's last 12 10-Q filings with a completed one-month window (filed October 2023 to August 2026), the median one-month return was +2.7%, positive after 7 of 12. The three-month median was +8.0%, positive after 8 of 11. These figures describe how Lam Research stock moved after its past filings; they are a historical association, not a forecast, and this filing's window has not yet elapsed.
The Data: One-month returns ranged from -3.7% to +18.2%. Past first-quarter filings were followed by +16.8% (FY2024), -3.7% (FY2025) and -2.3% (FY2026) in the first month, and by +27.1%, +6.8% and +44.2% over three months. The Earnings Reaction Heat Map shows every cell. The latest 13F quarter end, June 30, 2026, shows institutions holding 82.29%, up 3.79 points in a year and the highest of the last 16 quarters.
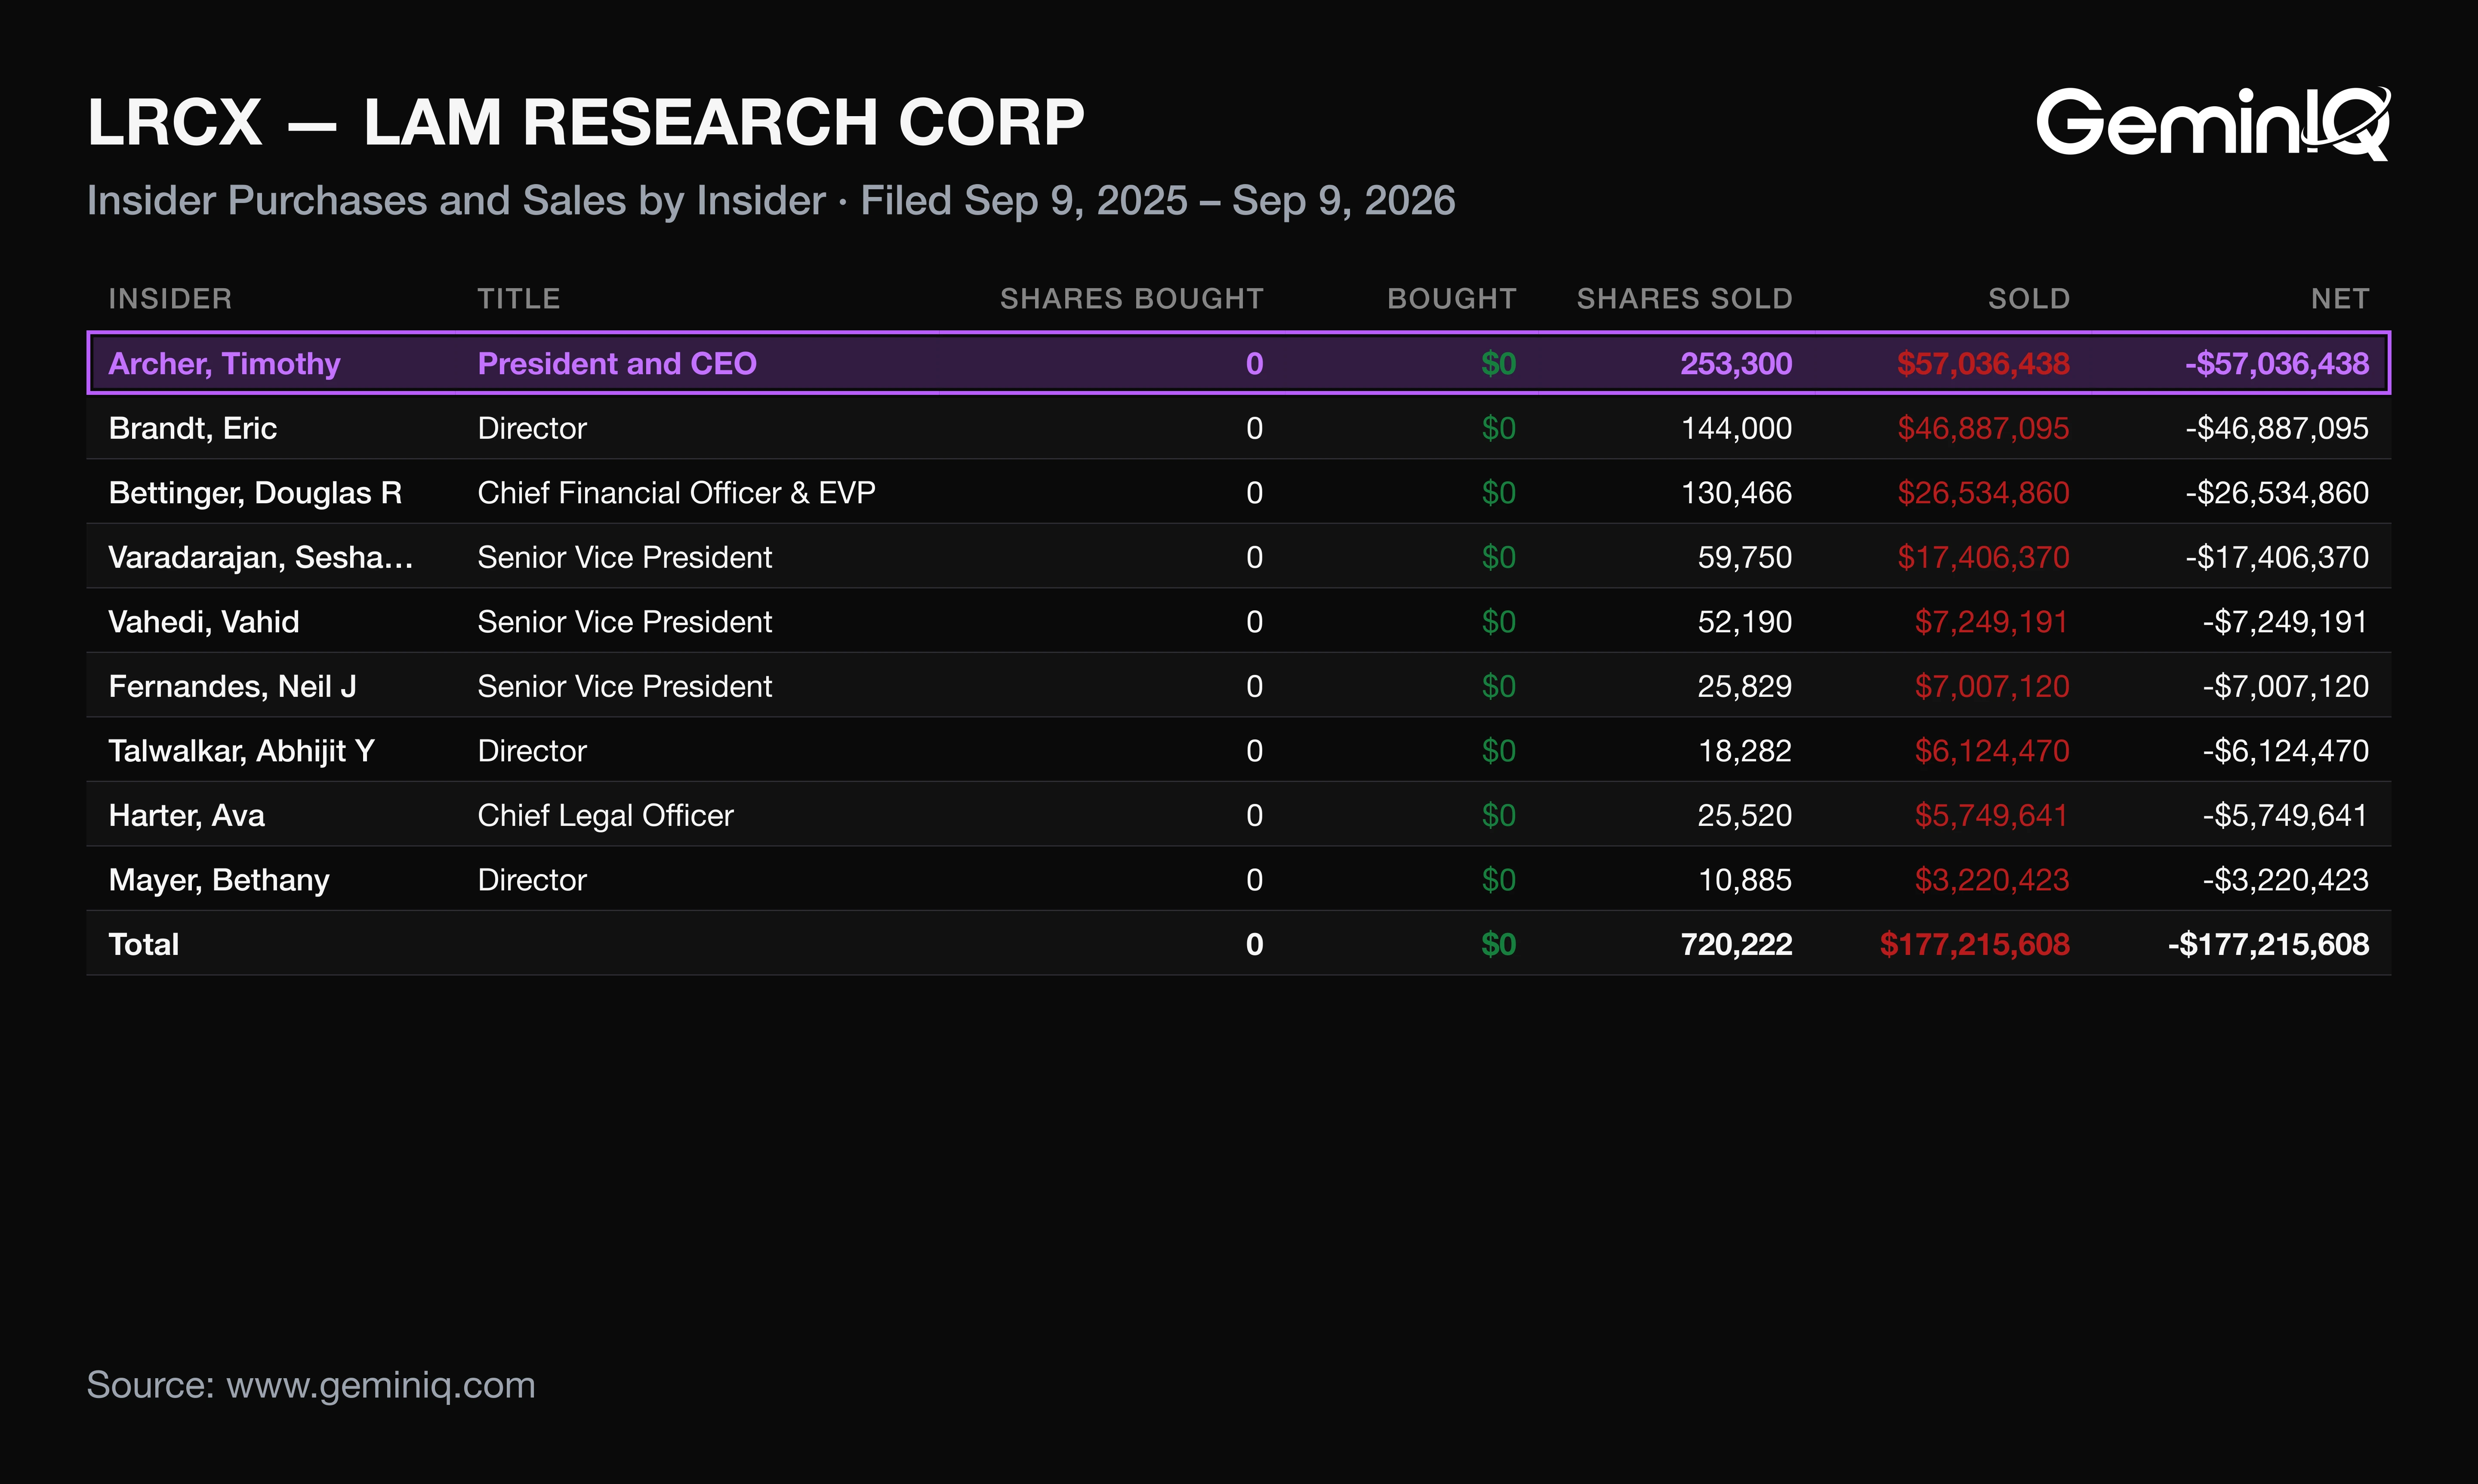
Why: Form 4 data filed from September 9, 2025 through September 9, 2026 shows 23 sales totaling $177.2 million and no purchases, against 3 sales totaling $10.6 million in the prior 12 months. Selling was concentrated: Timothy Archer sold $57.0 million, and the top three sellers account for 73%. The file does not say which sales followed scheduled plans, so it cannot separate routine selling from discretionary.
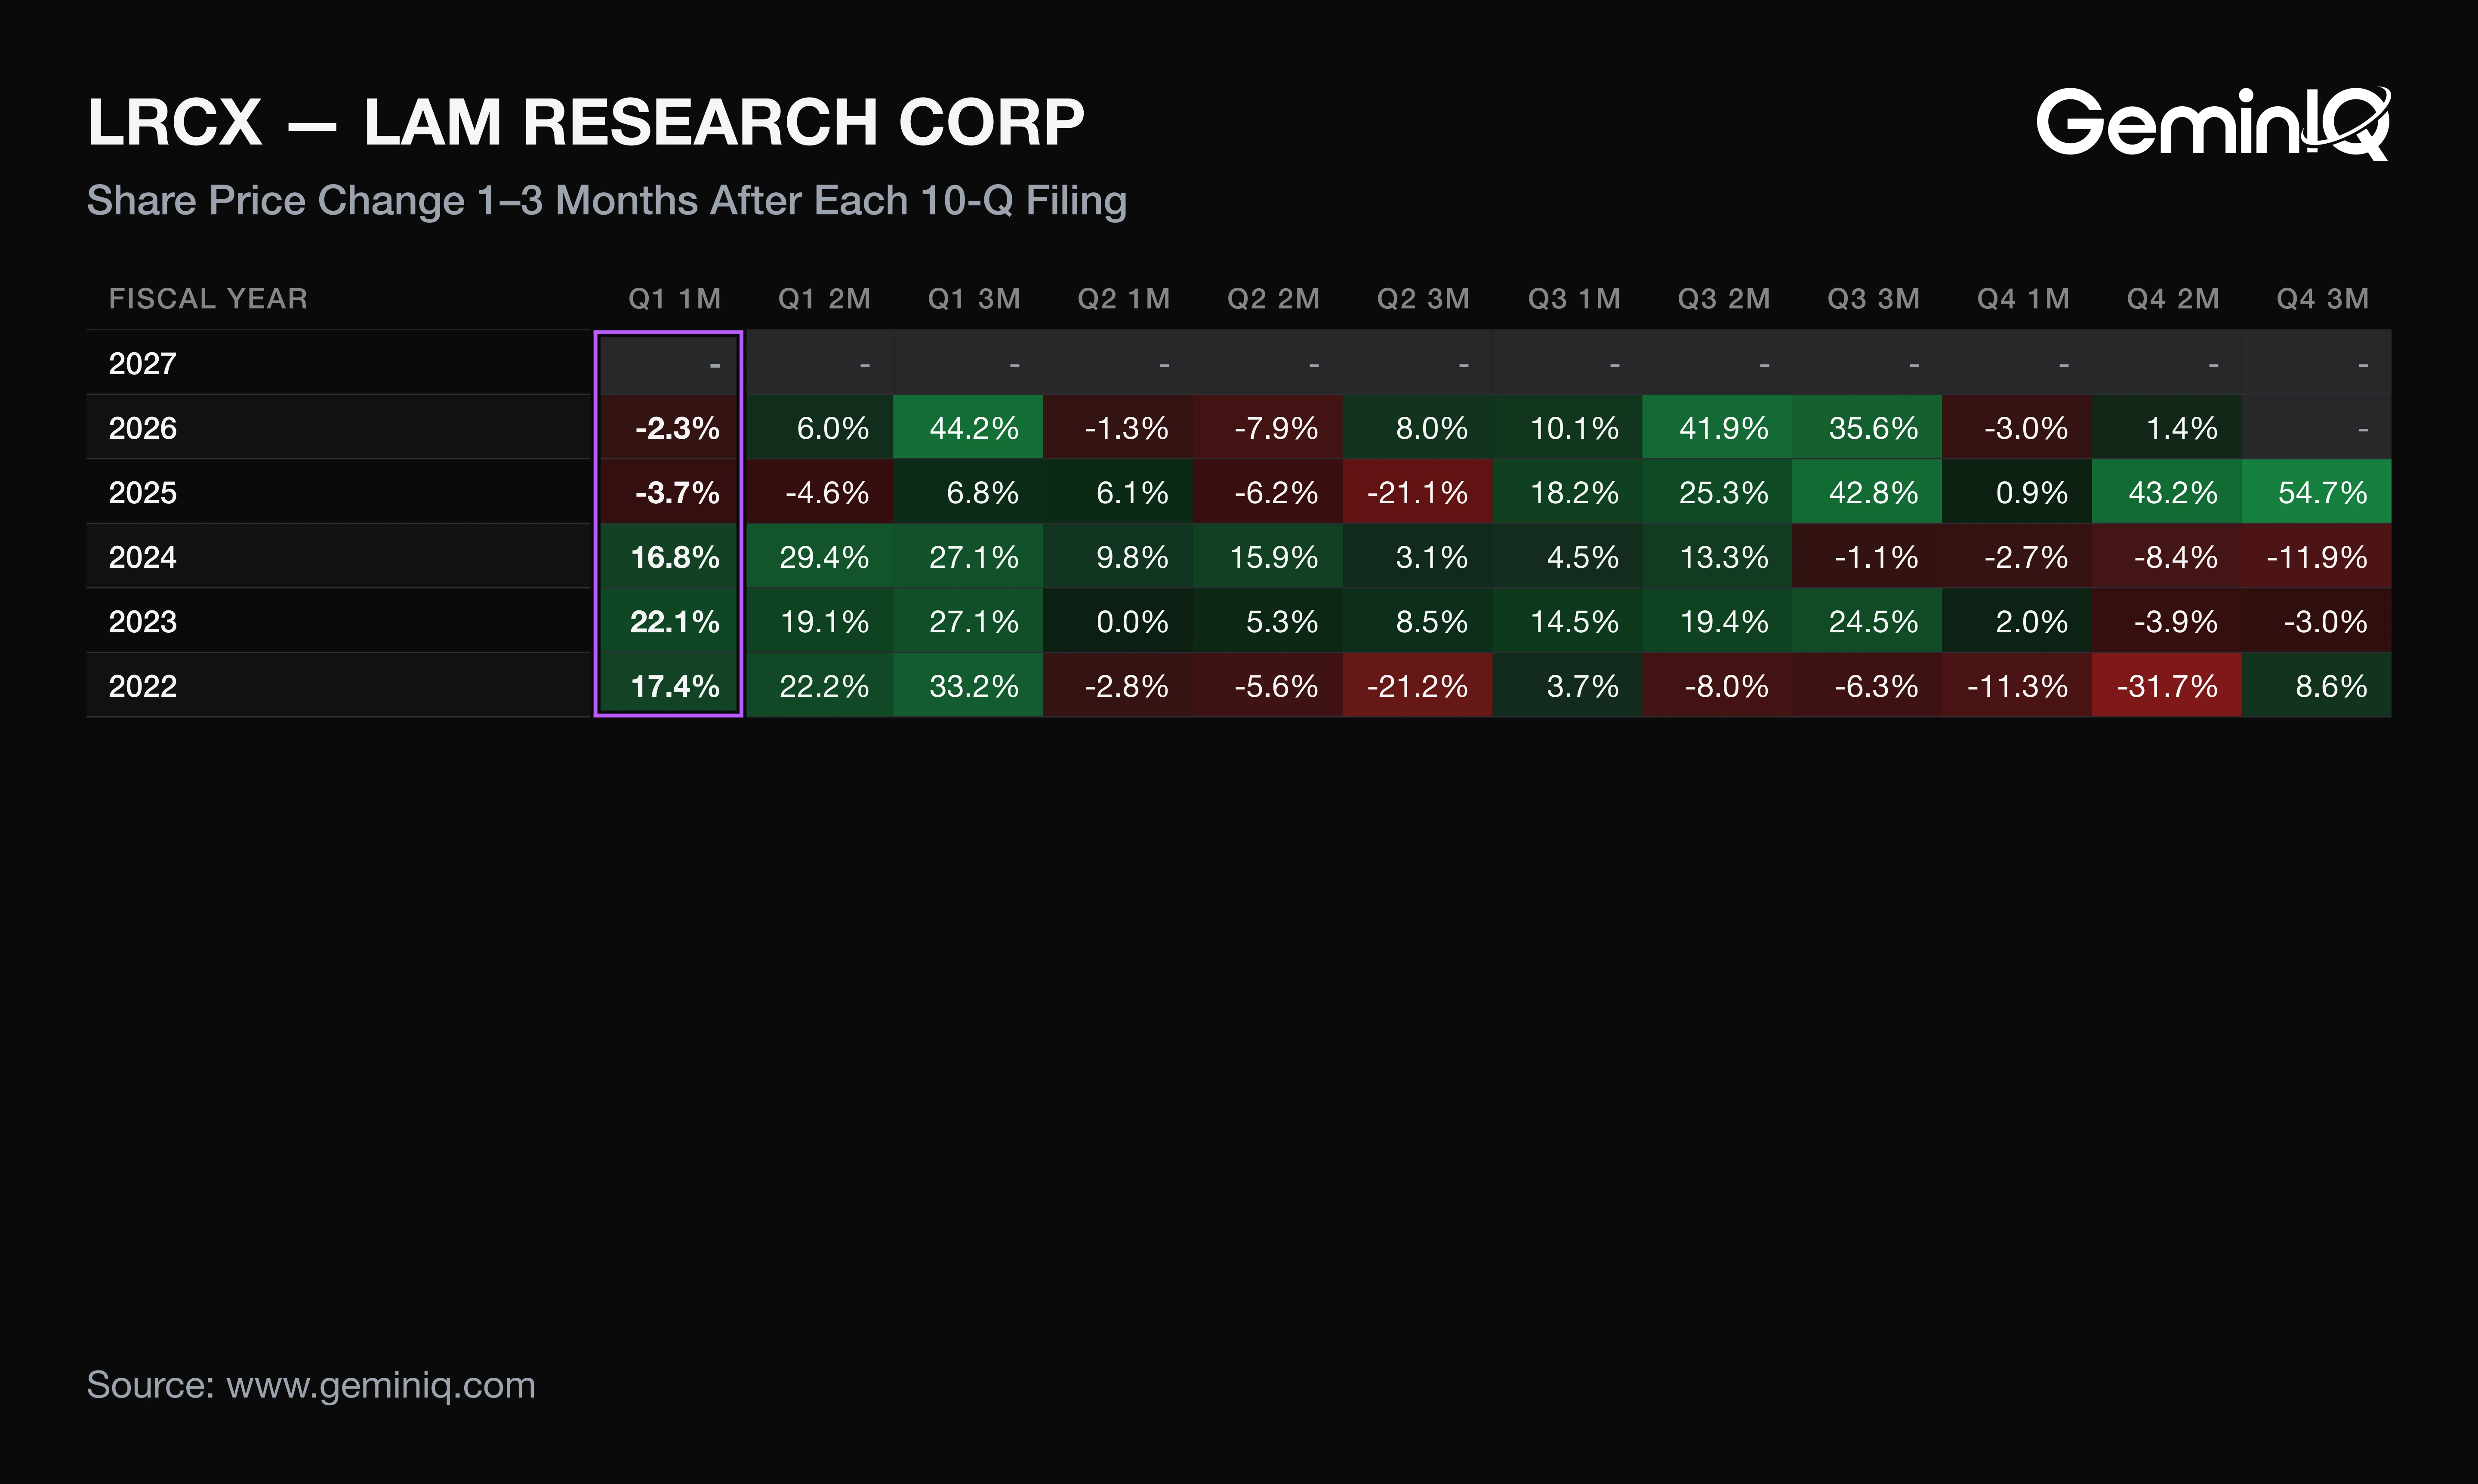
A median return drawn from a dozen filings describes the middle of a very wide range, so the spread matters more than the center.
Frequently Asked Questions
When does Lam Research report earnings?
Lam Research reported its September 2026 quarter on October 21, 2026 and filed the 10-Q on October 22. Last year the next quarter, FY2026 Q2, was filed on January 29, 2026. That is a pattern from the filing record, not a forecast of the next date.
Does Lam Research pay a dividend?
Yes. Lam Research paid $325.4 million in dividends in Q1 FY2027 and $1.30 billion over the trailing twelve months, up 10.5%.
Is Lam Research doing well financially?
Lam Research's trailing operating margin was 36.95%, against 33.00% a year earlier, and its net profit margin was 32.34%. GeminIQ's pre-calculated Return on Invested Capital (ROIC) was 88.05%, and net debt to EBITDA was -0.37x, meaning cash exceeds debt.
Where can I verify Lam Research's Q1 FY2027 figures?
The figures come from the Form 10-Q filed October 22, 2026 and the Form 8-K earnings release of October 21, 2026. Guidance figures appear only in the 8-K.
Wall Street's data. Main Street's price.
Institutional terminals charge thousands a year for as-filed accuracy. GeminIQ gives you the same thing for a fraction of the cost: financials built directly from raw SEC EDGAR filings, not third-party APIs, with full XBRL traceability back to the original 10-K or 10-Q. No normalized guesswork, just calculated metrics, charts, screeners, and watchlists built on numbers exactly as the company reported them. Start researching now at GeminIQ.com.
All financial figures cited in this article reference LAM RESEARCH CORPORATION's Q1 FY2027 10-Q (filed October 22, 2026, period ending September 30, 2026), with guidance and management commentary drawn from the company's Form 8-K earnings release (filed October 21, 2026). All SEC filings are publicly available at SEC EDGAR and SEC EDGAR.
Disclaimer: The content in this blog is for educational and entertainment purposes only and does not constitute financial, legal, or tax advice. Investing involves risk, including the loss of principal. The views expressed are my own and not intended as financial advice or a guarantee of future performance.