Mercury Systems (MRCY) Q1 FY2027 Earnings: EPS $0.21, Cash Flow -$14M

By Chad Hartman
Published · Last updated
Mercury Systems (MRCY) filed its Q1 FY2027 10-Q on November 10, 2026, the same day as its earnings release, showing revenue of $253.2 million, up 12.4%, and diluted EPS of $0.21 against a $0.21 loss a year earlier, for the quarter ended October 2, 2026. The same filing shows operating cash flow of negative $14.0 million, the fourth-lowest of the last 16 quarters, and free cash flow of negative $24.4 million. The release led with record bookings, record backlog and adjusted EBITDA of $56.4 million; the cash flow statement tells a different story about how much of that profit has been collected.
| Field | Value |
|---|---|
| Company | Mercury Systems ($MRCY) |
| Quarter | Q1 FY2027, period ended October 2, 2026 |
| Earnings release | November 10, 2026 (Form 8-K) |
| 10-Q filed | November 10, 2026 |
| Revenue | $253.15 Million (+12.4% YoY) |
| Diluted EPS | $0.21 (vs a $0.21 loss a year earlier) |
| Operating margin | 7.3% (+11.1 pts YoY) |
| Operating cash flow (TTM) | $86.24 Million |
| Free cash flow (Q1, OCF less capex) | -$24.4 Million (third-lowest of the last 16 quarters) |
Mercury Systems Q1 FY2027 Revenue, EPS and Margins
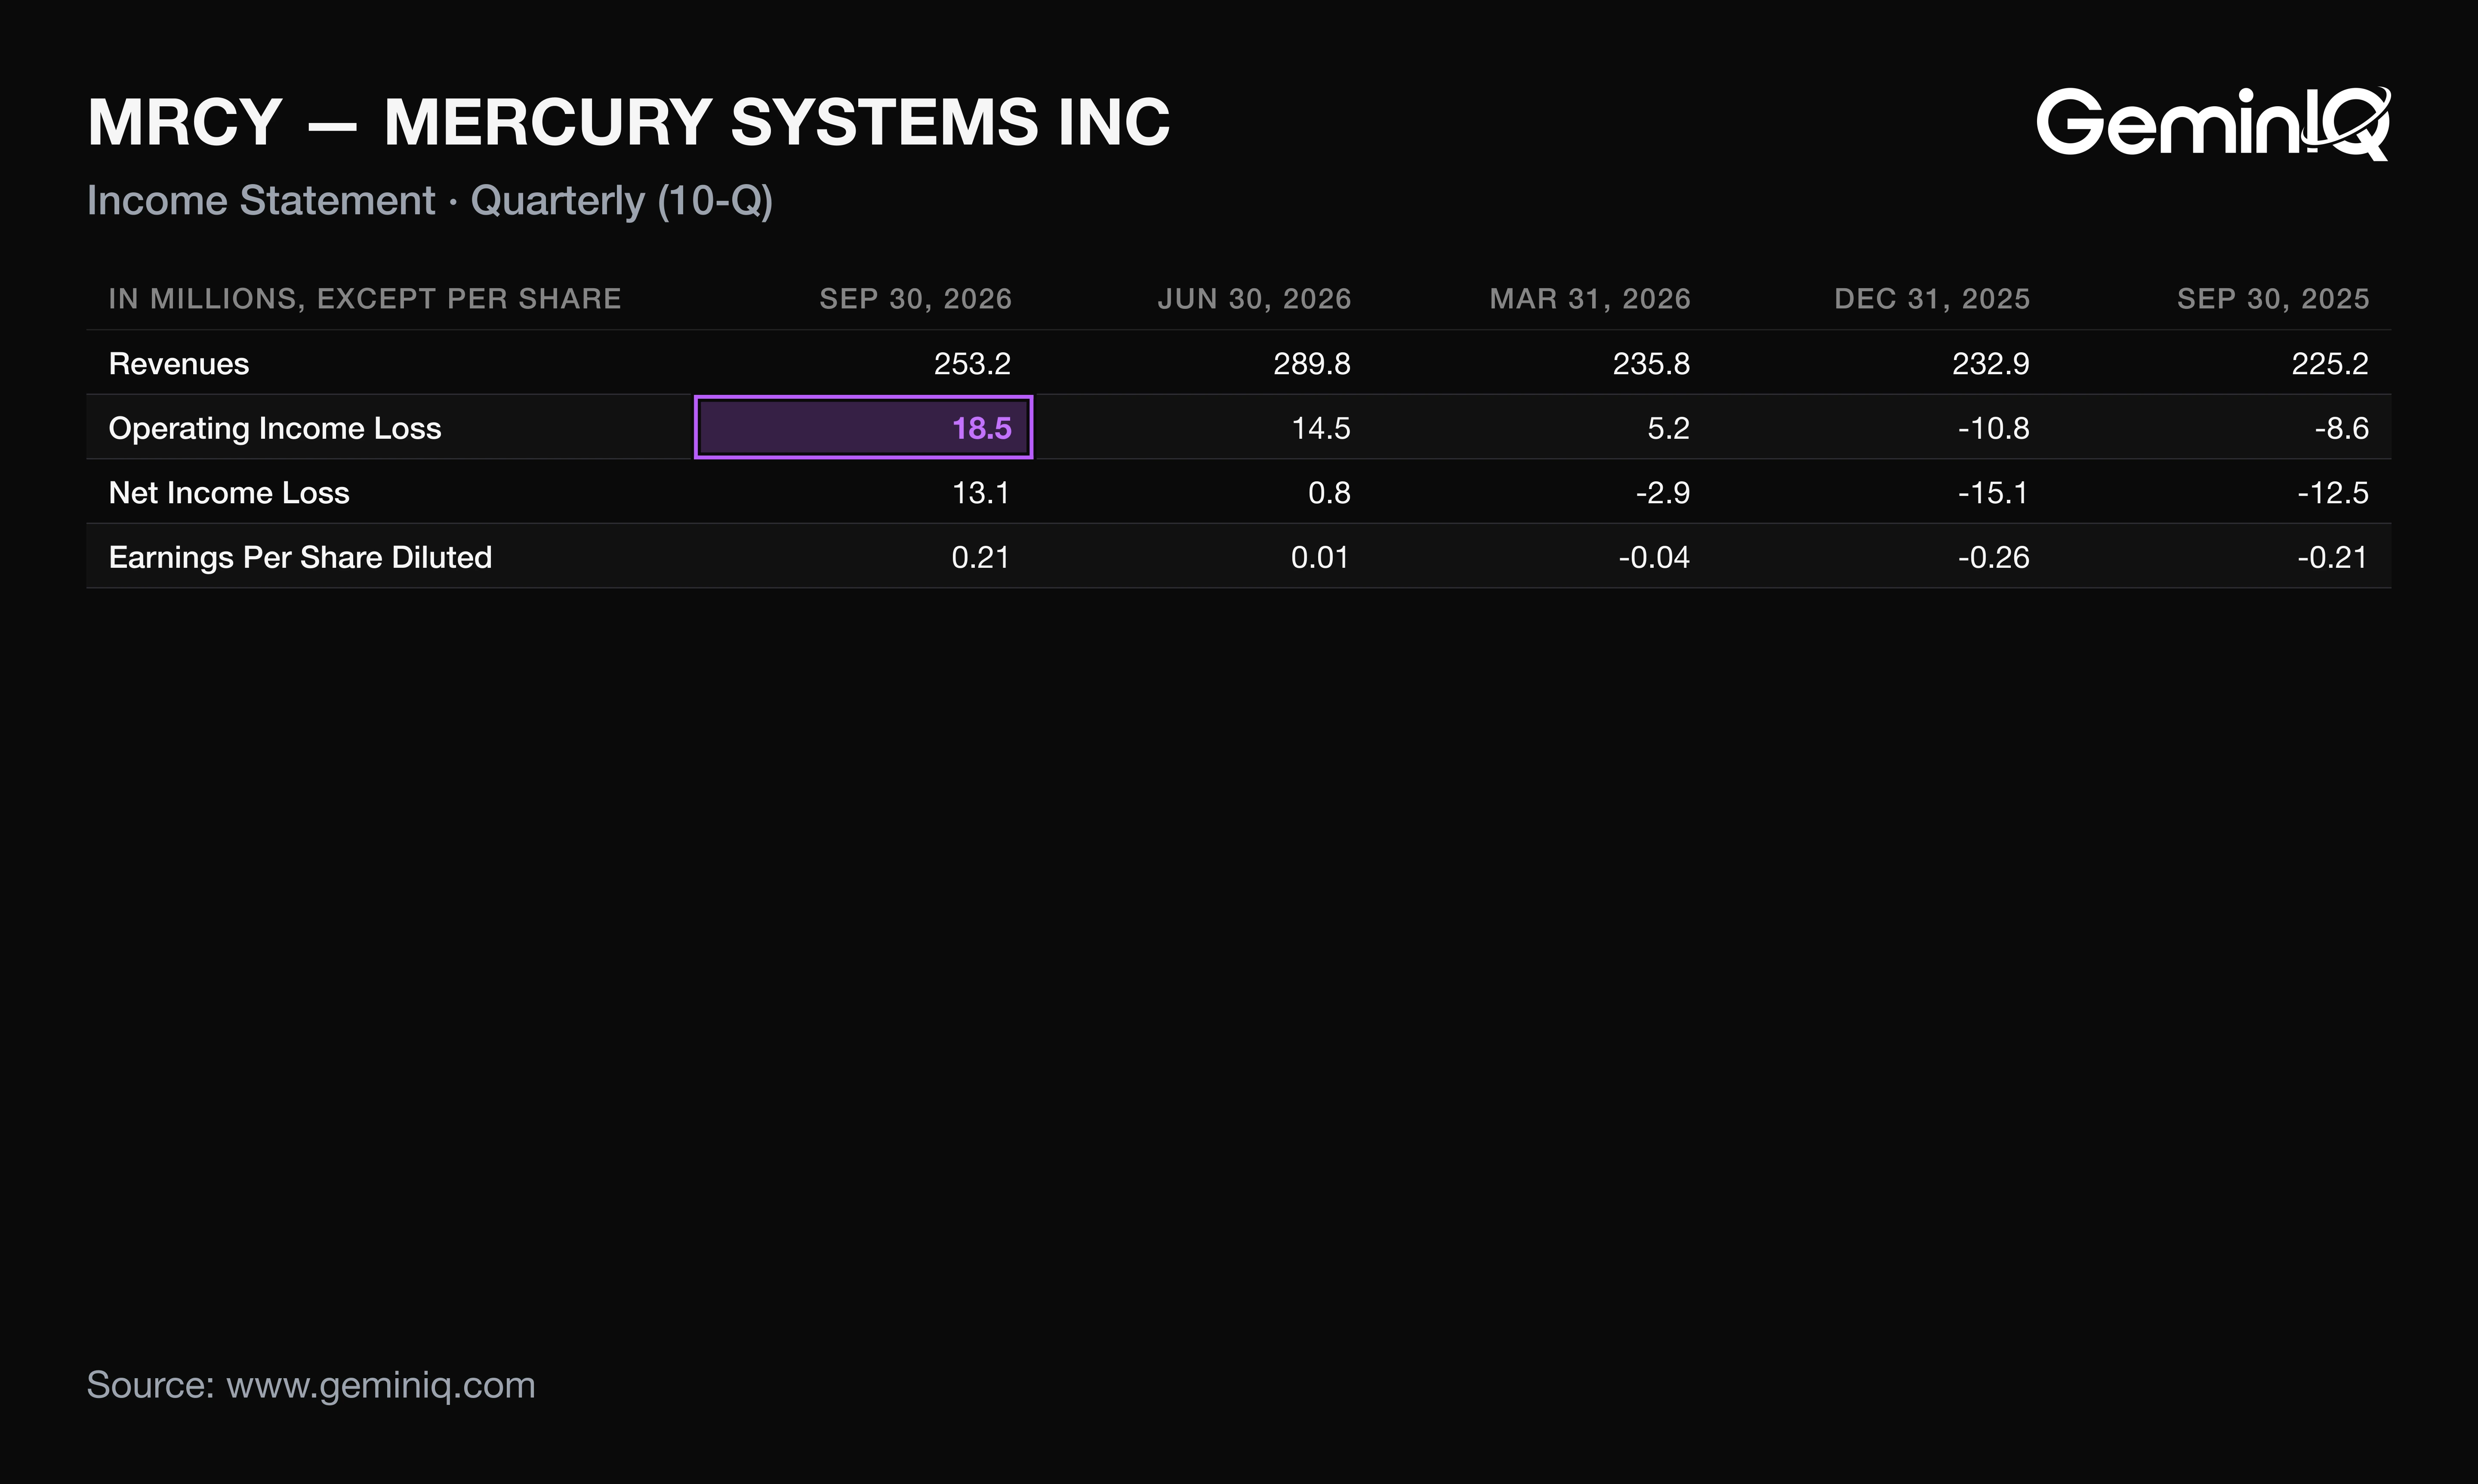
Mercury Systems' Q1 FY2027 revenue was $253.2 million, up 12.4% from $225.2 million and down 12.6% from the prior quarter's $289.8 million; it ranks fifth-highest of the last 16 quarters. Revenue growth alone does not explain the profit swing; gross margin and a tax item do.
The Data: Operating income went from a loss of $8.6 million to a profit of $18.5 million, the second-highest of the last 16 quarters. Gross margin was 35.2% against 27.9% a year earlier, a 7.3-point gain and also the second-highest of the last 16 quarters. Gross profit rose $26.3 million on $27.9 million of added revenue, so nearly every new revenue dollar reached gross profit. SG&A fell $2.9 million, with litigation and settlement expense $6.1 million lower.
Why: The 10-Q credits program mix, $5.4 million lower inventory reserves and a net unfavorable estimate-at-completion change of $3.1 million, down from $4.1 million. Reserves and estimates together explain about $6.4 million of the $26.3 million gross profit gain; the filing does not quantify the mix share. Below the operating line, Mercury booked a tax provision of $0.2 million on $13.3 million of pretax income, a 1.7% rate, after recognizing a $5.4 million stock-compensation windfall benefit. Without that benefit, tax would have been about $5.6 million and diluted EPS roughly $0.12 (derived), so the windfall equals 41% of net income. Diluted shares reached 61.62 million, up 4.1% and the highest of the last 16 quarters, with no repurchases in the quarter.
What Mercury's 10-Q Shows Beyond the Press Release
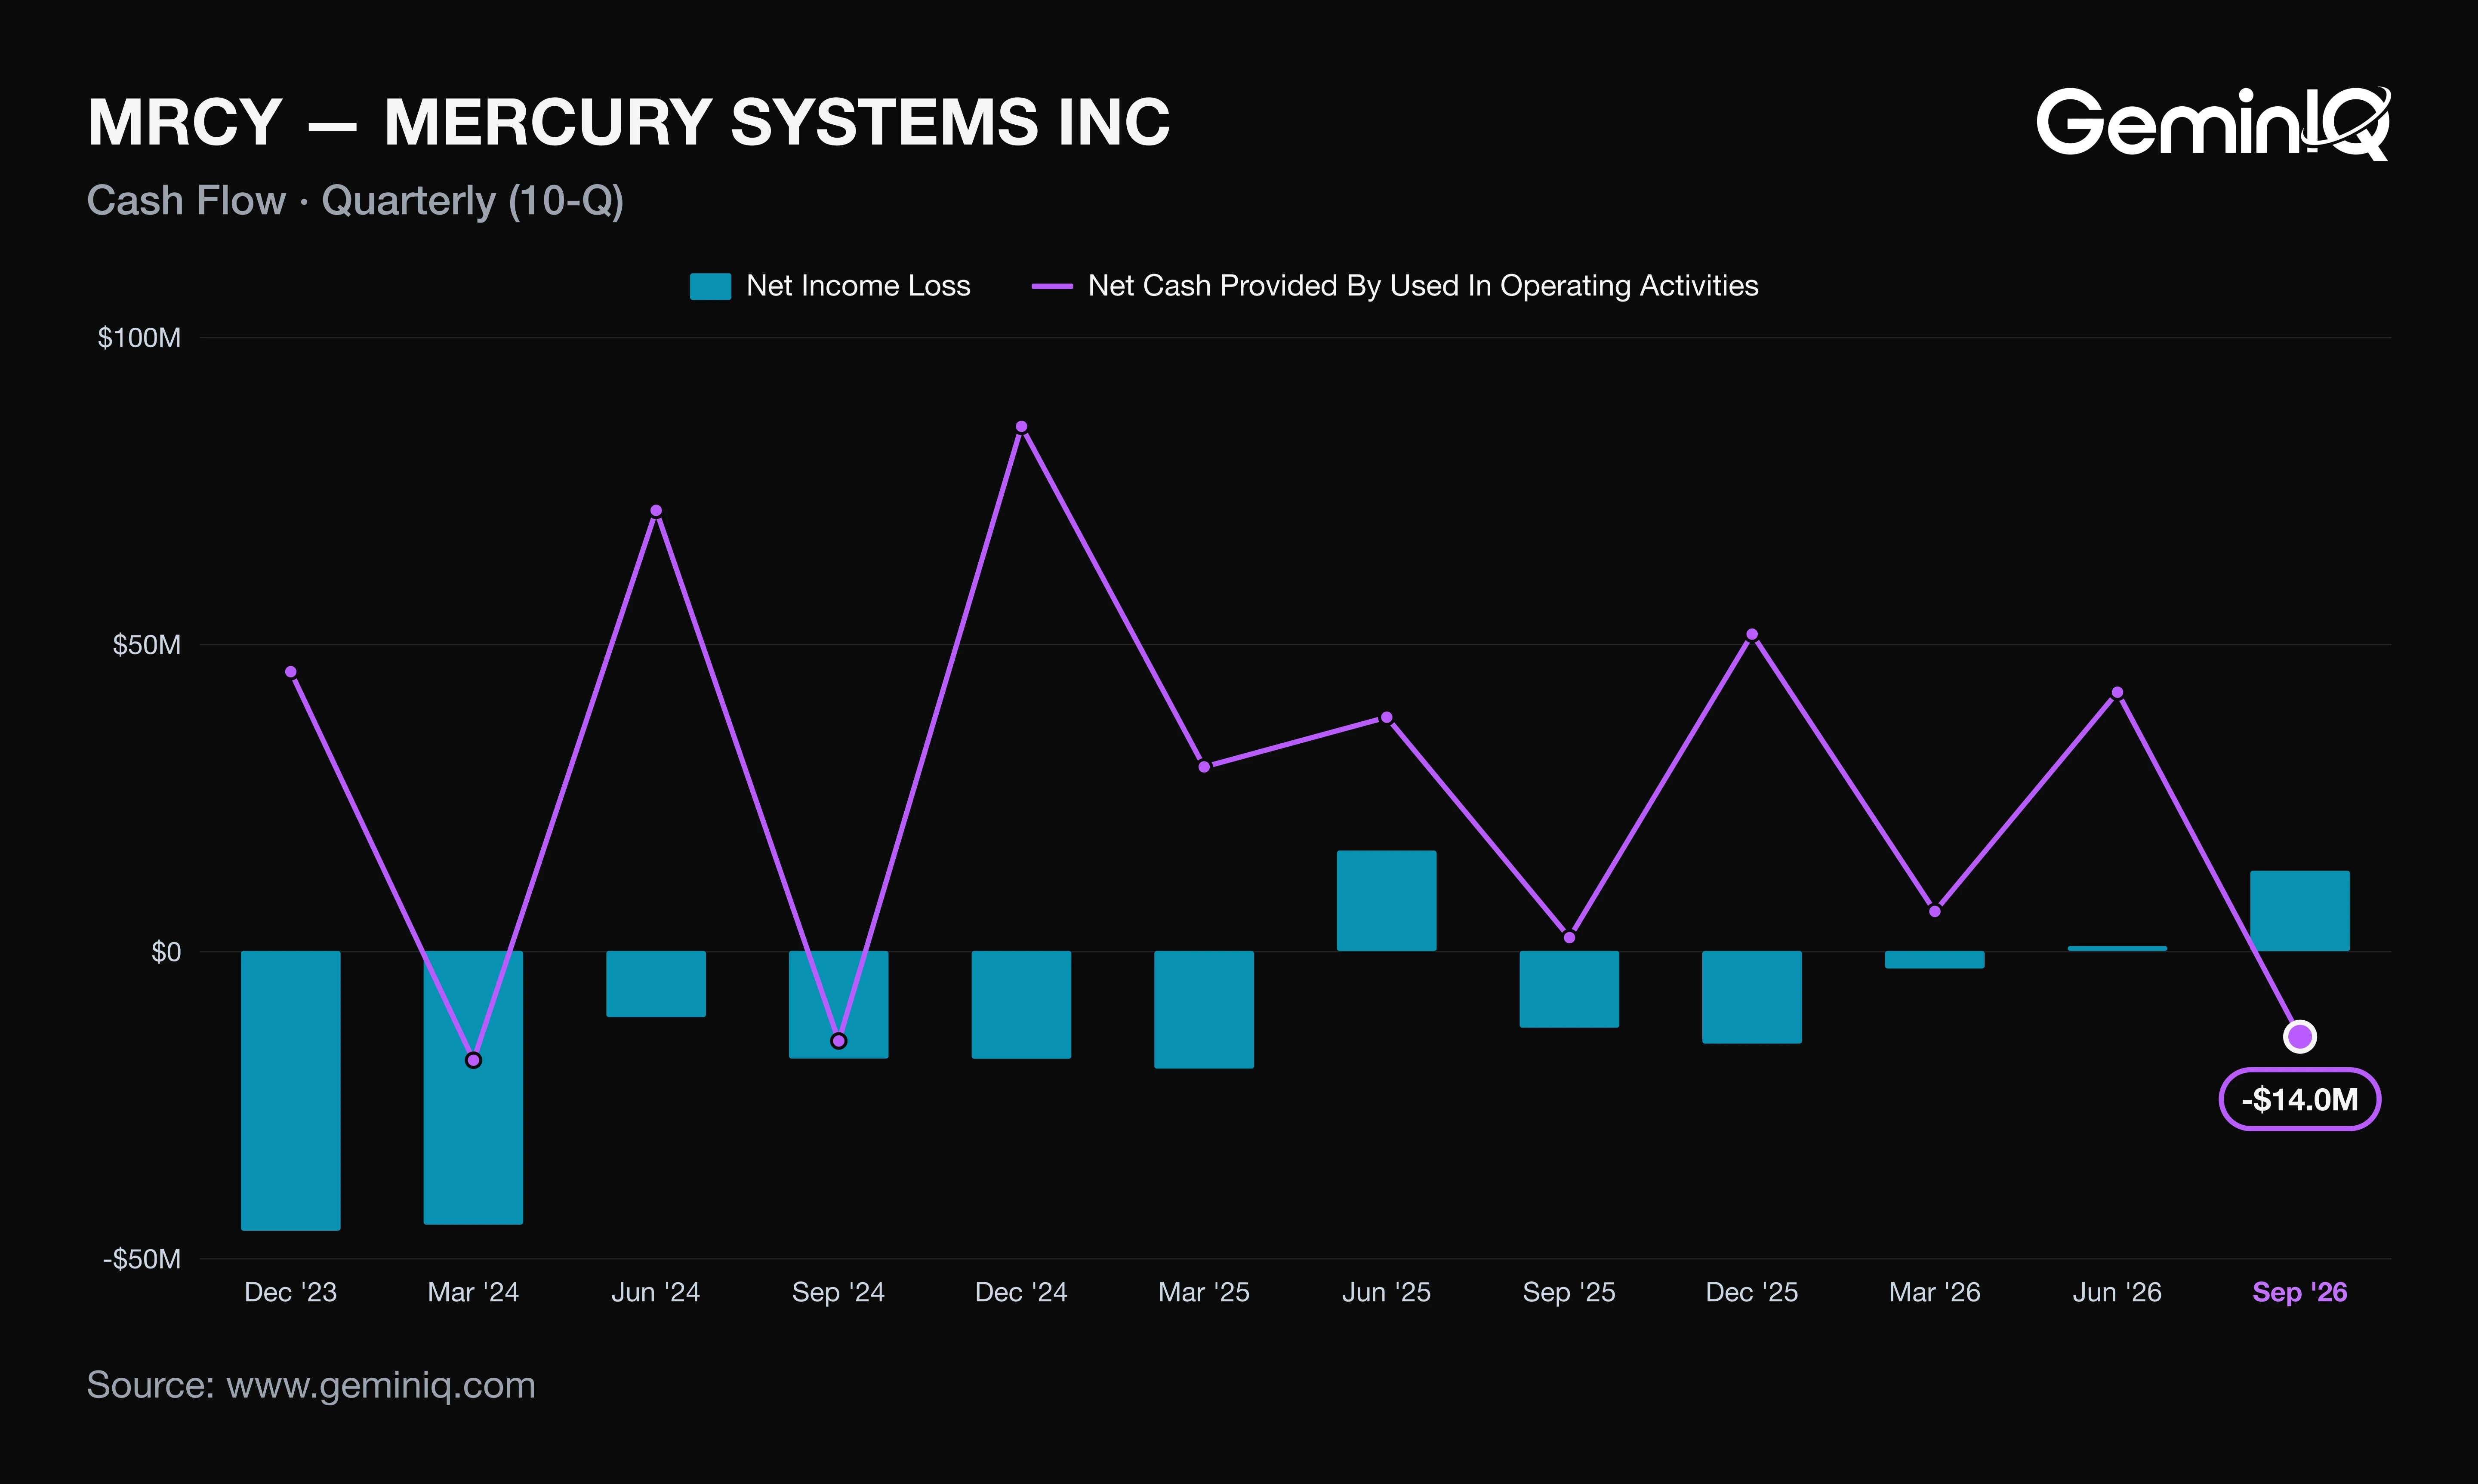
Mercury Systems' Q1 FY2027 operating cash flow was negative $14.0 million, against positive $2.2 million a year earlier and $42.2 million in Q4 FY2026. The release's headline bullets list bookings, backlog and adjusted EBITDA; the cash outflow appears only in the CEO's list of figures.
The Data: Net income of $13.1 million and operating cash flow of negative $14.0 million sit $27.1 million apart. Adjusted EBITDA of $56.4 million, as reported in the 8-K, sits $70.4 million above operating cash flow. Free cash flow was negative $24.4 million, the third-lowest of the last 16 quarters and the fifth-lowest of 61 since 2011. GeminIQ's pre-calculated Free Cash Flow for the trailing twelve months was $48.1 million, down 64.5% from $135.6 million. The 10-Q puts $17.5 million of the outflow in receivables, unbilled receivables and costs in excess of billings, against a $20.1 million inflow a year earlier, plus $10.4 million in payables, accruals and factoring against a $20.9 million inflow. Inventory drew $20.1 million more cash than a year earlier.
Why: Profit that does not convert is usually a working-capital story, and the factoring line sharpens it. Factored receivables were $98.6 million against $51.1 million a year earlier, nearly at the $100.0 million cap of the receivables purchase agreement signed June 1, 2026. Collections were already being accelerated, and operating cash flow still turned negative. The benign reading has support: bookings rose 48%, and the filing says higher purchase obligations ($359.0 million, $332.2 million due within a year) aim to secure materials for performance obligations. Inventory build ahead of revenue is that reading; the filing does not show which it is.
Mercury Systems Q1 FY2027 Debt, Cash and Capital Returns
Mercury Systems repaid $100.0 million of its revolver in Q1 FY2027, leaving $341.5 million outstanding and cash of $109.7 million, against $304.7 million a year earlier. The repayment came out of the cash balance, not out of operations.
The Data: Cash fell $104.6 million: the $100.0 million repayment, $14.0 million of operating outflow and $10.4 million of capital expenditure, offset by $19.8 million of option-exercise proceeds. The release reports net debt of $232 million, down 19% year over year. GeminIQ's pre-calculated Net Debt to EBITDA was 2.34x, against 4.42x a year earlier. Interest expense fell $2.5 million to $5.4 million on lower borrowings.
Why: Repaying debt with cash leaves net debt unchanged by construction. From the MD&A balances, net debt rose about $4.6 million during the quarter (derived). The ratio fell 47% while net debt fell 19%, so most of the improvement came from trailing EBITDA growing, not from cash generation. No shares were repurchased; $185.0 million of the $200.0 million authorization remains.
How MRCY Stock Has Moved After Past Earnings Reports
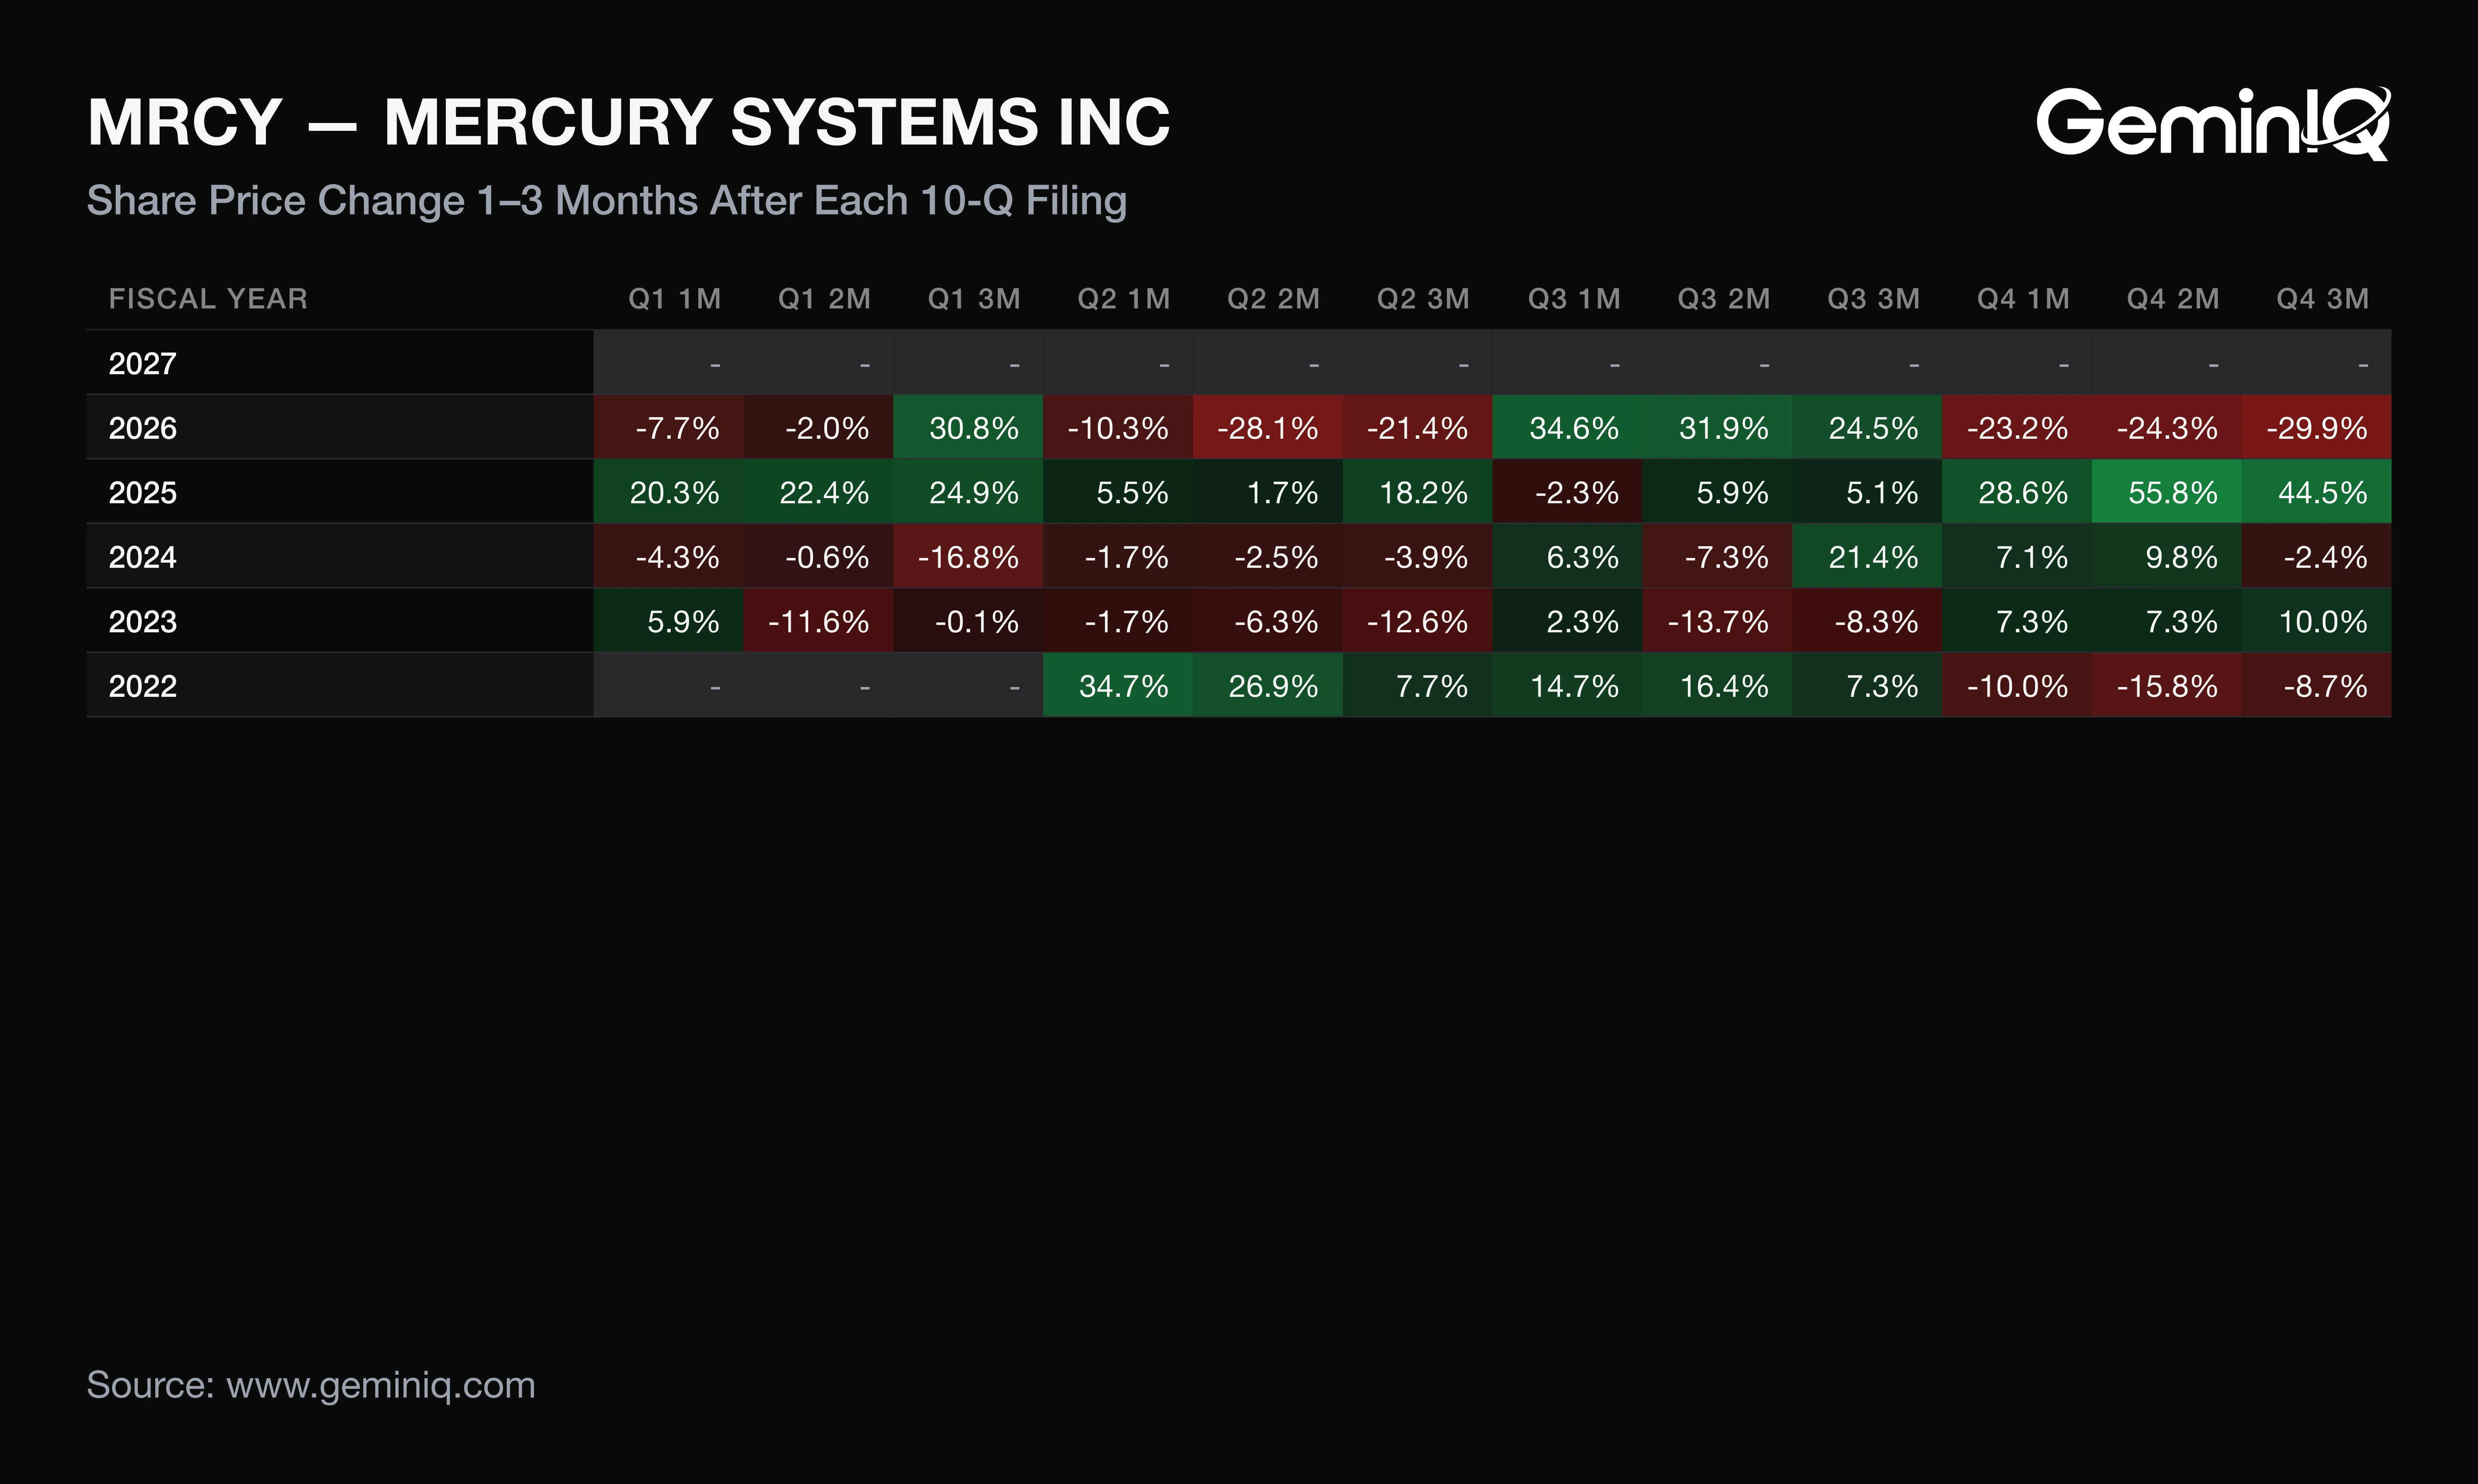
Across its last 12 10-Q filings with a completed one-month window (filed November 2023 to August 2026), Mercury Systems' median one-month return was +1.9%, positive after 6 of 12. These figures describe how Mercury's stock moved after its past filings; they are a historical association, not a forecast.
The Data: The one-month range ran from -23.2% after the FY2026 Q4 filing to +34.6% after the FY2026 Q3 filing. The three-month median was +11.6%, positive after 7 of 12. Past Q1 filings were followed by one-month and three-month returns of -4.3% and -16.8% (FY2024), +20.3% and +24.9% (FY2025), and -7.7% and +30.8% (FY2026). This filing's window has not elapsed. In the 12 months of Form 4 filings through September 21, 2026, insiders made 41 sales totaling $194.2 million and no purchases, against 22 sales of $64.8 million in the prior 12 months; Jana Partners Management accounted for $149.3 million, or 77%. The last purchase in the full record was filed August 27, 2024.
Why: Six positive and six negative one-month returns mean the direction of past reactions says little; the 57.8-point spread between the best and worst is the pattern. Zero purchases across both 12-month windows, while sales rose from $64.8 million to $194.2 million, is the sharper fact. The Form 4 data ends before this filing.
A quarter in which profit swings positive while operating cash flow turns negative and more receivables are sold to fund the gap should be read from the cash flow statement before the income statement.
Frequently Asked Questions
Is Mercury Systems doing well financially?
Mercury Systems' trailing-twelve-month net profit margin was -0.40% as of Q1 FY2027, though operating profit margin was 2.71%, up 4.30 points from -1.59% a year earlier. Trailing operating cash flow was $86.2 million. The current ratio was 2.90x and Net Debt to EBITDA was 2.34x.
When does Mercury Systems report earnings?
Mercury Systems reported Q1 FY2027 results and filed its 10-Q on November 10, 2026. Last year it filed its next quarter, Q2 FY2026, on February 3, 2026. That is a filing-record pattern, not a forecast of the next date.
Does Mercury Systems pay a dividend?
Mercury Systems paid no dividends in Q1 FY2027 or over the trailing twelve months. It also repurchased no shares in the quarter, with $185.0 million of its $200.0 million repurchase authorization remaining as of October 2, 2026.
Where can I verify Mercury Systems' Q1 FY2027 figures?
The figures come from the Q1 FY2027 10-Q (accession 0001049521-26-000098) and the earnings release filed with Form 8-K on November 10, 2026. Adjusted EBITDA, adjusted EPS and the release's outlook are non-GAAP or company claims found only in the 8-K.
Wall Street's data. Main Street's price.
Institutional terminals charge thousands a year for as-filed accuracy. GeminIQ gives you the same thing for a fraction of the cost: financials built directly from raw SEC EDGAR filings, not third-party APIs, with full XBRL traceability back to the original 10-K or 10-Q. No normalized guesswork, just calculated metrics, charts, screeners, and watchlists built on numbers exactly as the company reported them. Start researching now at GeminIQ.com.
All financial figures cited in this article reference MERCURY SYSTEMS, INC.'s Q1 FY2027 10-Q (filed November 10, 2026, period ending September 30, 2026), with guidance and management commentary drawn from the company's Form 8-K earnings release (filed November 10, 2026). All SEC filings are publicly available at SEC EDGAR and SEC EDGAR.
Disclaimer: The content in this blog is for educational and entertainment purposes only and does not constitute financial, legal, or tax advice. Investing involves risk, including the loss of principal. The views expressed are my own and not intended as financial advice or a guarantee of future performance.