Microsoft (MSFT) Q1 FY2027 Earnings: EPS Up 32%, FCF Down 27%

By Chad Hartman
Published · Last updated
Microsoft (MSFT) reported Q1 FY2027 revenue of $92.3 billion, up 19%, and diluted EPS of $4.92, up 32%, for the quarter ended September 30, 2026; the earnings release and the 10-Q were both dated October 28, 2026. Operating cash flow rose 29% to $58.0 billion, yet capital expenditure doubled to $39.4 billion and free cash flow fell 27% to $18.6 billion. A swing in OpenAI investment results also supplied 37% of the EPS increase, and the company's own adjusted EPS rose 18%.
| Field | Value |
|---|---|
| Company | Microsoft ($MSFT) |
| Quarter | Q1 FY2027, period ended September 30, 2026 |
| Earnings release | October 28, 2026 (Form 8-K) |
| 10-Q filed | October 28, 2026 |
| Revenue | $92.28 Billion (+18.8% YoY) |
| Diluted EPS | $4.92 (+32.3% YoY) |
| Operating margin | 49.8% (+0.9 pts YoY) |
| Operating cash flow (TTM) | $195.88 Billion |
| Free cash flow (quarter) | $18.63 Billion (-27.4% YoY) |
Microsoft Q1 FY2027 Revenue, EPS and Margins
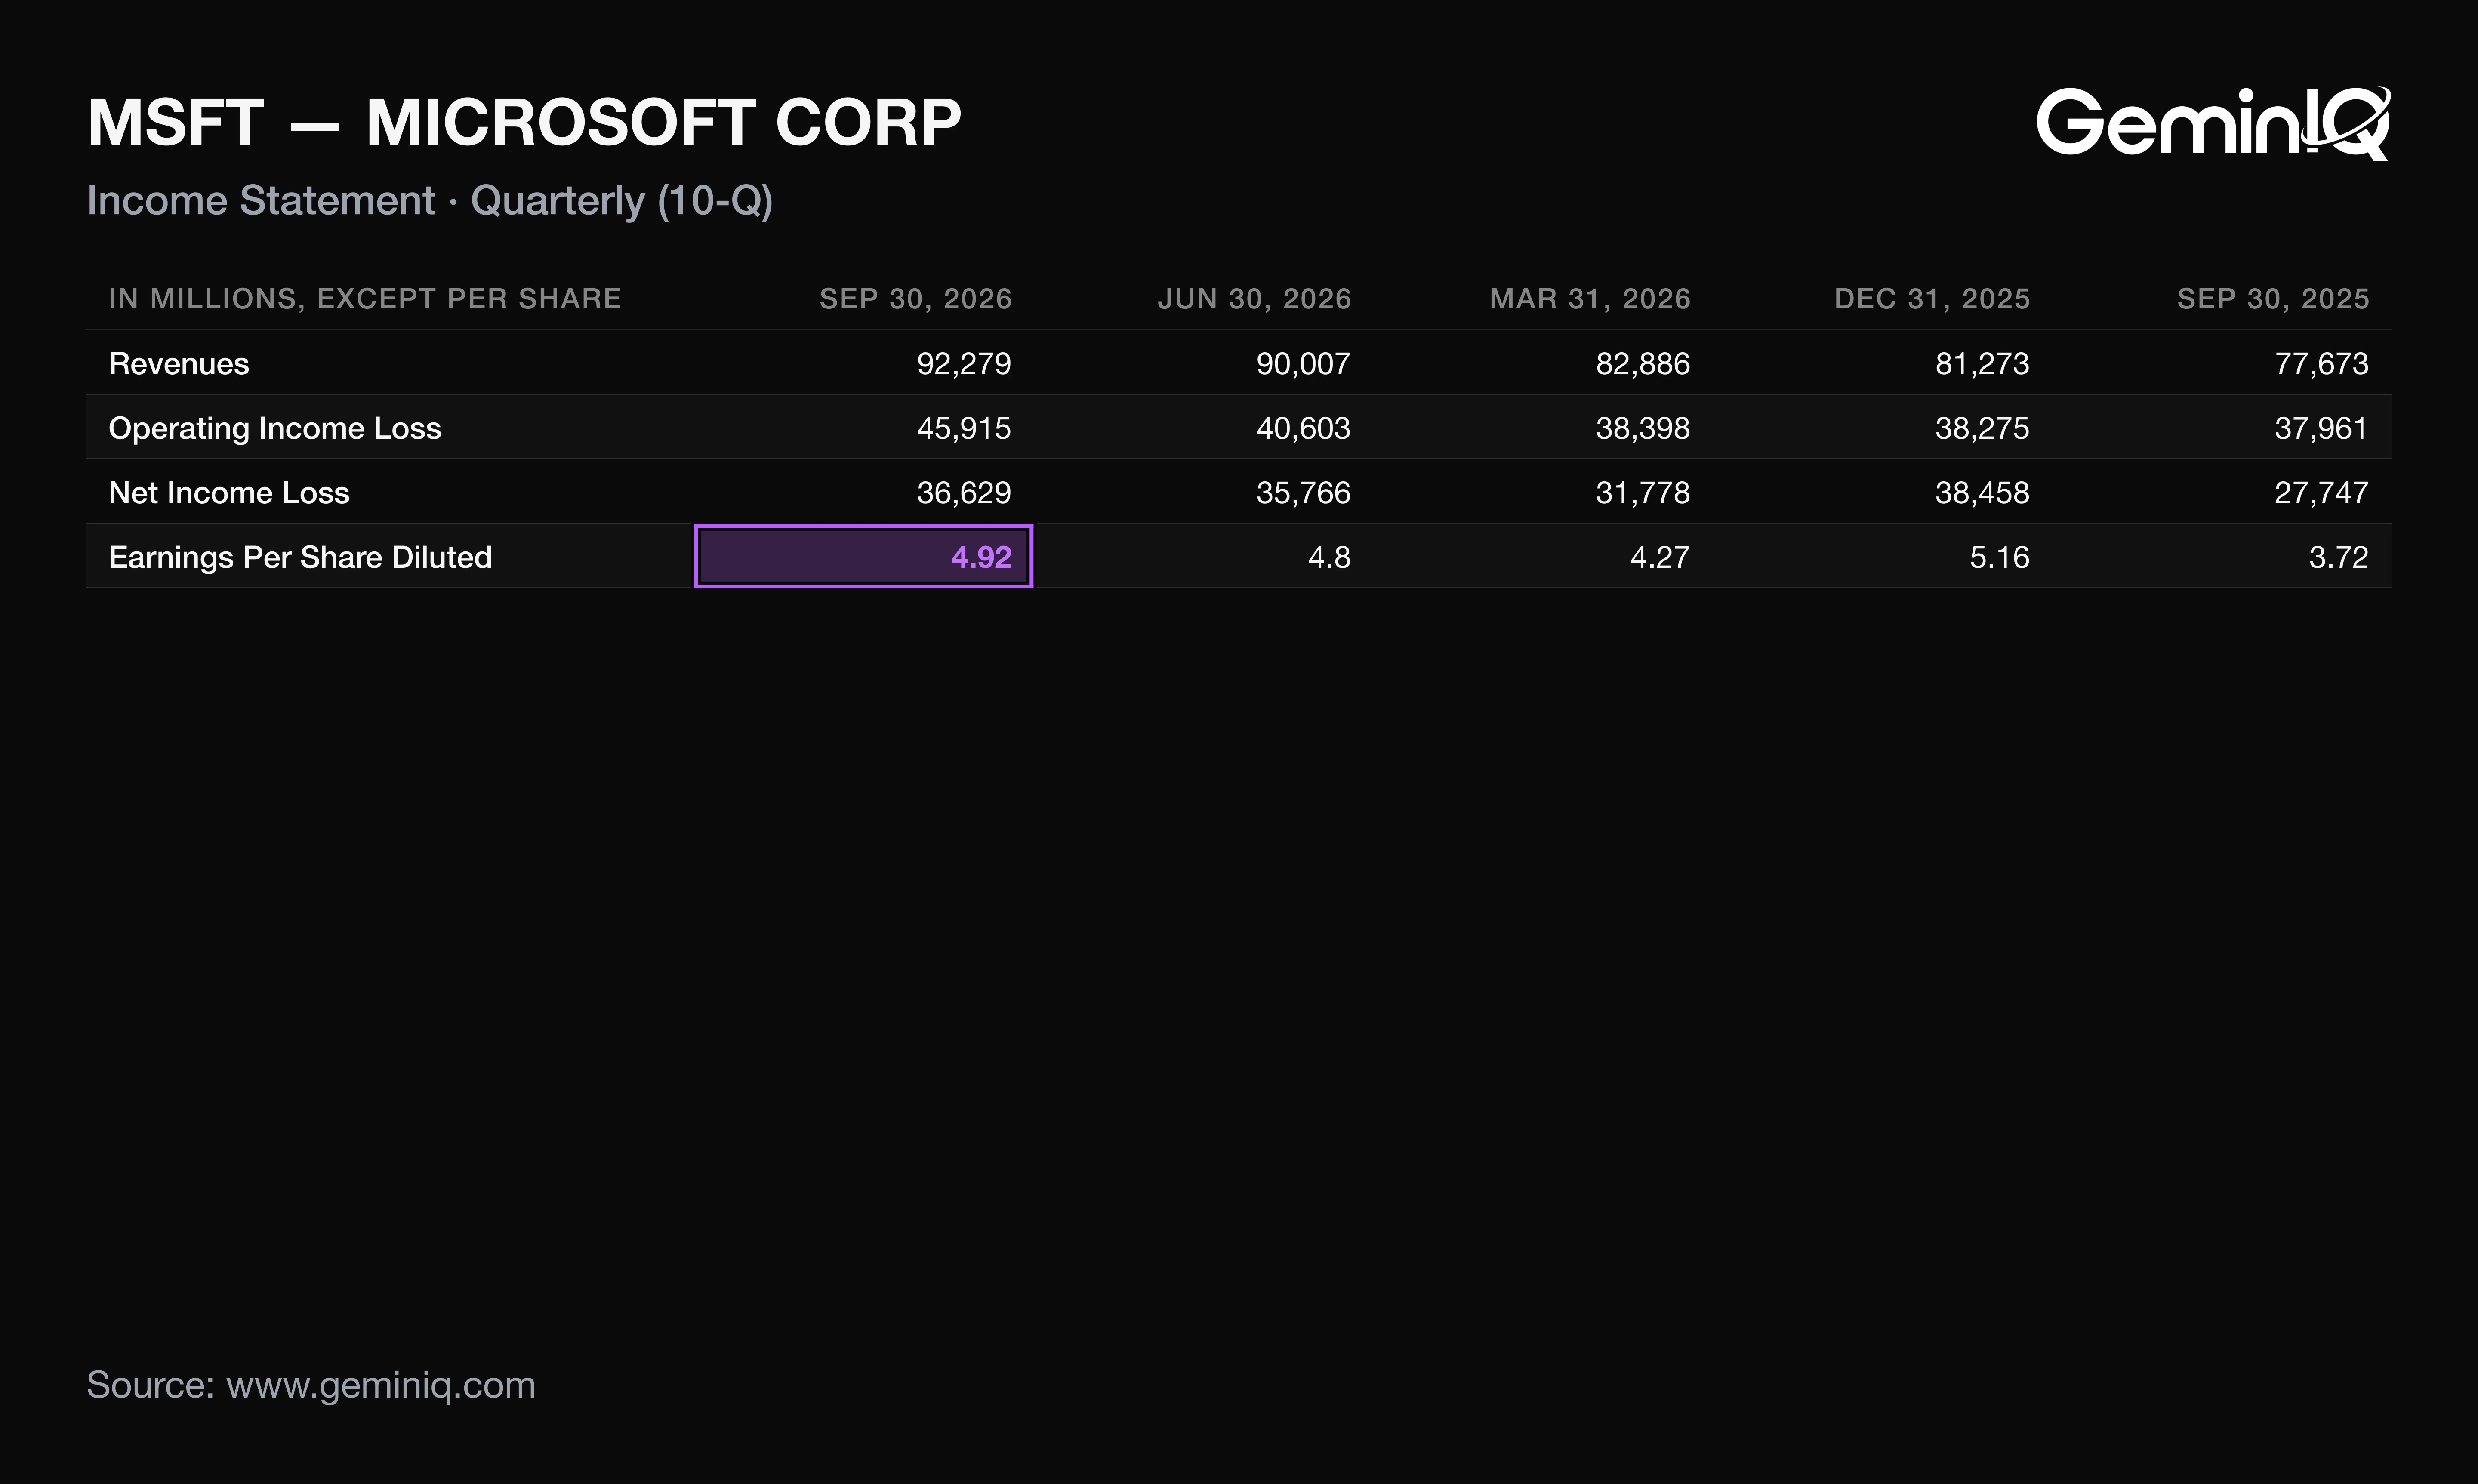
Microsoft's Q1 FY2027 diluted EPS was $4.92, up 32.3% from $3.72, on revenue of $92.28 billion, up 18.8%. Operating leverage explains part of that 13-point gap, and the rest sits below the operating line.
The Data: Operating income rose 21.0% to $45.91 billion, lifting operating margin to 49.8%, the highest of the last 16 quarters. Other income (expense), net swung from a $3.66 billion loss to $38 million of income, so pretax income grew 34%, to $45.95 billion. The 8-K reports adjusted EPS, which excludes OpenAI investment results, of $4.89 against $4.13, up 18%.
Why: The 10-Q's MD&A attributes $272 million of net gains this quarter and $4.1 billion of net losses a year ago to OpenAI. That $0.44 per-share swing equals 37% of the $1.20 EPS increase. Share count added only 0.3 points (7,446 million diluted shares against 7,466 million), and the 10-Q's effective tax rate rose to 20% from 19%. Adjusted EPS therefore grew a point slower than revenue, not 13 points faster.
Gross margin tells the same story from another angle: 67.8%, the fourth-lowest of the last 16 quarters, as the MD&A says Microsoft Cloud gross margin fell to 66% on a sales mix shift to Azure. The 32% EPS growth rests on an investment-result swing more than on widening profitability.
What Microsoft's 10-Q Shows Beyond the Press Release
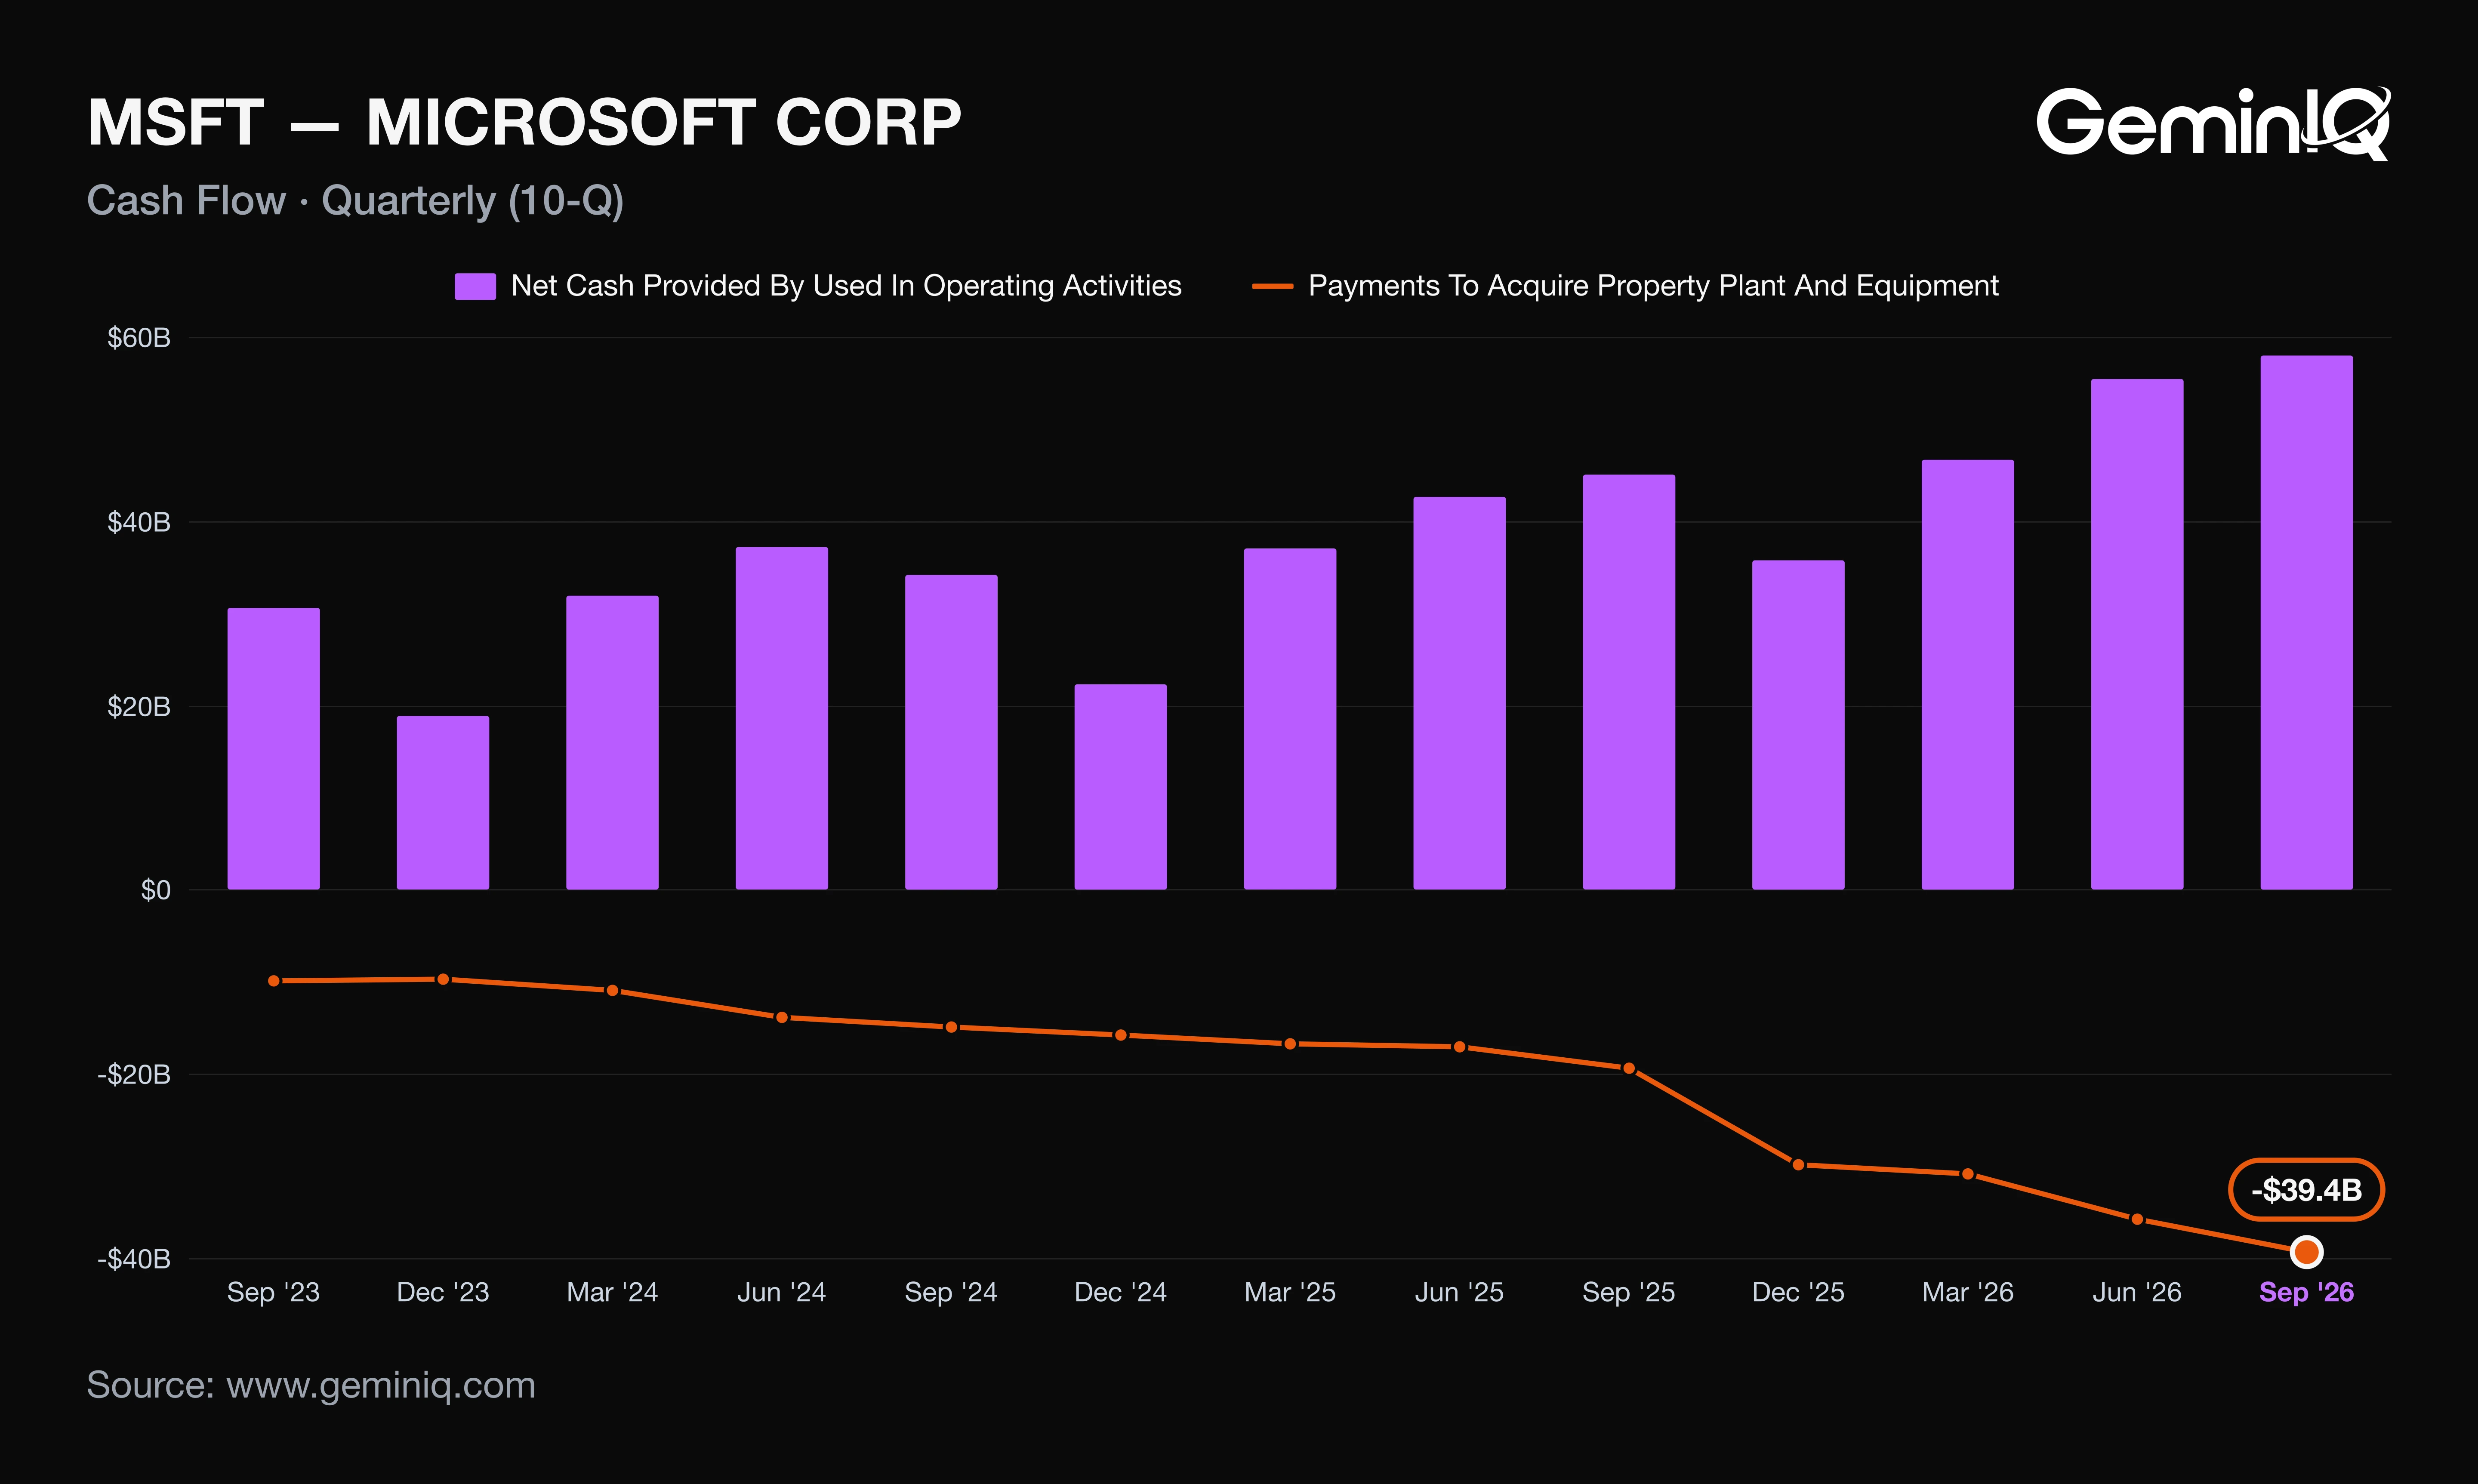
Microsoft's Q1 FY2027 operating cash flow rose 28.7% to $58.00 billion, but capital expenditure rose 103.0% to $39.37 billion, leaving free cash flow of $18.63 billion, down 27.4% from $25.66 billion. Free cash flow did not follow earnings.
Net income rose 32% and operating cash flow 29%, so cash looks like it is tracking profit. The release headlines revenue, EPS and cloud growth; the 10-Q's MD&A names a $20.0 billion rise in additions to property and equipment as the main driver of higher investing outflows.
The Data: Capex consumed 68% of operating cash flow, against 43% a year ago, and its $39.37 billion was the highest of the last 16 quarters and of 69 quarters since 2009. On a trailing basis, GeminIQ's pre-calculated Free Cash Flow was $59.96 billion, down 23.1%, while trailing operating cash flow grew 33.2% to $195.88 billion. The 10-Q's balance sheet shows cash and short-term investments fell to $64.5 billion from $76.8 billion at June 30, 2026.
Why: The spending is capacity for demand already contracted. The MD&A says Agents and Infra cost of revenue rose 35% on datacenter investment, and commercial remaining performance obligation rose 73% to $677 billion, with about 30% due to be recognized within 12 months. Capex lands in cost of revenue later as depreciation, which is why gross margin is already near its 16-quarter low. Had capex held at last year's $19.39 billion, free cash flow would have been about $38.6 billion instead of $18.63 billion.
Capital returns continued on the smaller cushion. Dividends paid were $6.76 billion, up 9.5%, and cash repurchases were $4.38 billion, of which $2.93 billion was the buyback program and the rest settled employee tax withholding. The cash flow statement also shows $4.85 billion of debt repaid. Together dividends and repurchases took 60% of free cash flow, and free cash flow covered dividends paid 2.8 times, down from 4.2 times a year ago. The share count is the visible result: diluted shares fell 0.3% year over year, the second-lowest count of the last 16 quarters.
How MSFT Stock Has Moved After Past Earnings Reports
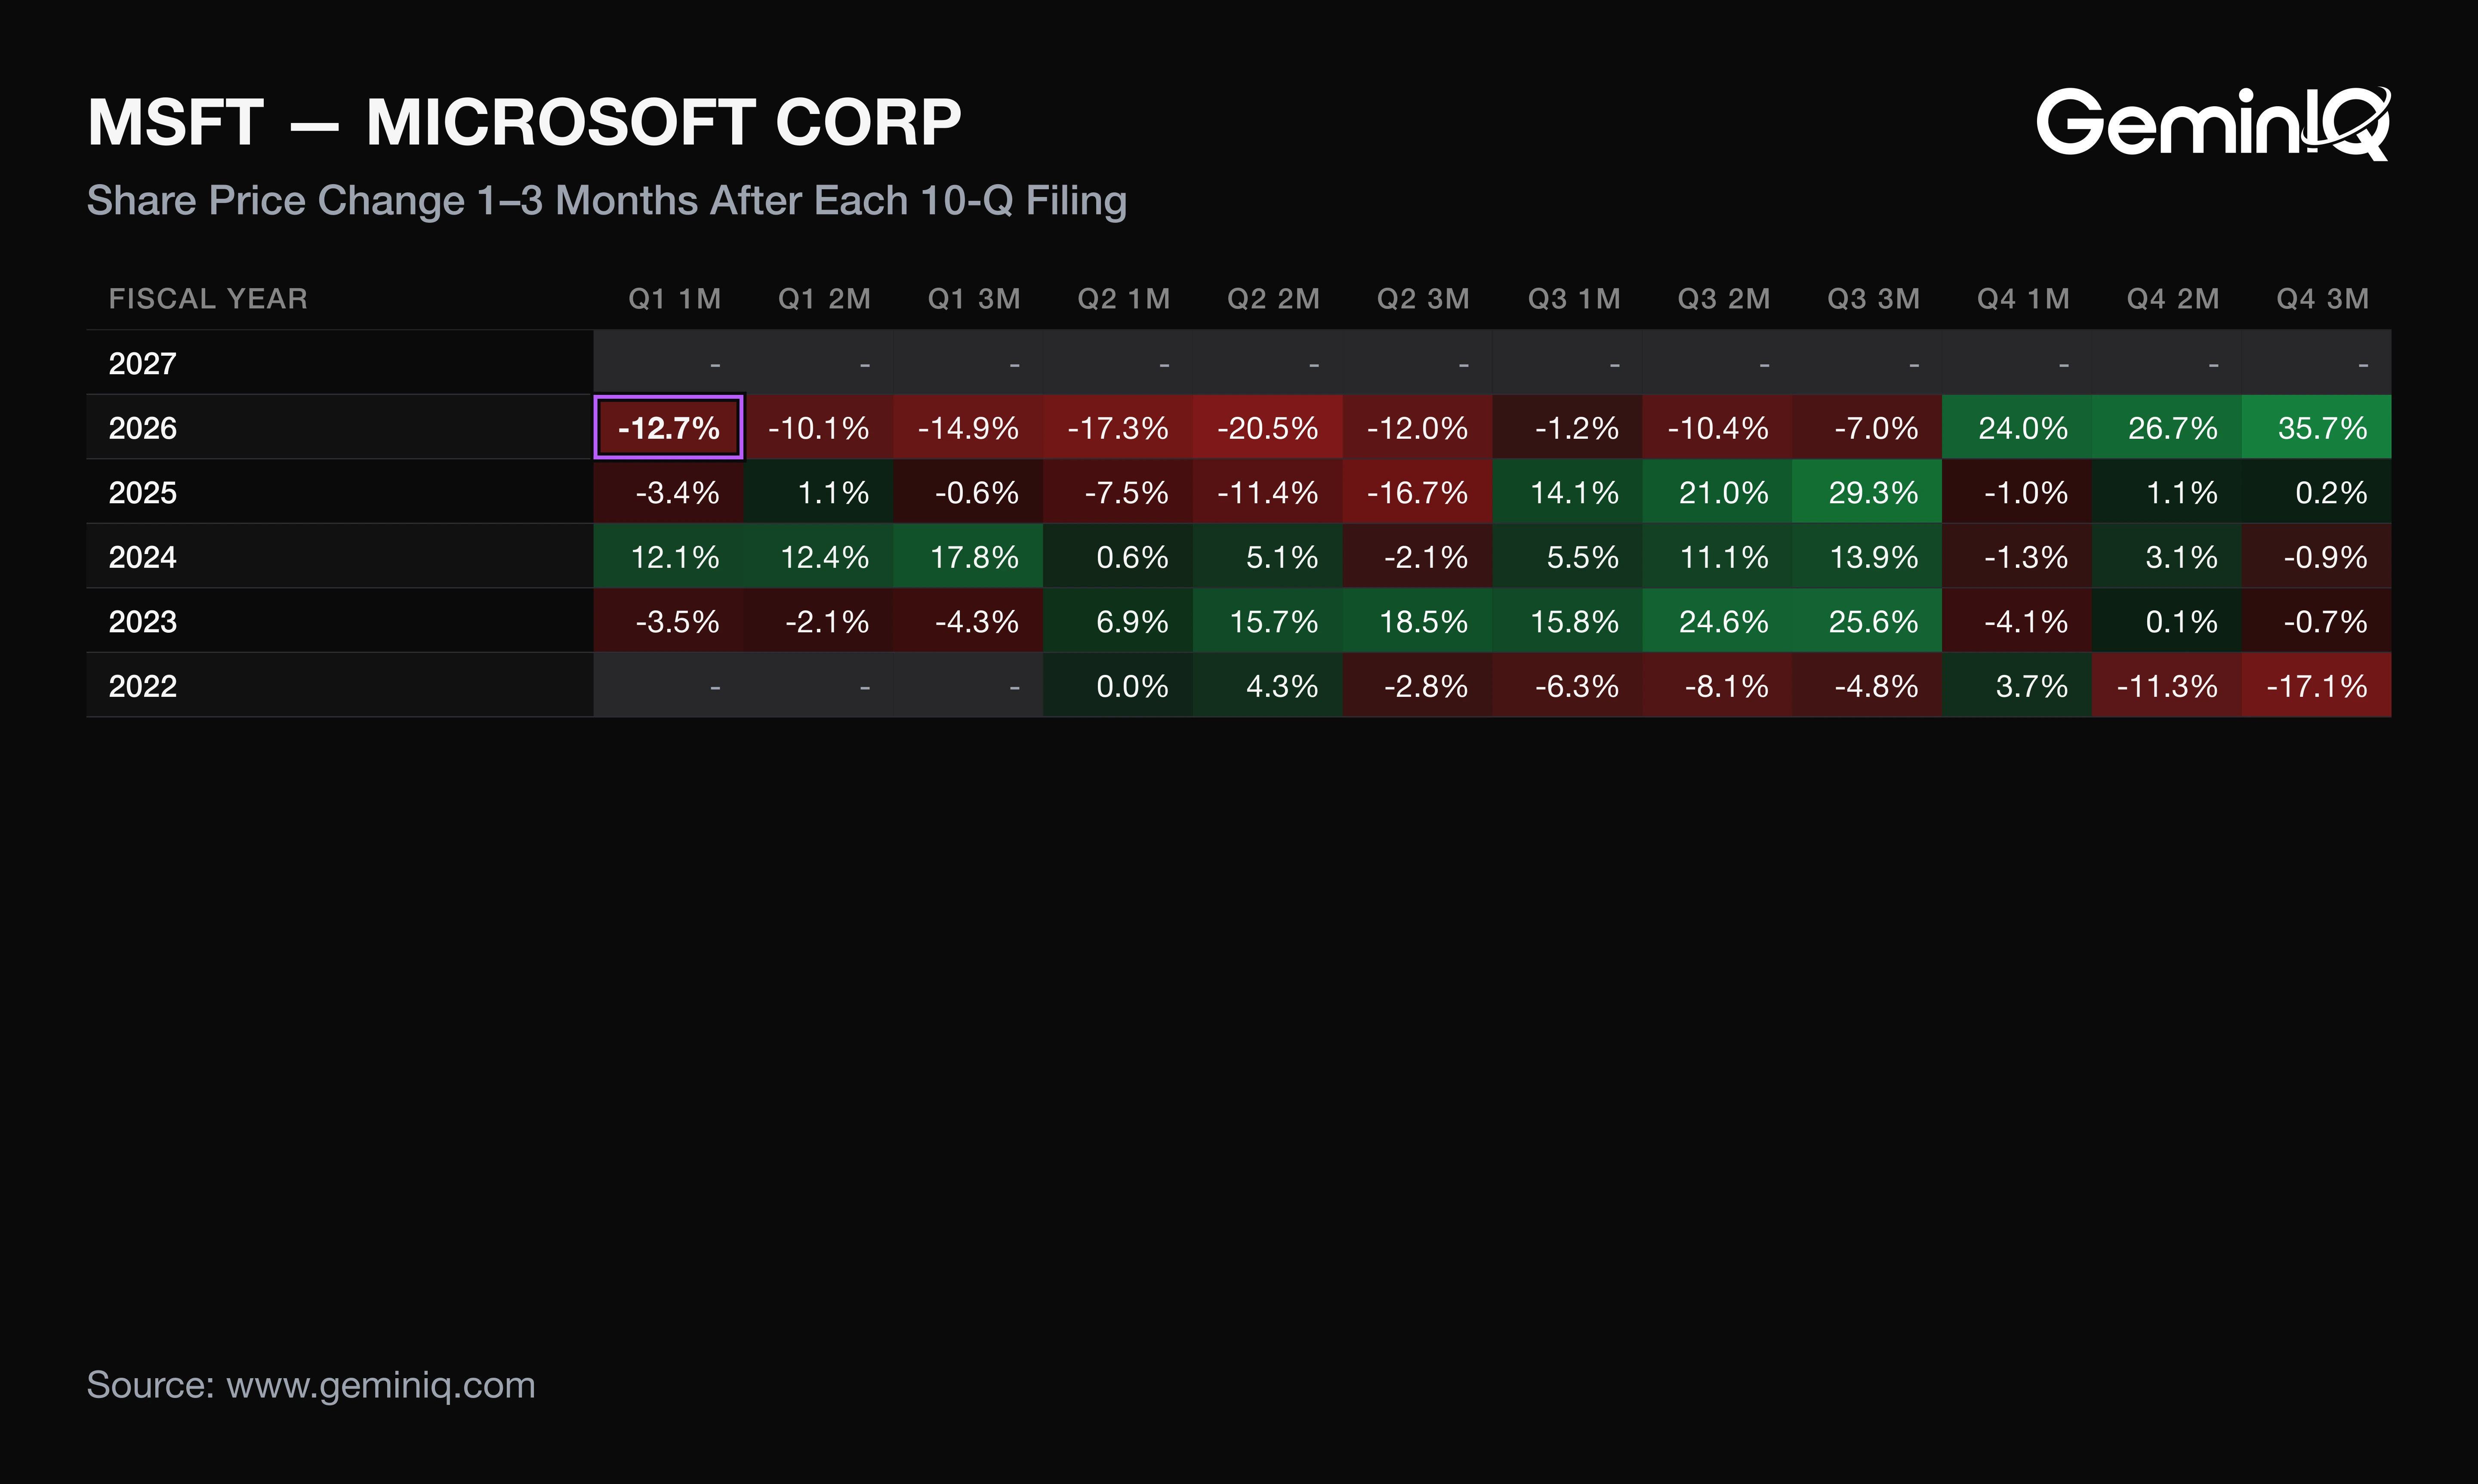
Over the last 12 filings, MSFT's one-month return after a 10-Q has had a median of -1.1% and was positive after 5 of 12, with a range from -17.3% (filed January 28, 2026) to +24.0% (filed July 29, 2026). These figures describe how Microsoft's stock moved after its past filings; they are a historical association, not a forecast.
The Data: The three-month median was -0.8%, also positive after 5 of 12. Past Q1 filings were followed by one-month returns of +12.1% (FY2024), -3.4% (FY2025) and -12.7% (FY2026). The current filing has no return yet because its window has not elapsed. The GeminIQ Earnings Reaction Heat Map shows the full grid.
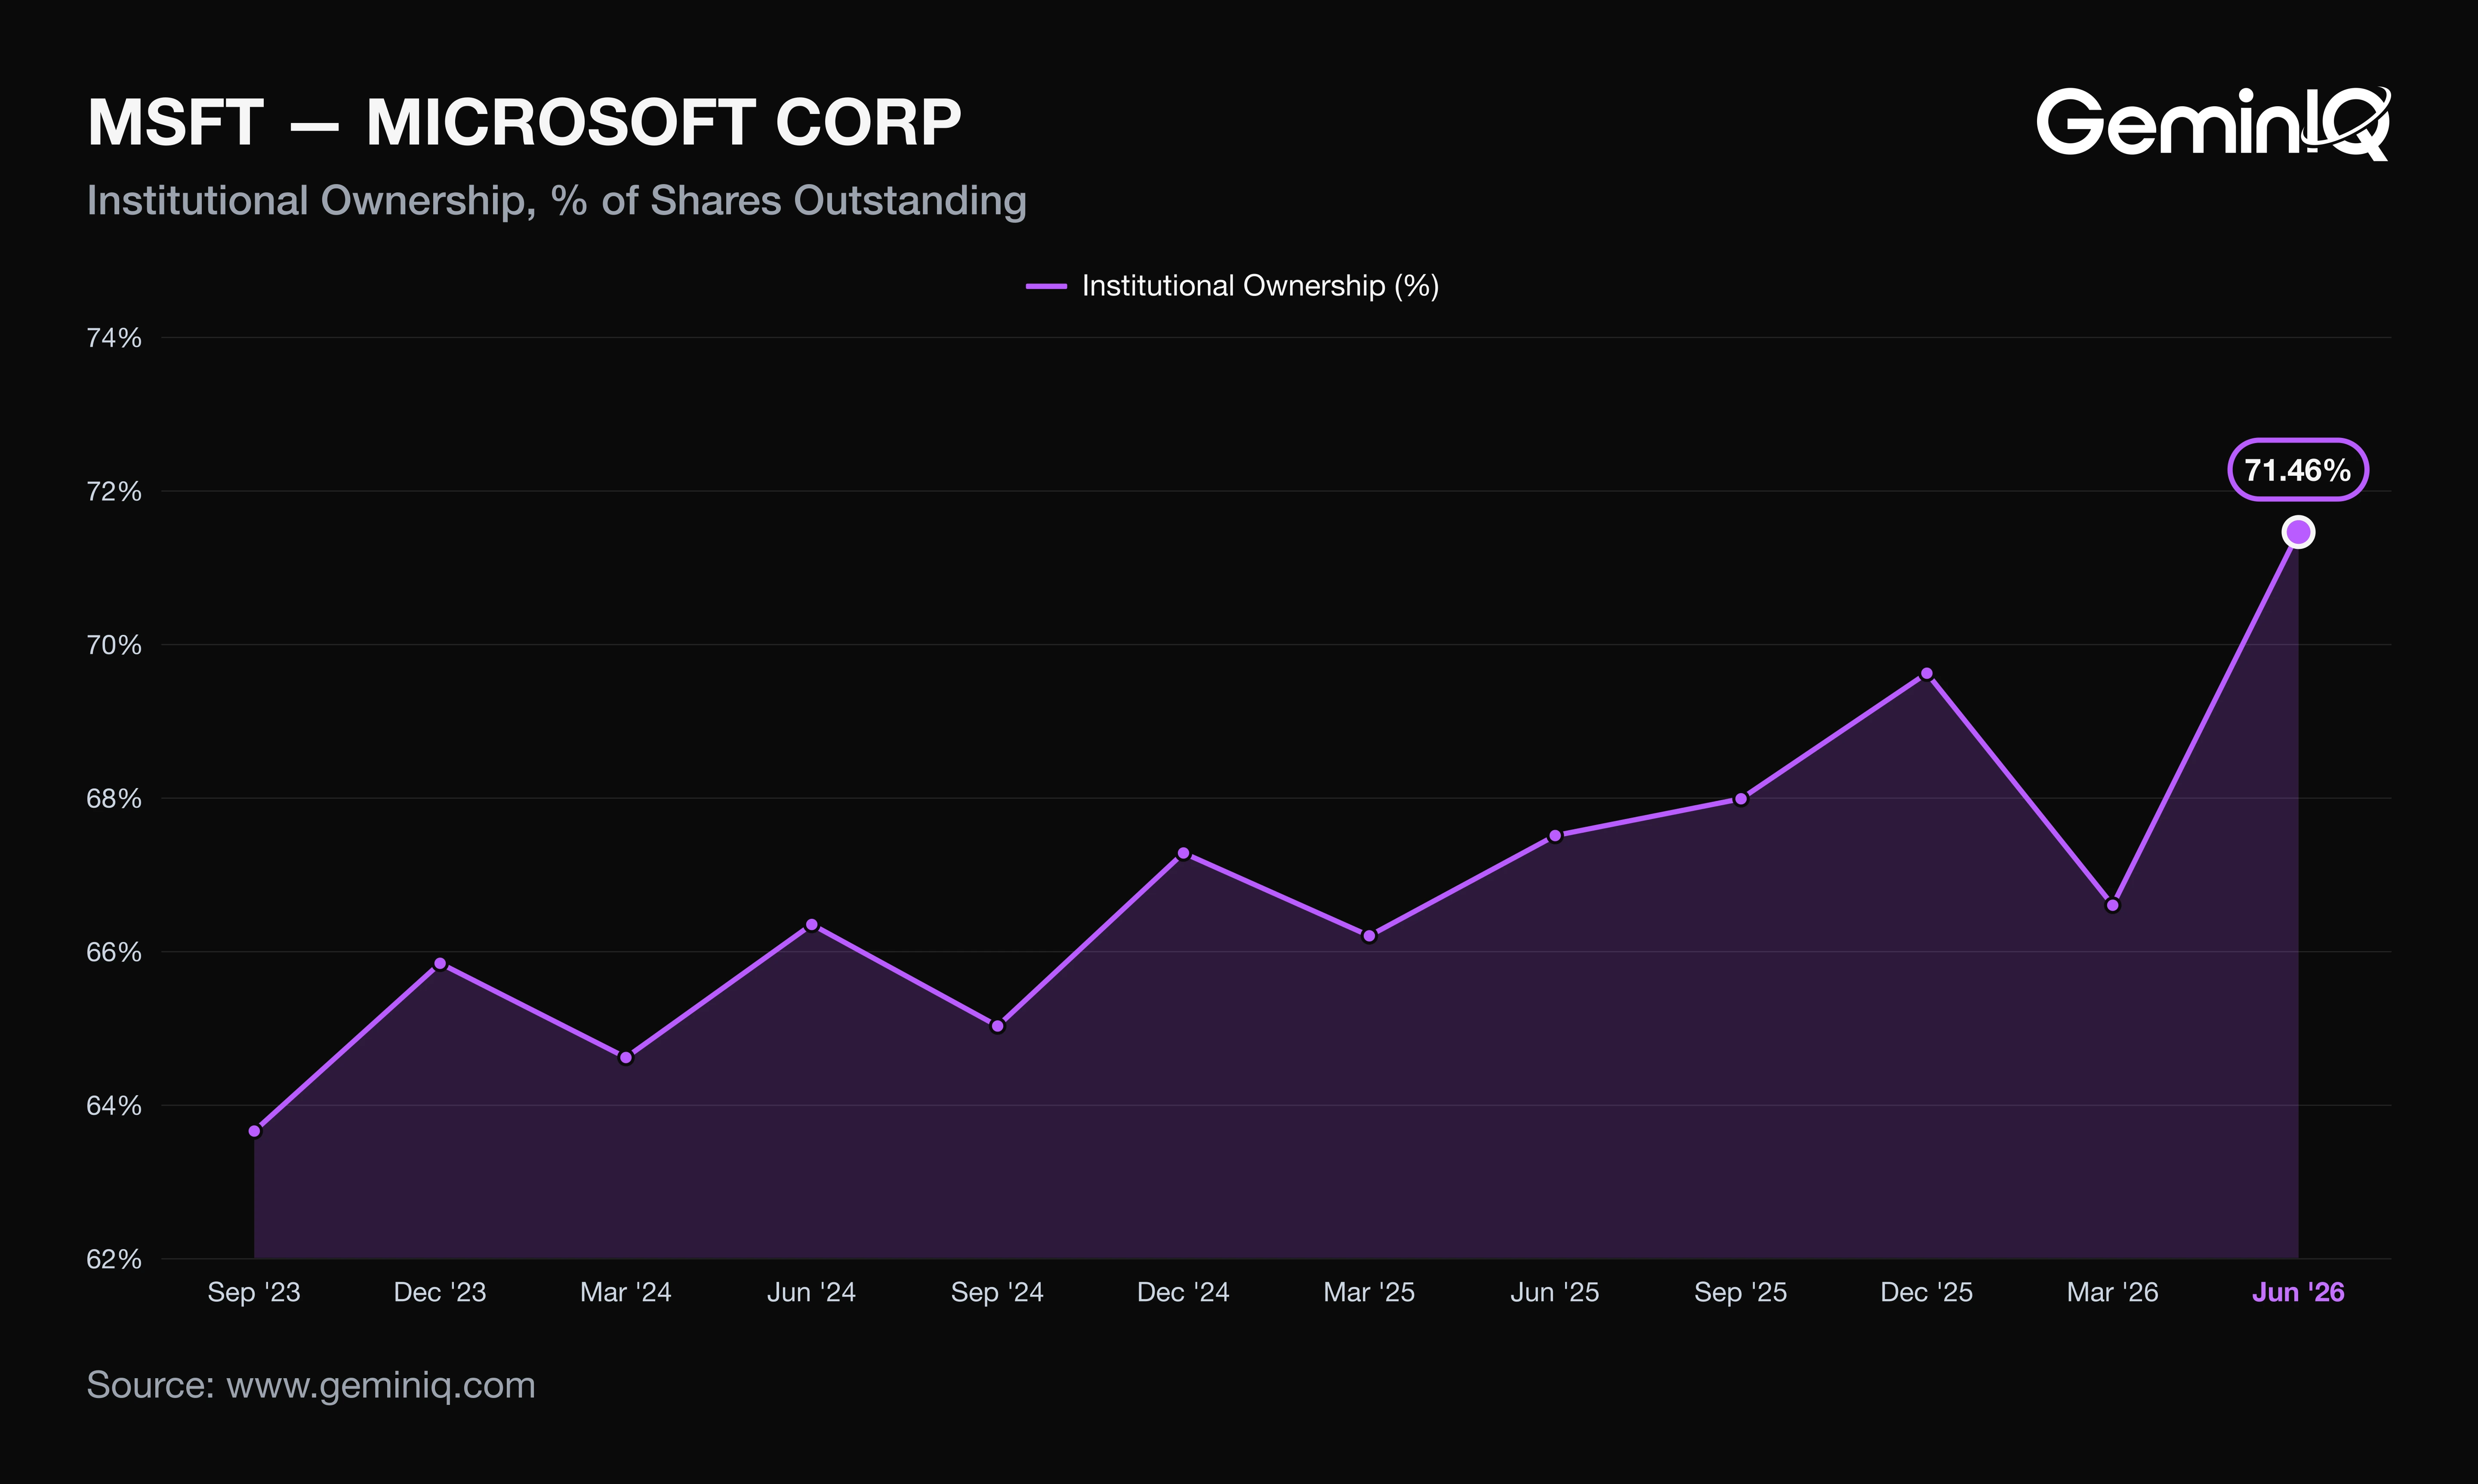
Why: The range is wider than the median, so a single prior quarter carries little weight. Ownership adds context rather than a signal: institutions held 71.46% of shares at June 30, 2026, up 3.95 points from 67.50% a year earlier and the highest of the last 16 quarter-ends. Quarterly 13F data lags the report by up to 45 days, so the September 30 figure is not yet filed.
An earnings number that grows faster than the cash behind it is only as durable as the contracts the spending is built to serve.
Frequently Asked Questions
When does Microsoft report earnings?
Microsoft reported Q1 FY2027 results on October 28, 2026 and filed its 10-Q the same day. Last year it filed its next quarter, FY2026 Q2, on January 28, 2026. That is a pattern from the filing record, not a forecast of the date.
Does Microsoft pay a dividend?
Yes. Microsoft paid $6.76 billion in dividends in Q1 FY2027 and $27.03 billion over the trailing twelve months, up 9.5%. The 10-Q says its board declared $0.98 per share on September 15, 2026, payable December 10, 2026, against $0.91 declared a year earlier.
Is Microsoft doing well financially?
Microsoft's trailing net profit margin was 41.17% and its operating margin 47.10%, up 5.46 and 0.84 points year over year. Net debt to EBITDA was 0.09x. Return on invested capital was 29.93%, down 1.97 points, and the current ratio fell to 1.22x from 1.40x as cash was spent on datacenters.
Where can I verify Microsoft's Q1 FY2027 figures?
The figures come from Microsoft's 10-Q and the earnings release, both filed October 28, 2026 on SEC EDGAR.
Wall Street's data. Main Street's price.
Institutional terminals charge thousands a year for as-filed accuracy. GeminIQ gives you the same thing for a fraction of the cost: financials built directly from raw SEC EDGAR filings, not third-party APIs, with full XBRL traceability back to the original 10-K or 10-Q. No normalized guesswork, just calculated metrics, charts, screeners, and watchlists built on numbers exactly as the company reported them. Start researching now at GeminIQ.com.
All financial figures cited in this article reference MICROSOFT CORP's Q1 FY2027 10-Q (filed October 28, 2026, period ending September 30, 2026), with guidance and management commentary drawn from the company's Form 8-K earnings release (filed October 28, 2026). All SEC filings are publicly available at SEC EDGAR and SEC EDGAR.
Disclaimer: The content in this blog is for educational and entertainment purposes only and does not constitute financial, legal, or tax advice. Investing involves risk, including the loss of principal. The views expressed are my own and not intended as financial advice or a guarantee of future performance.