
PepsiCo (PEP) Q3 2026 Earnings: EPS Up 17%, Core EPS Up 2%

By Chad Hartman
Published · Last updated
PepsiCo (PEP) reported Q3 FY2026 revenue of $25.27 billion, up 5.6%, and diluted EPS of $2.23, up 17.4%, for the 12 weeks ended September 5, 2026; the company released results and filed its 10-Q on October 8, 2026. The 17% did not come from the core business: the 8-K puts core EPS growth at 2% and credits tariff refunds with 4 points of a core operating profit gain that was 3% in total. Items PepsiCo excludes from core account for about four-fifths of the reported operating profit gain. The same release cut full-year core EPS growth guidance to +2.5% to +3.5%, from the low end of +5% to +7%.
| Field | Value |
|---|---|
| Company | PepsiCo ($PEP) |
| Quarter | Q3 FY2026, 12 weeks ended September 5, 2026 |
| Earnings release | October 8, 2026 (Form 8-K) |
| 10-Q filed | October 8, 2026 |
| Revenue | $25.27 Billion (+5.6% YoY) |
| Diluted EPS | $2.23 (+17.4% YoY) |
| Operating margin | 16.9% (+1.9 pts YoY) |
| Operating cash flow (TTM) | $10.27 Billion |
| Diluted EPS growth vs core EPS growth (8-K) | +17.4% vs +2% |
PepsiCo Q3 FY2026 Revenue, EPS and Operating Margin
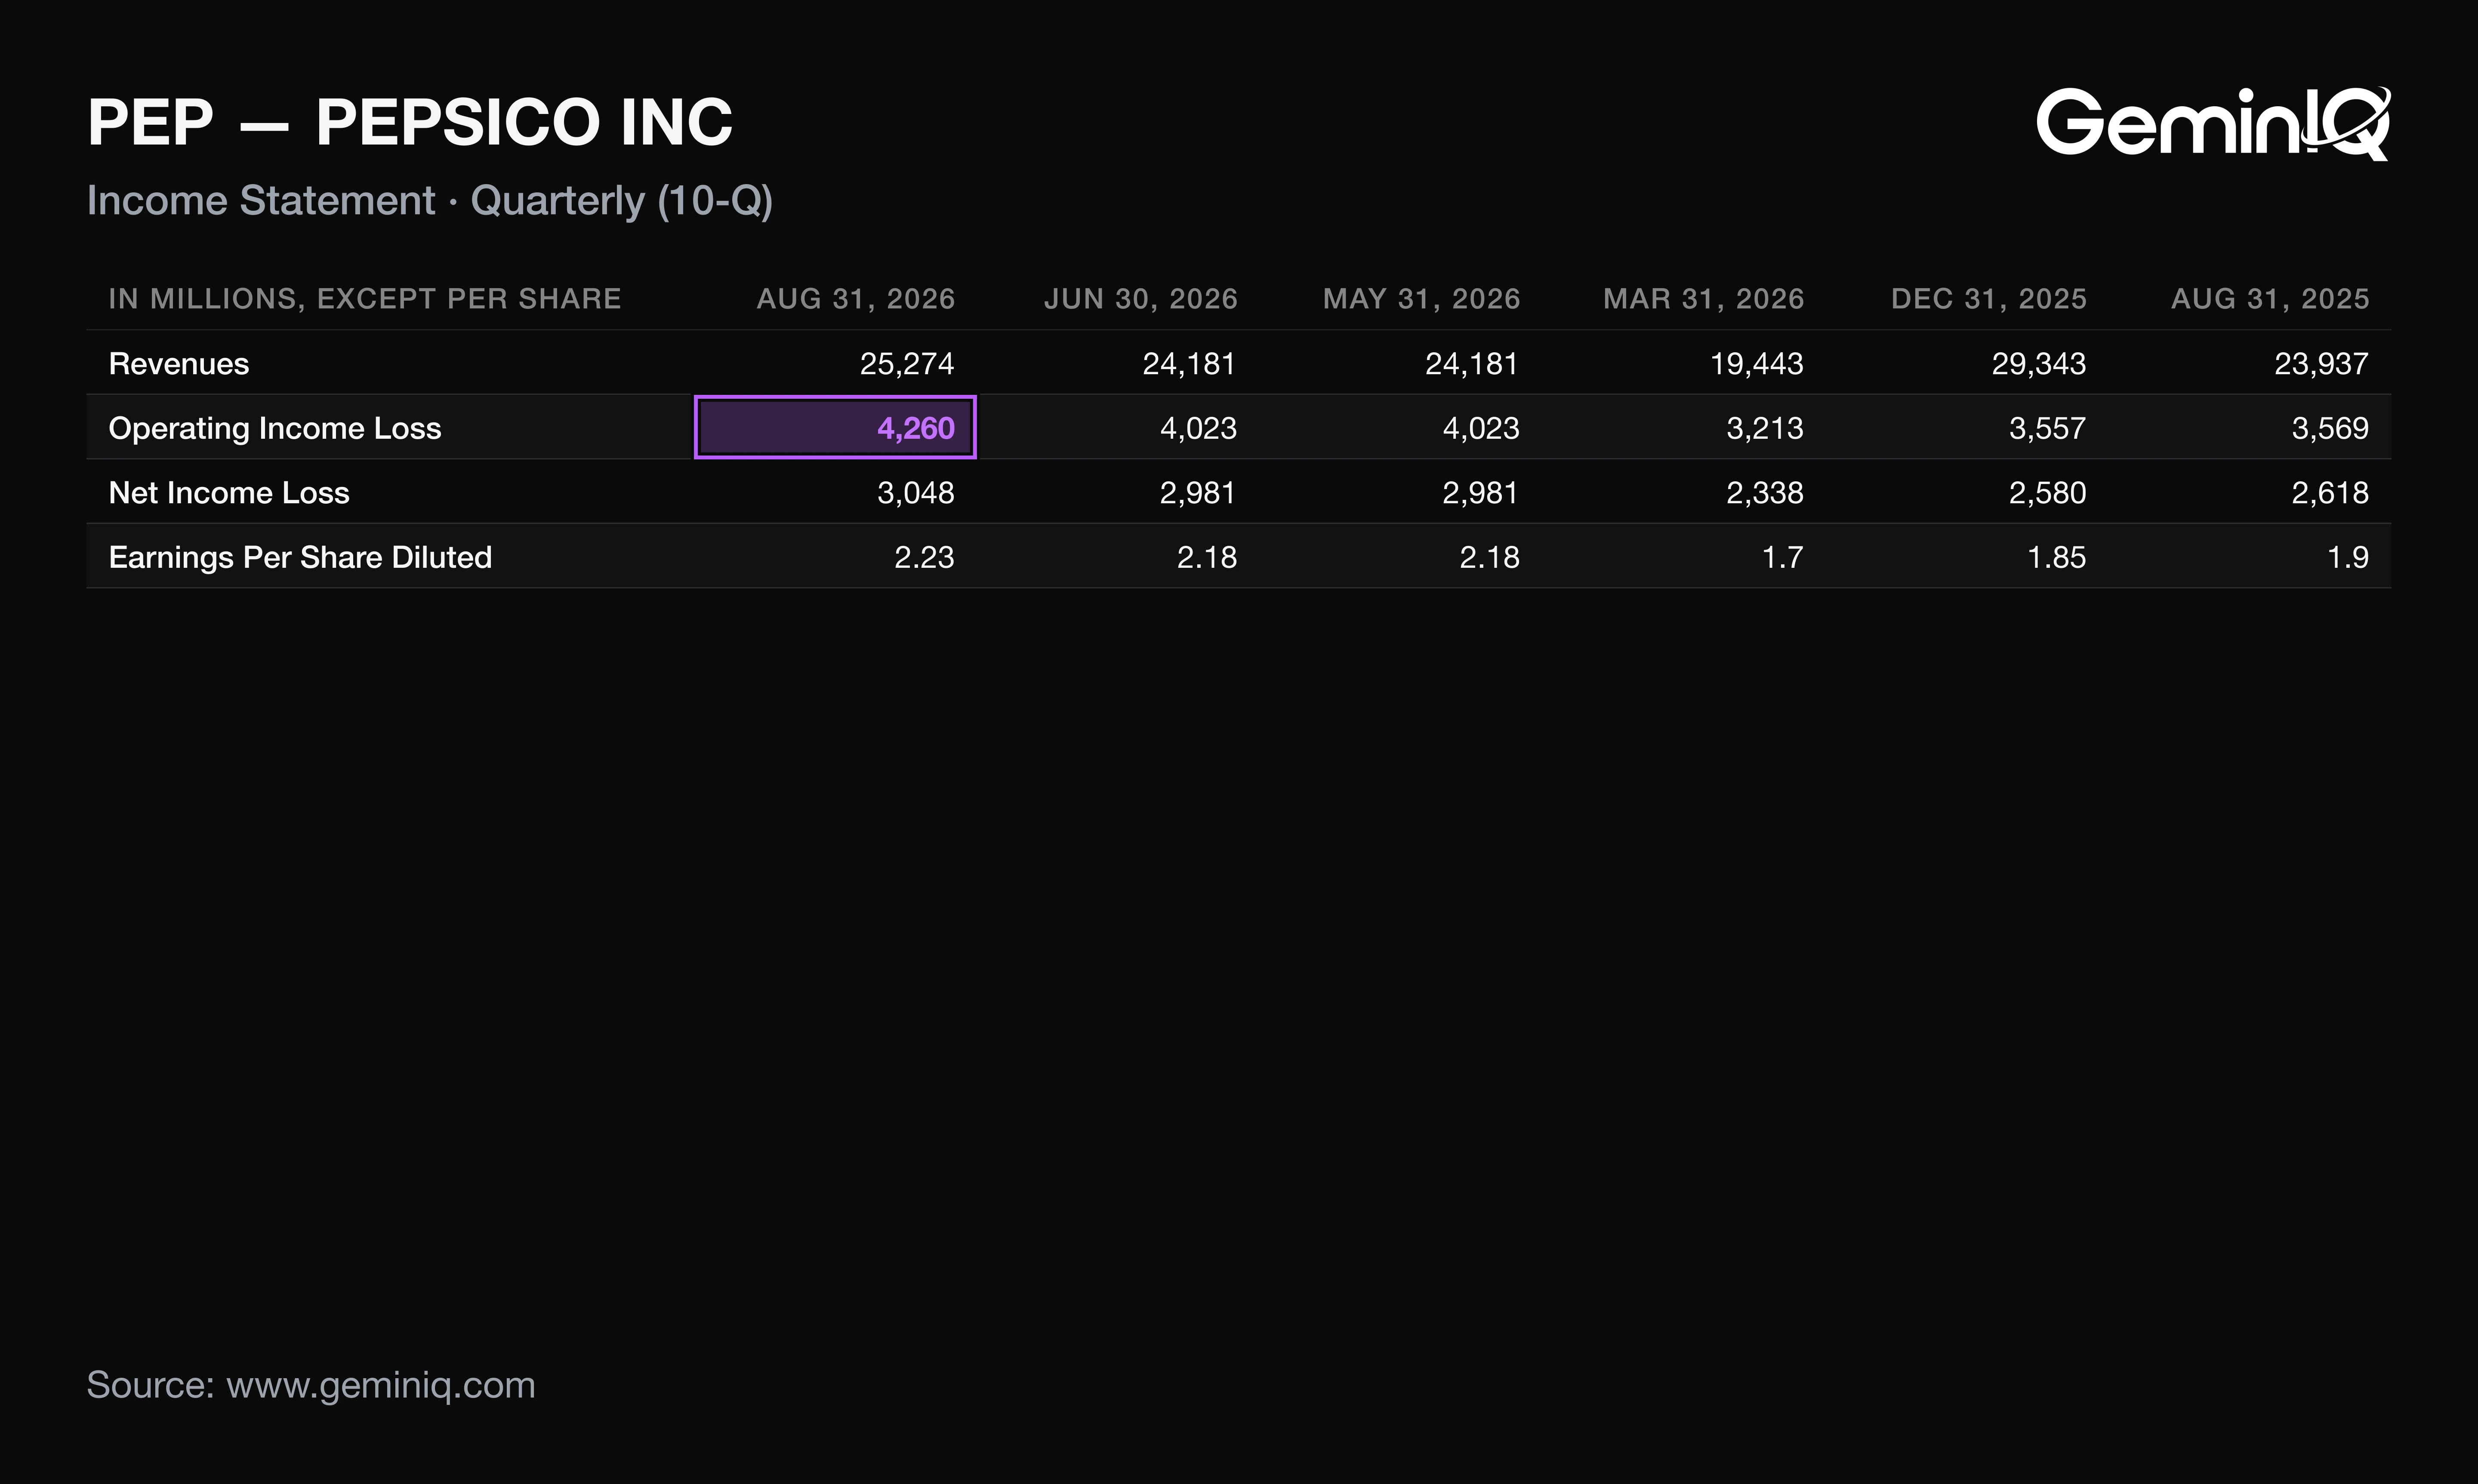
PepsiCo's Q3 FY2026 diluted EPS was $2.23, up 17.4% from $1.90, on revenue of $25.27 billion, up 5.6% from $23.94 billion. Nearly all of the EPS gain traces to one line, because everything below it barely moved.
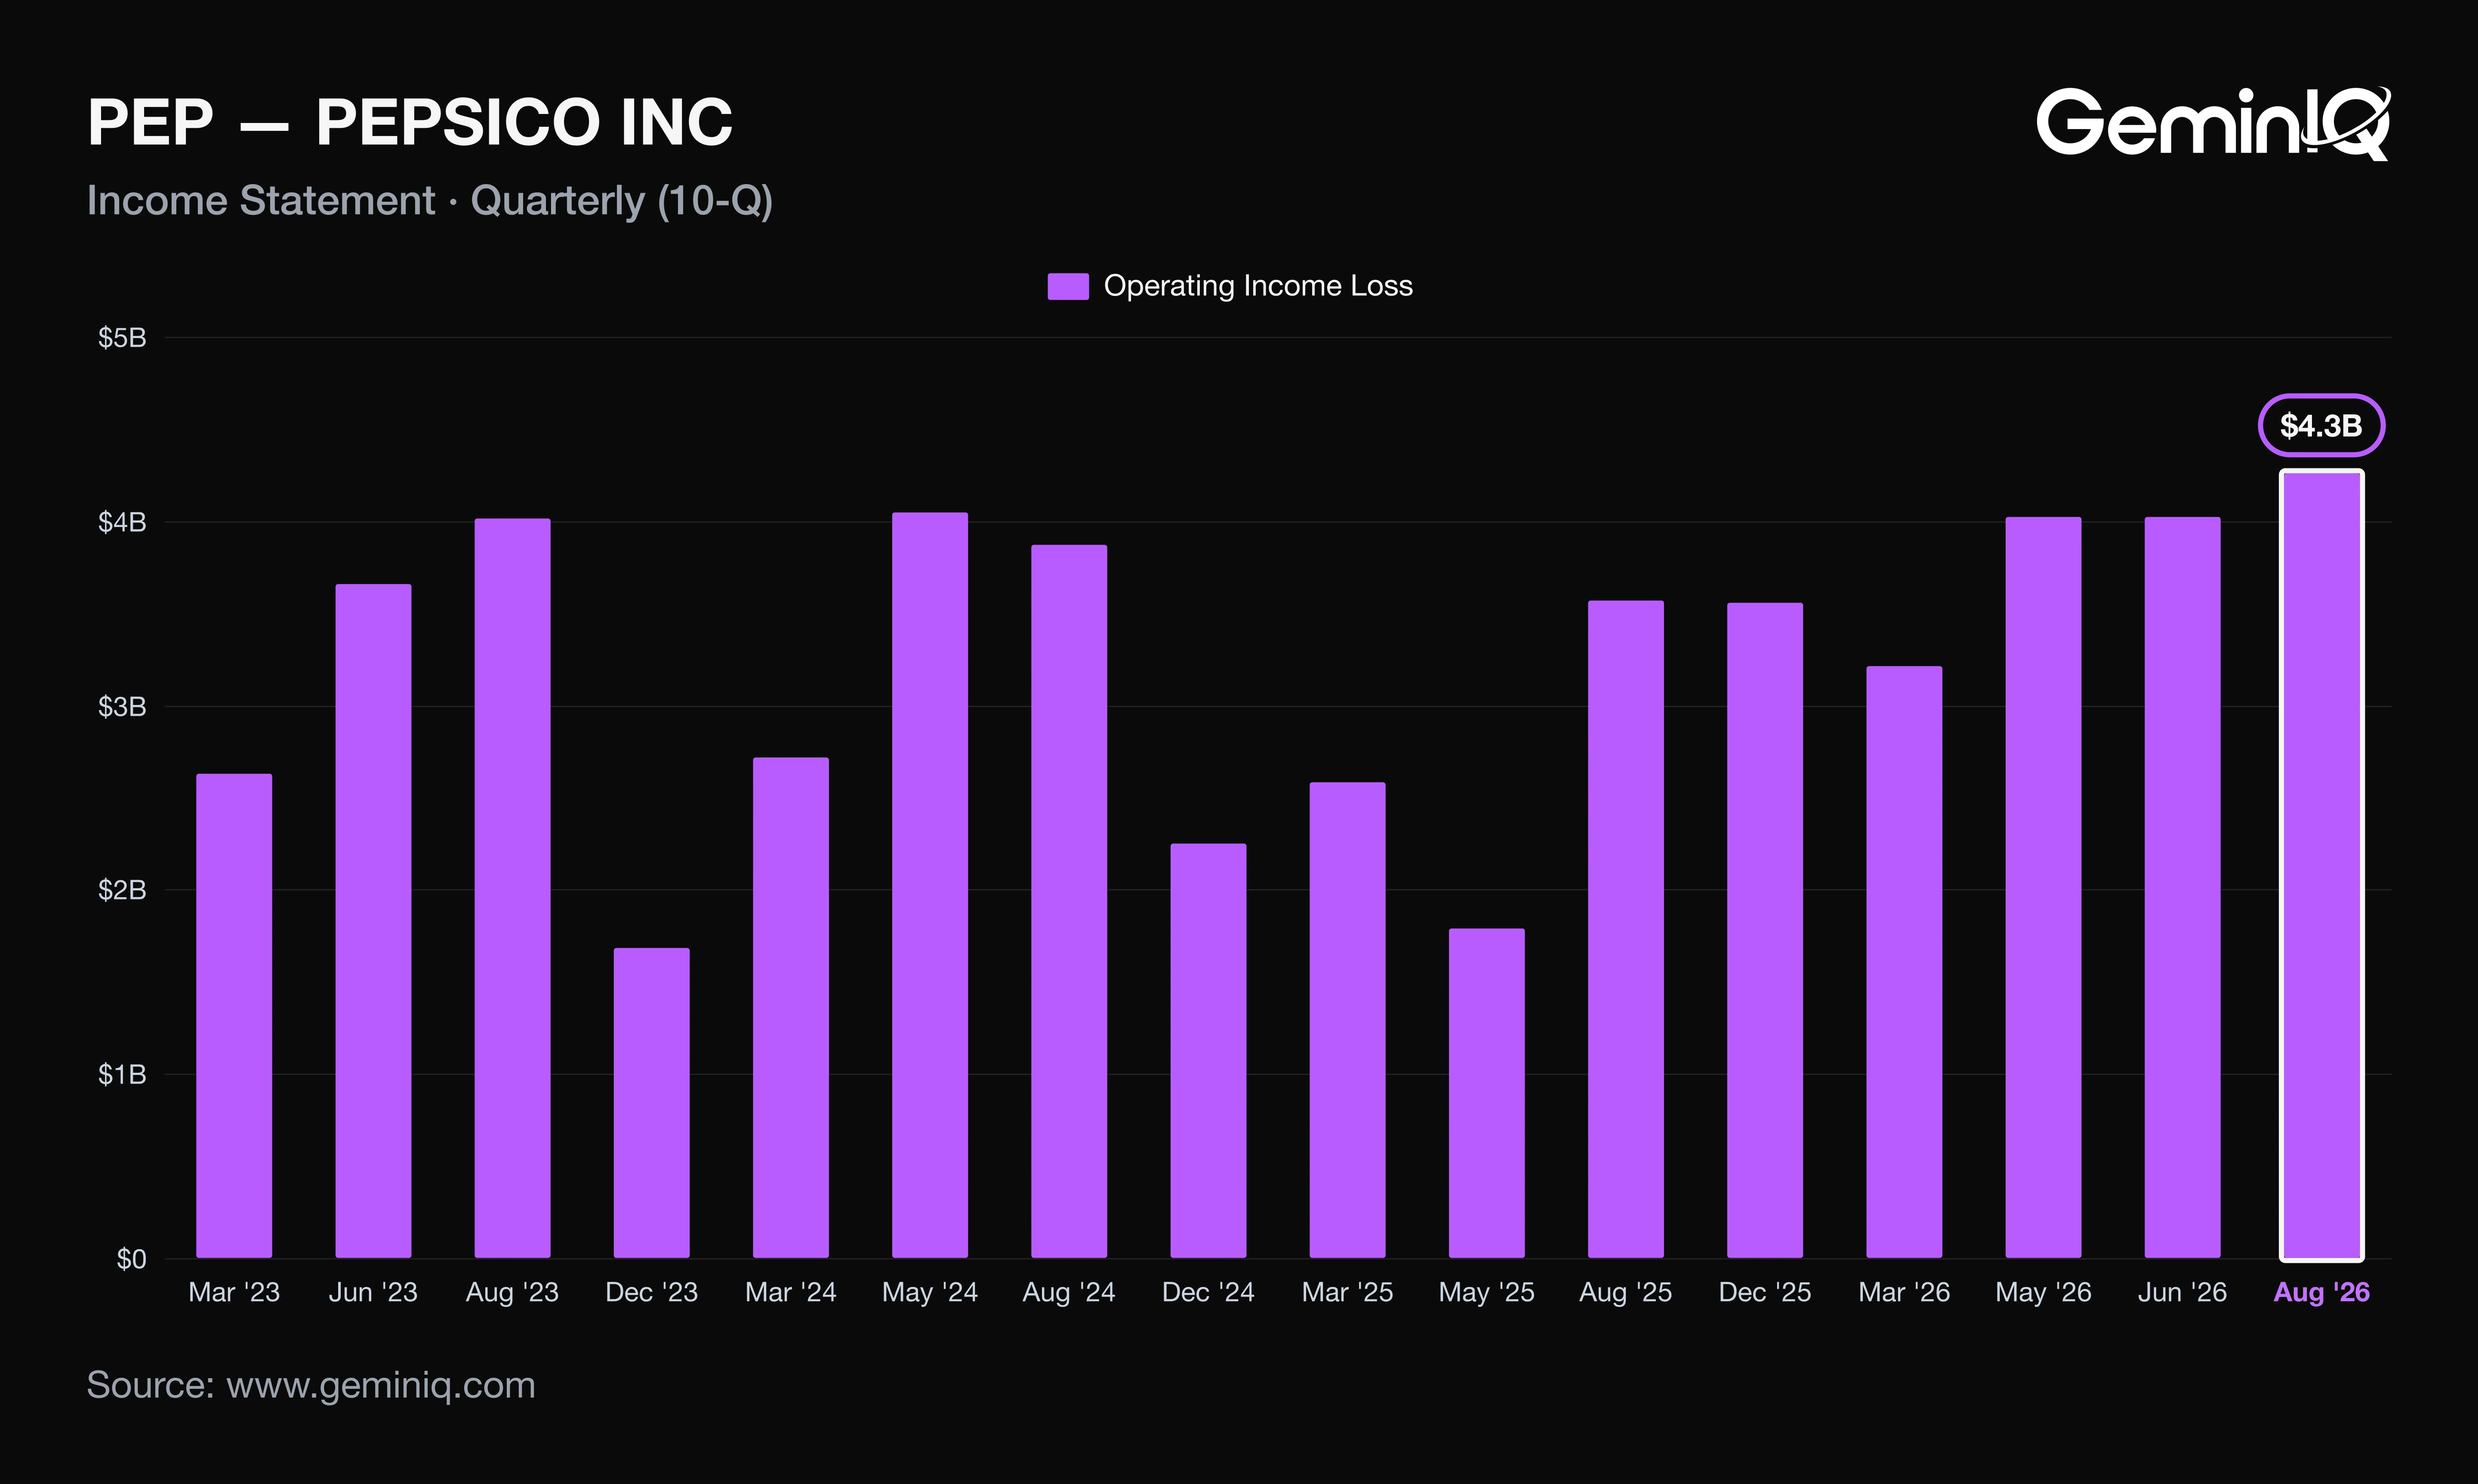
The Data: Operating income rose to $4.26 billion from $3.57 billion, up 19.4%, the highest of the last 16 quarters. The tax rate was 21.4% in both quarters, diluted shares fell 0.4% to 1,367 million, and net interest expense fell $22 million. Gross margin of 54.4% was the seventh-lowest of the last 16 quarters, so the margin gain did not start at gross profit.
Why: Share count contributed about 0.4 points of the 17.4% and tax none, which leaves operating profit. SG&A grew 4.1% against revenue growth of 5.6%, and a $133 million impairment, primarily the Rockstar brand, in the prior-year quarter did not recur, per the 8-K. GeminIQ's pre-calculated Operating Profit Margin (TTM) rose 5.64 points to 16.67%, more than three times the quarter's 1.9-point gain, because the year-ago trailing period carried the 2025 impairments. An operating margin at its third-highest level in the last 16 quarters is partly a comparison against a charge-laden base.
What PepsiCo's Q3 FY2026 10-Q Shows Beyond the Press Release
PepsiCo's 10-Q filed October 8, 2026 reports operating profit up 19%, while the 8-K's reconciliation shows core operating profit up 3%, to $4.28 billion from $4.14 billion. A reader who saw EPS up 17% would expect operating profit to have grown on operations. Instead items the company excludes from core swung by $551 million, about 80% of the $691 million reported gain.
The Data: Excluded items added back $568 million in the prior-year quarter and $17 million this year, derived from the 8-K reconciliation. Core operating margin fell 35 basis points to 16.9% while reported margin rose 195. The 8-K attributes 4 points of core operating profit growth to tariff refunds, which leaves core operating profit down roughly 1% without them (derived).
Why: The 10-Q lists productivity savings and pricing among the drivers, and the reconciliation shows those are the 3%, not the 19%. The refunds are cash PepsiCo says it has substantially received after the Supreme Court ruled many IEEPA tariffs invalid, so they are real, but they recover past payments rather than set a run rate.
PepsiCo Q3 FY2026 Free Cash Flow, Dividends and Debt
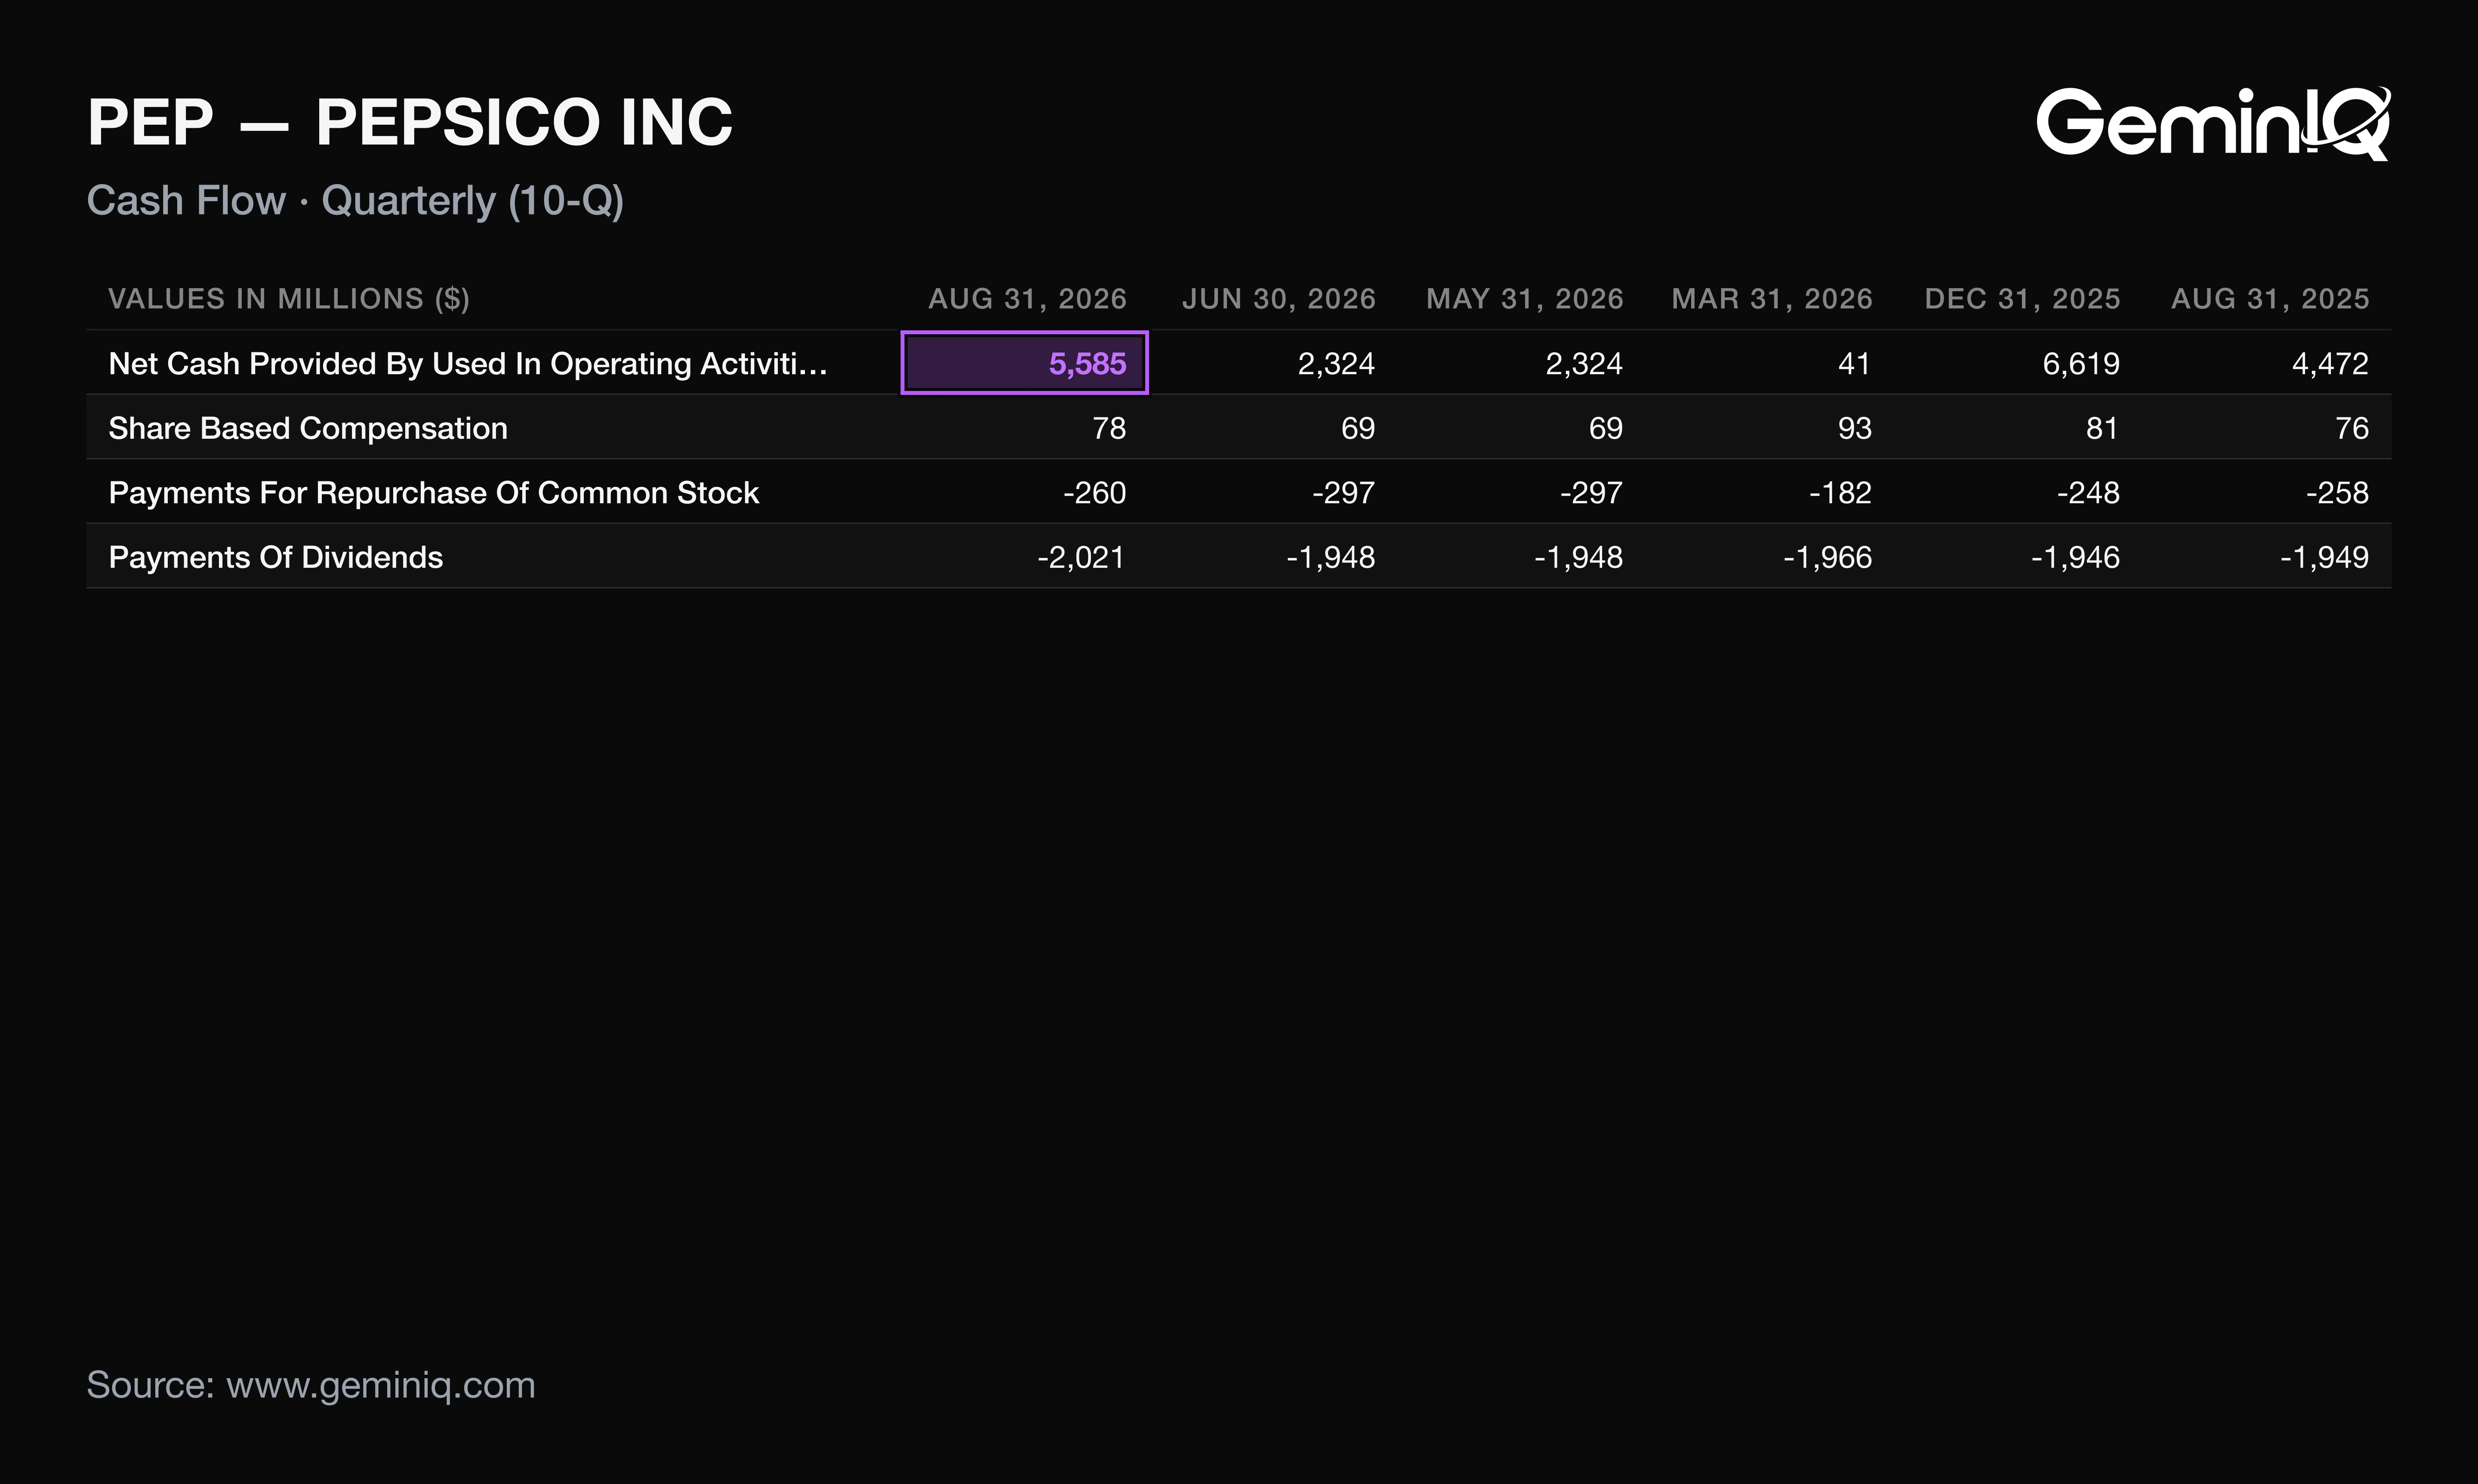
PepsiCo's Q3 FY2026 operating cash flow was $5.58 billion, up 24.9% from $4.47 billion, and free cash flow (operating cash flow less capital expenditure) was $4.67 billion, the second-highest of the last 16 quarters. The trailing year tells a different story.
The Data: Operating cash flow was $2.32 billion in the prior quarter, so Q3 was 140% higher sequentially. Trailing-twelve-month operating cash flow fell 12.6% to $10.27 billion, while GeminIQ's pre-calculated Free Cash Flow rose 7.1% to $7.27 billion. Dividends paid over the same twelve months were $7.88 billion, 108% of that free cash flow, although Q3's $2.02 billion dividend was 43% of the quarter's. Net debt to EBITDA improved to 2.17x from 3.15x per GeminIQ's Net Debt to EBITDA.
Why: Free cash flow rose while operating cash flow fell because the gap between them, mostly capital spending, shrank from about $5.0 billion to $3.0 billion (derived). Capex of $916 million was the eighth-lowest of the last 16 quarters. Buybacks were $739 million in 36 weeks against $247 million of share-based compensation, and diluted shares reached their lowest in 16 quarters, so the repurchases did more than offset dilution. PepsiCo's dividend is covered by one strong quarter, not yet by the year.
PepsiCo's 2026 Guidance After Q3
In its October 8, 2026 8-K, PepsiCo guided fiscal 2026 core EPS growth of +2.5% to +3.5%, down from the low end of +5% to +7% in July, while raising net revenue growth to approximately +6% from +4% to +6%. Revenue guidance went up and profit guidance came down.
The Data: Core constant currency EPS growth is now +1% to +2%, from the low end of +4% to +6%. The core tax rate guide fell to approximately 21% from 22%. Organic revenue growth is approximately +3%, inside the previous +2% to +4%; the foreign exchange tailwind and net acquisitions each rose to 1.5 points from 1. Core EPS grew 5% over the first 36 weeks.
Why: The revenue raise came from currency and acquisitions, one point combined, with none from organic growth. EPS guidance fell despite a one-point lower tax rate, which means the company lowered its operating profit expectations. A 5% year-to-date gain against a full-year range of 2.5% to 3.5% implies core EPS declines in the fourth quarter. The 8-K says additional structural cost reduction actions are being identified to mitigate "rising input cost inflation."
How PEP Stock Has Moved After Past Earnings Reports
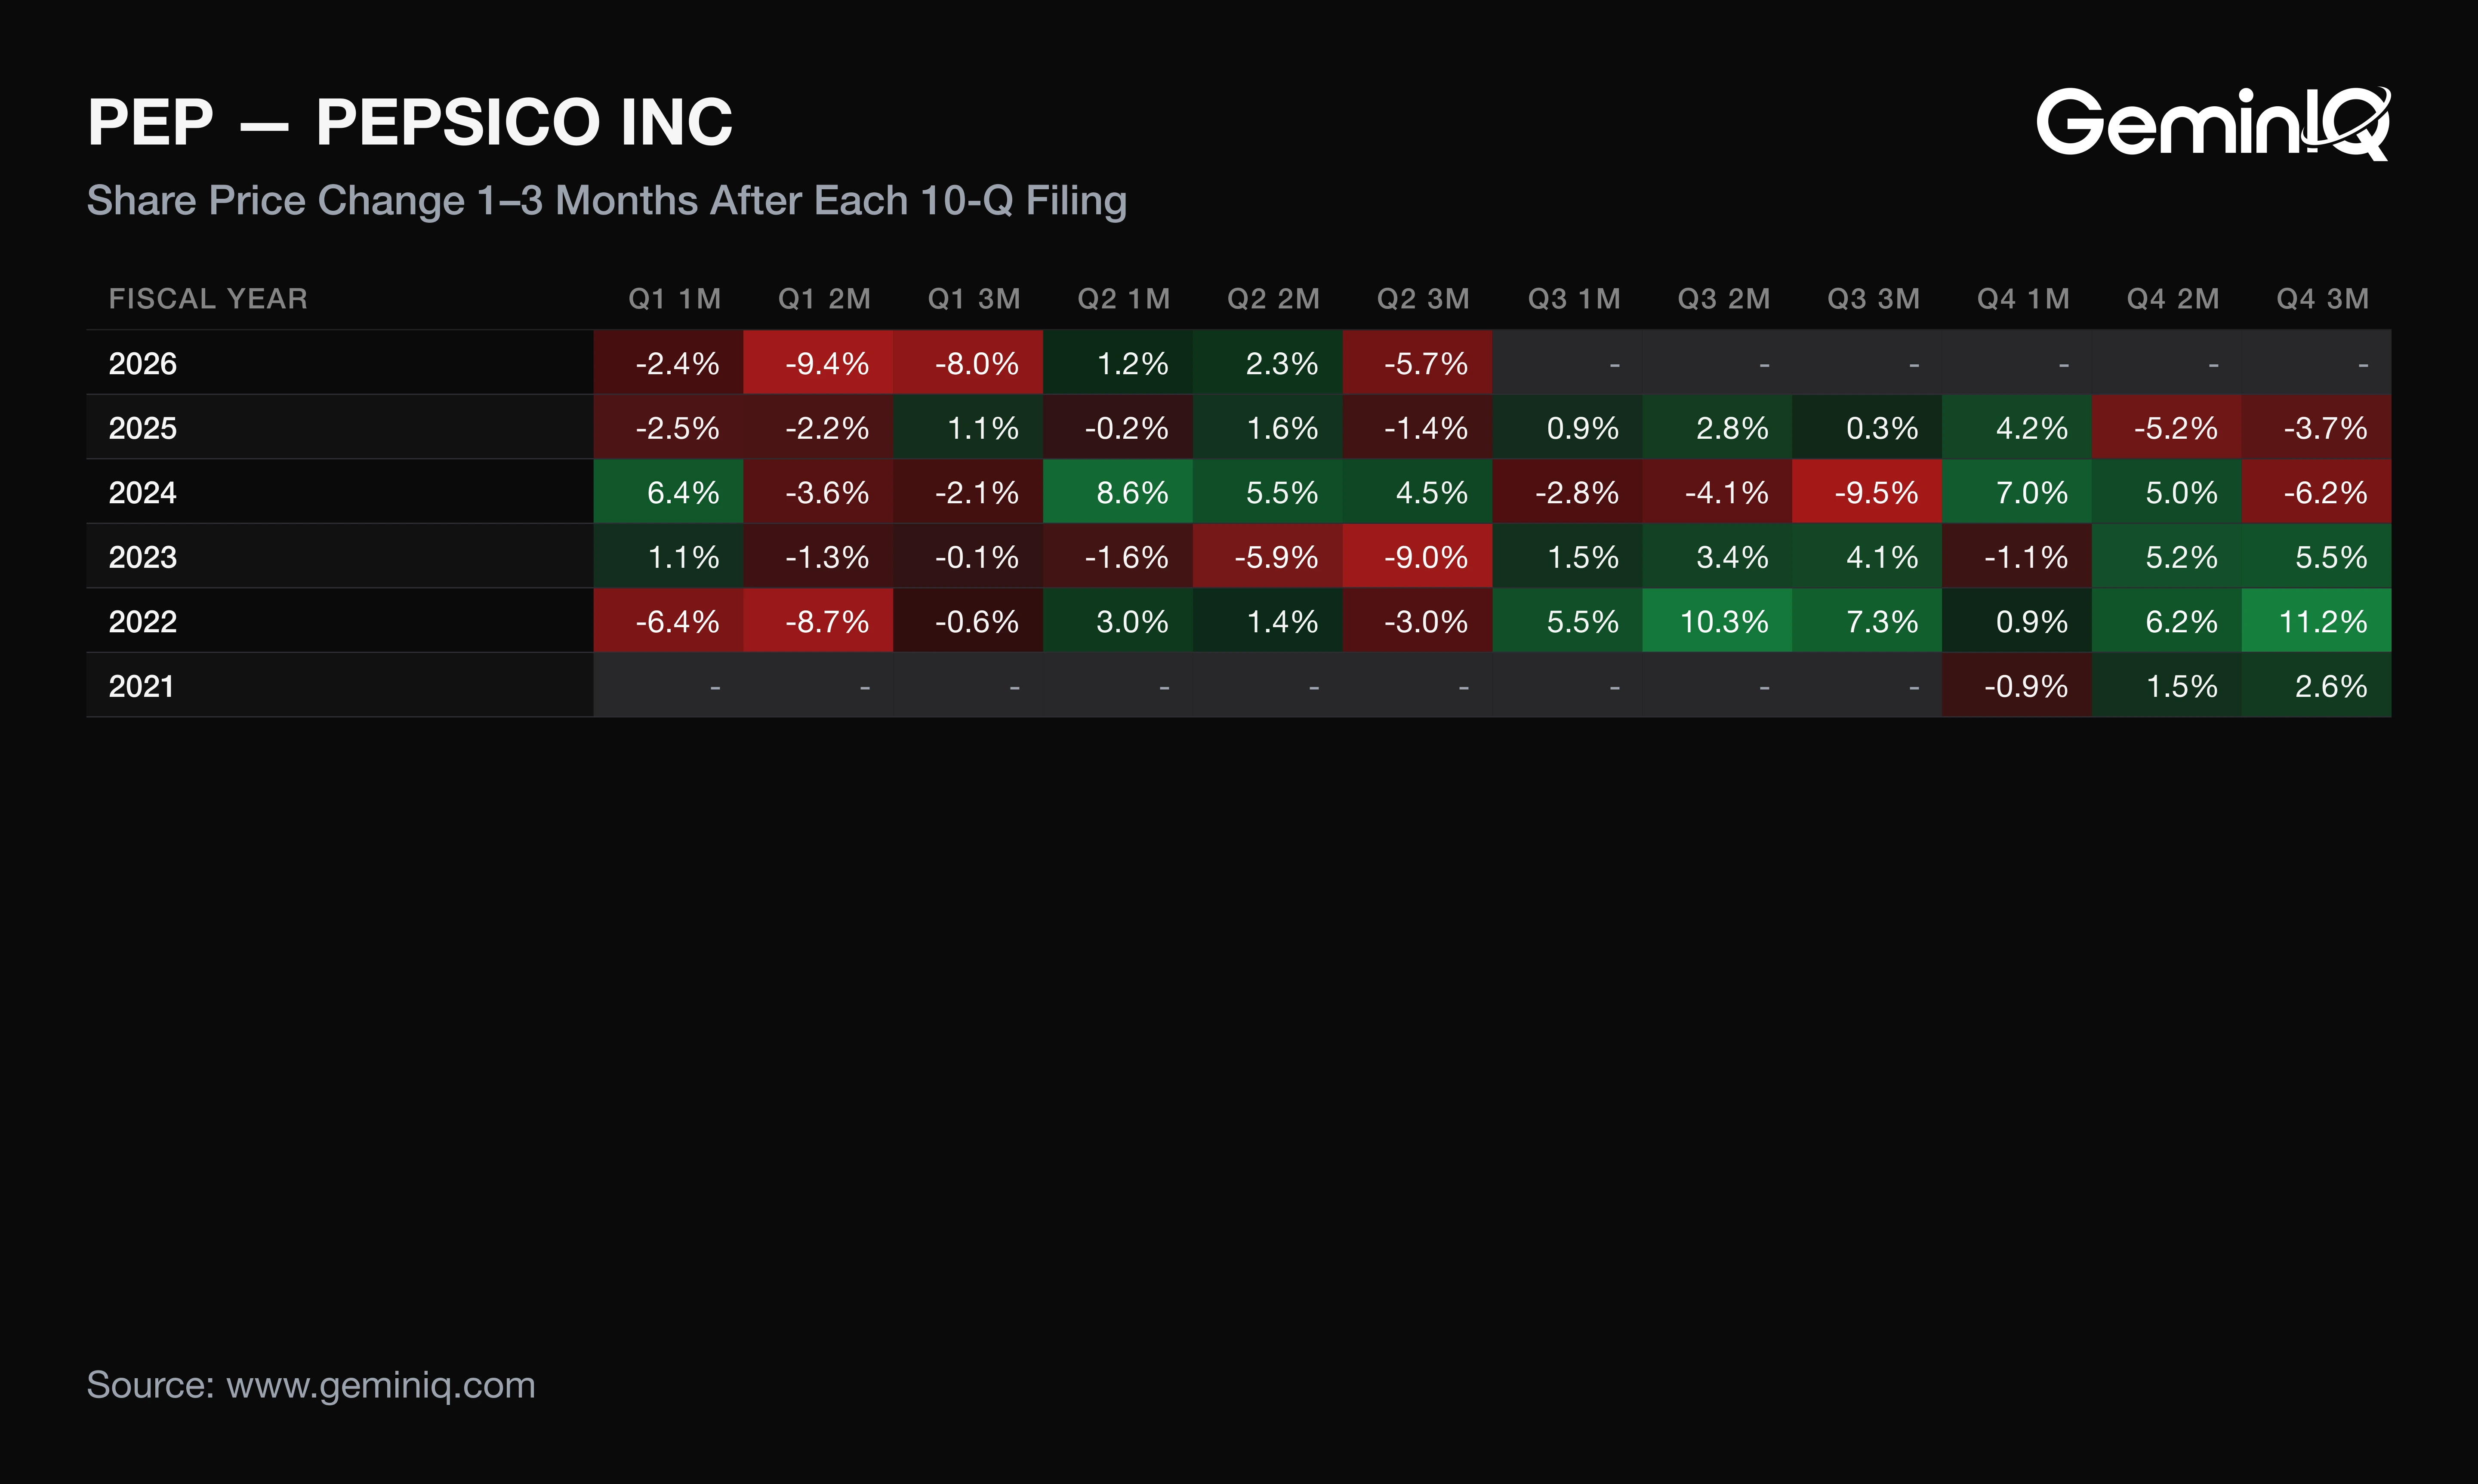
Across the last 12 PepsiCo 10-Q filings with a completed one-month window, filed 2023-10-10 to 2026-07-09, the median one-month return was +1.1%, positive after 7 of 12, and the median three-month return was -1.7%, positive after 5 of 12. These figures describe how PepsiCo's stock moved after its past filings; they are a historical association, not a forecast.
The Data: One-month returns ranged from -2.8% (FY2024 Q3) to +8.6% (FY2024 Q2). Past Q3 filings were followed by one- and three-month returns of +1.5% and +4.1% (FY2023), -2.8% and -9.5% (FY2024), and +0.9% and +0.3% (FY2025). The Q3 FY2026 row has no returns yet because its window has not elapsed.
Why: The best and worst one-month windows came three months apart in the same fiscal year, so a filing date alone separated little. The GeminIQ Earnings Reaction Heat Map shows each window against the company's own distribution.
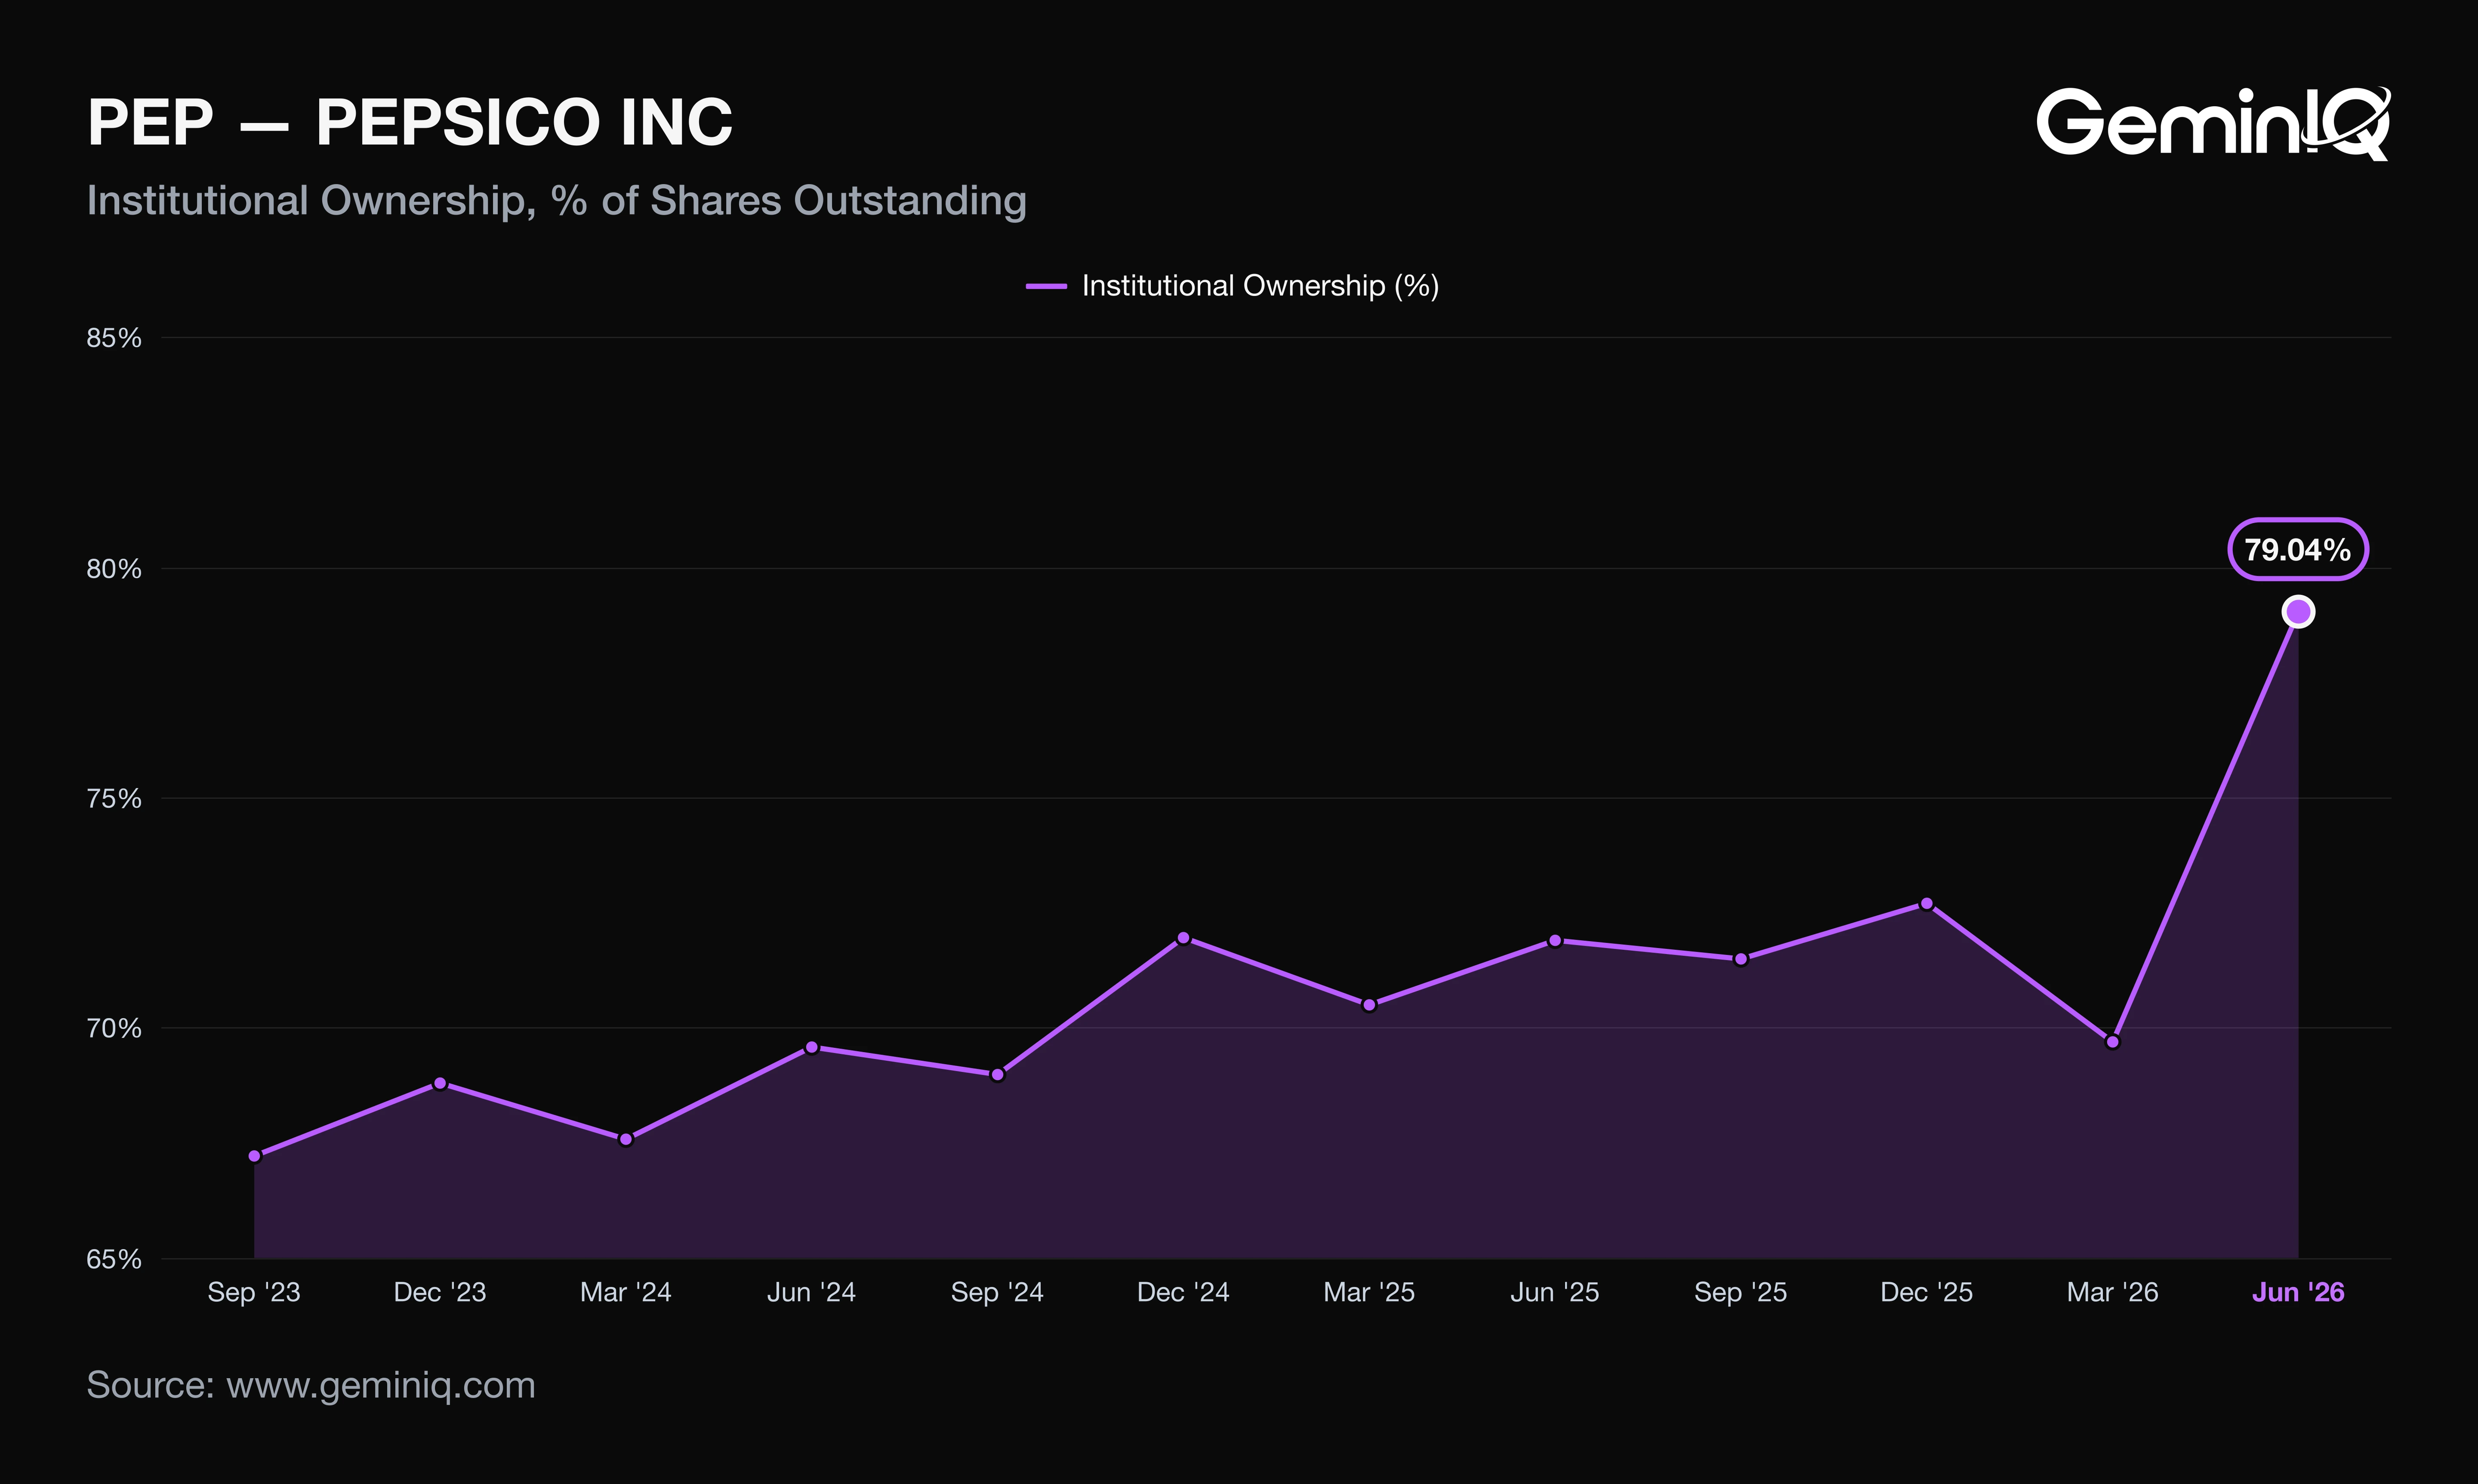
Institutions held 79.04% of PepsiCo shares at the June 30, 2026 SEC Form 13F quarter end, the highest of the last 16 quarters and up from 71.90% a year earlier. SEC Form 4 data through March 4, 2026 shows two sales totaling $5.3 million in the prior 12 months, against 10 sales totaling $22.7 million the year before, and no purchases since February 27, 2013.
A quarter whose reported profit growth runs several times ahead of the company's own core measure has already counted the items that flattered it.
Frequently Asked Questions
Is PepsiCo doing well financially?
PepsiCo's trailing-twelve-month net profit margin was 12.19% as of Q3 FY2026, up from 7.85% a year earlier. GeminIQ's pre-calculated Return on Invested Capital (ROIC) was 19.03%, up 5.72 points. Both comparisons lap the 2025 impairment charges, so they overstate the underlying improvement.
When does PepsiCo report earnings?
PepsiCo reported Q3 FY2026 results on October 8, 2026. Last year it filed its fourth-quarter results on February 3, 2026, and its Q3 FY2025 filing came on October 9, 2025. That is a pattern from the filing record, not a forecast of the next date.
Does PepsiCo pay a dividend?
Yes. PepsiCo paid $2.02 billion of dividends in Q3 FY2026, the highest of the last 16 quarters, and $7.88 billion over the trailing twelve months, up 4.4%. The 8-K guides 2026 dividends of $7.9 billion within $8.9 billion of total cash returns.
What is PepsiCo's current revenue?
PepsiCo's Q3 FY2026 net revenue was $25.27 billion, and 36-week revenue was $68.90 billion, up 6.7%. The 8-K puts 36-week organic revenue growth at 2.7%.
Wall Street's data. Main Street's price.
Institutional terminals charge thousands a year for as-filed accuracy. GeminIQ gives you the same thing for a fraction of the cost: financials built directly from raw SEC EDGAR filings, not third-party APIs, with full XBRL traceability back to the original 10-K or 10-Q. No normalized guesswork, just calculated metrics, charts, screeners, and watchlists built on numbers exactly as the company reported them. Start researching now at GeminIQ.com.
All financial figures cited in this article reference PepsiCo, Inc.'s Q3 2026 10-Q (filed October 8, 2026, period ending August 31, 2026), with guidance and management commentary drawn from the company's Form 8-K earnings release (filed October 8, 2026). All SEC filings are publicly available at SEC EDGAR and SEC EDGAR.
Disclaimer: The content in this blog is for educational and entertainment purposes only and does not constitute financial, legal, or tax advice. Investing involves risk, including the loss of principal. The views expressed are my own and not intended as financial advice or a guarantee of future performance.