
Philip Morris (PM) Q3 2026 Earnings: EPS -4.9%, Operating Income +14%

By Chad Hartman
Published · Last updated
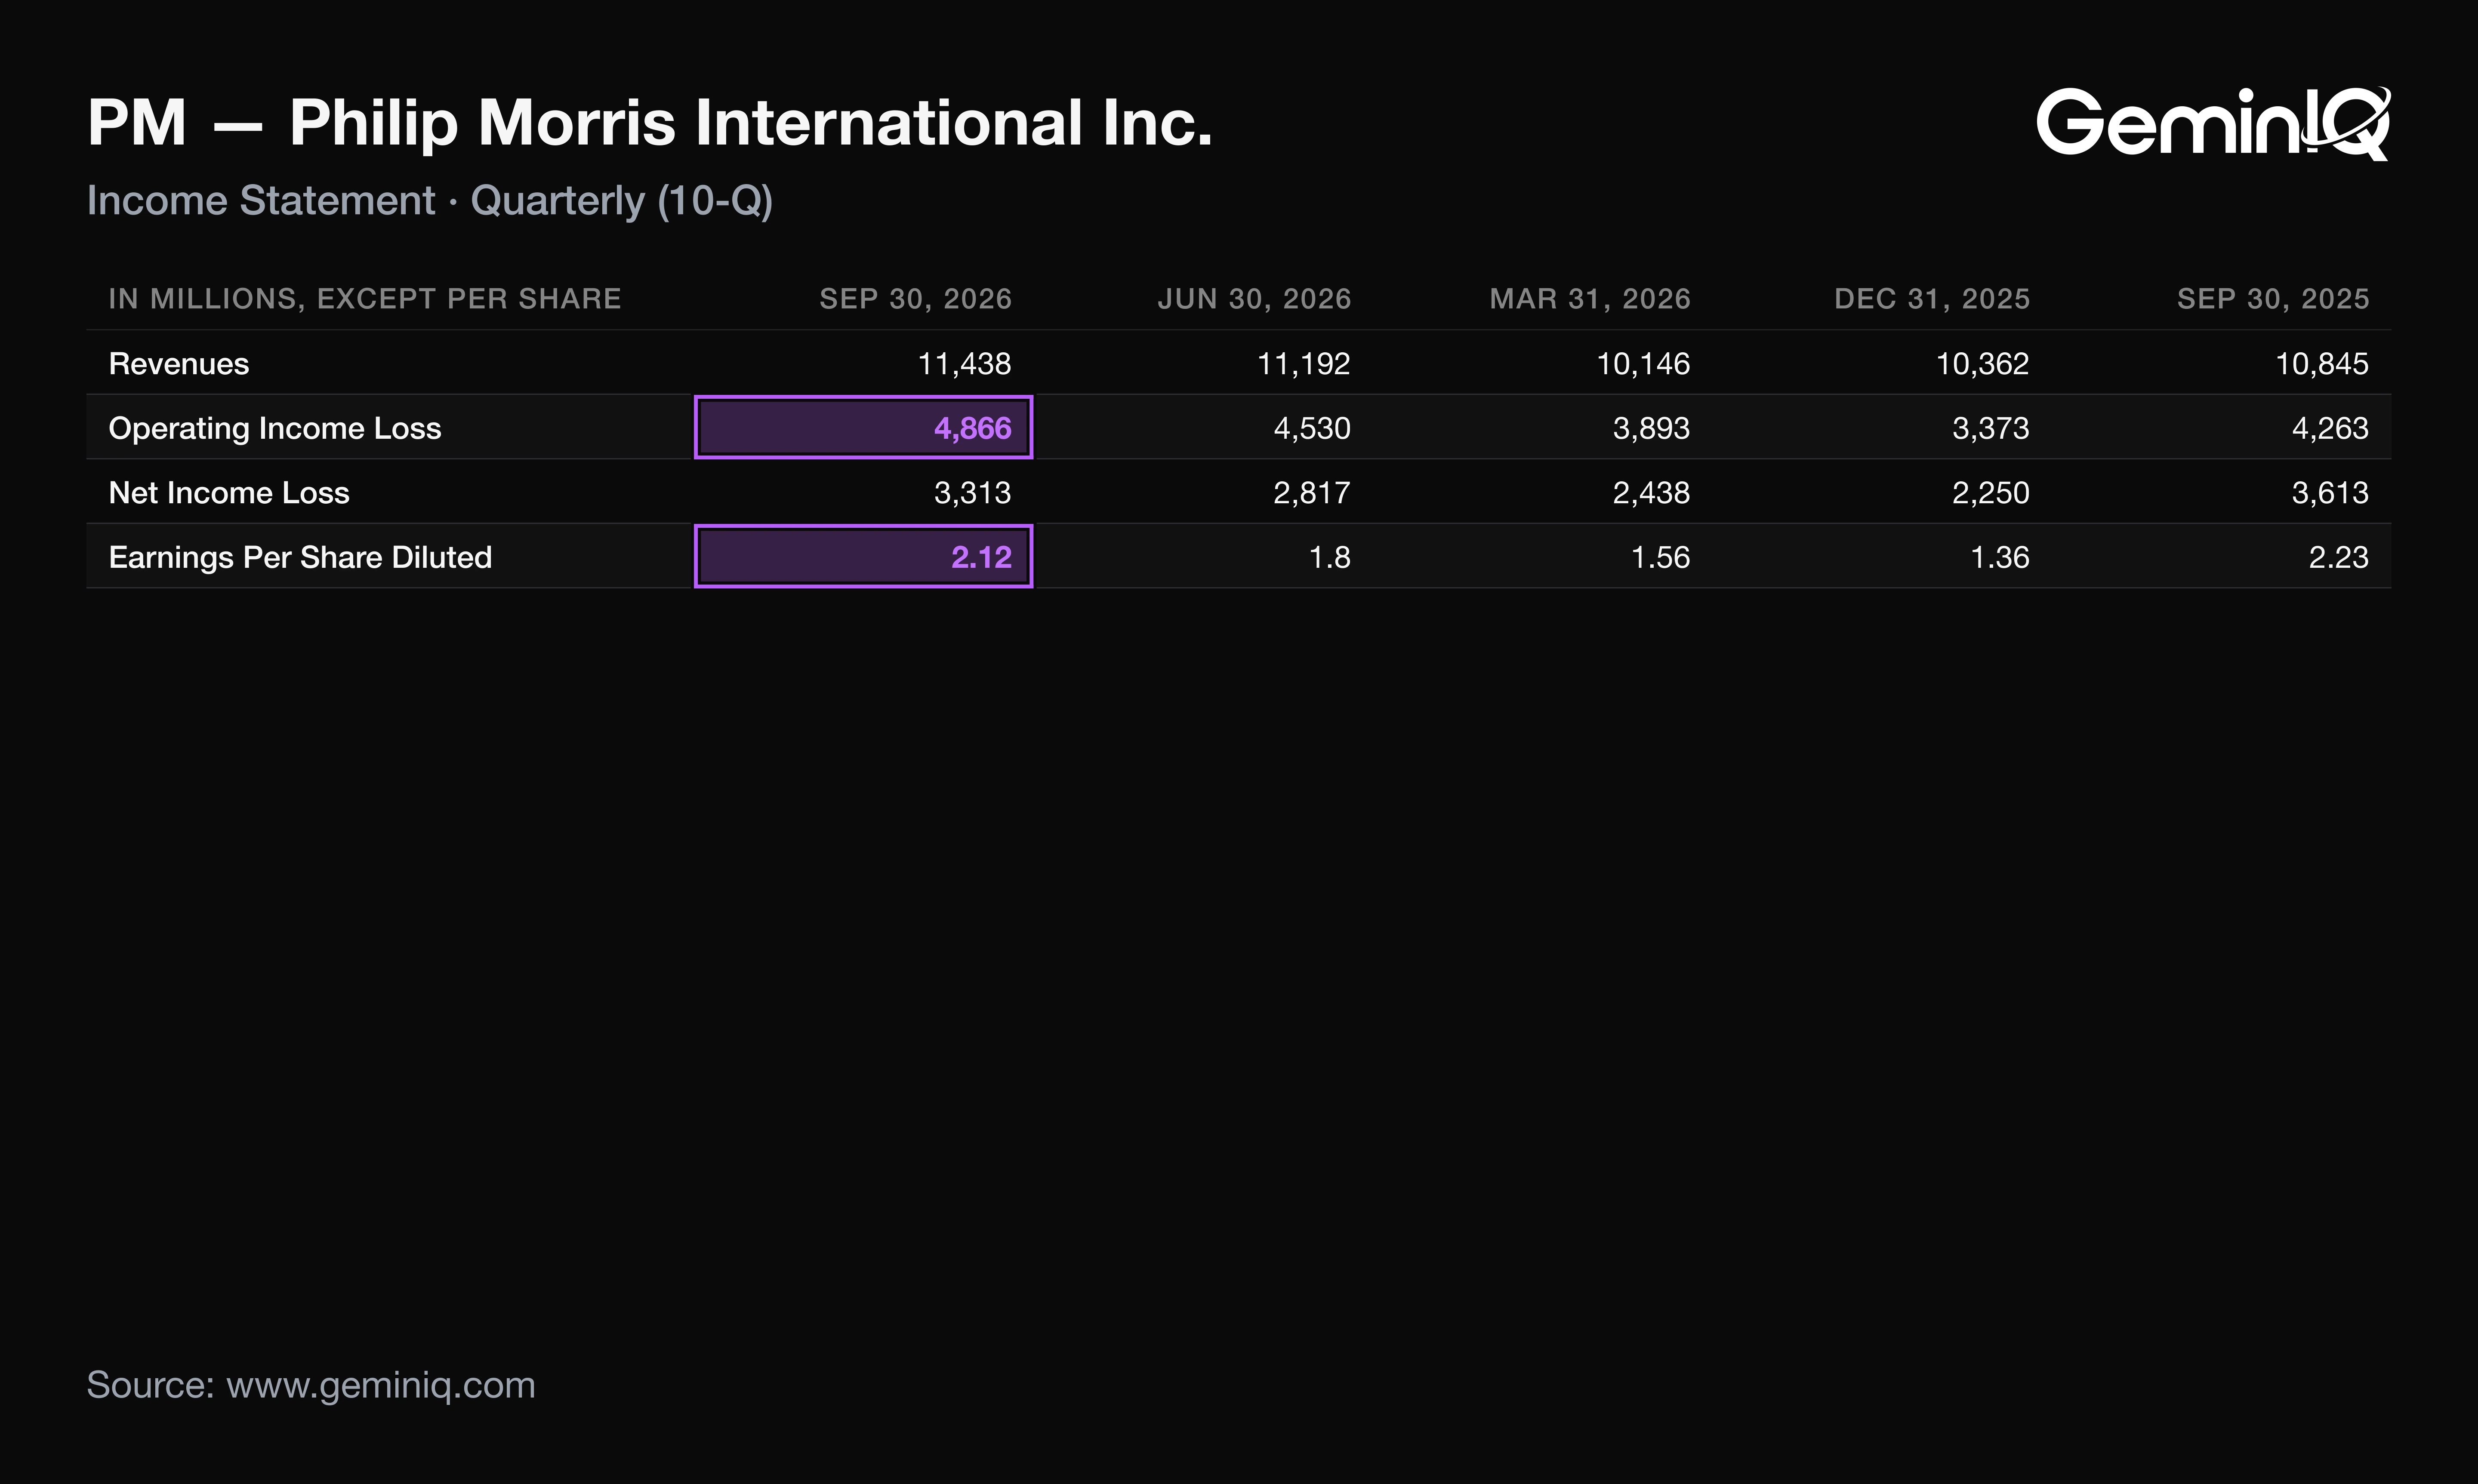
Philip Morris (PM) reported Q3 2026 revenue of $11.44 billion, up 5.5%, and diluted EPS of $2.12, down 4.9%, for the quarter ended September 30, 2026. Operating income rose 14.1% to a 16-quarter high, so the whole EPS decline originates below the operating line. The company released results on October 21 and filed its 10-Q on October 23; the release led with adjusted EPS of $2.36, up 5.4%, while the filing shows the growth in operating income came from price, not volume.
| Field | Value |
|---|---|
| Company | Philip Morris ($PM) |
| Quarter | Q3 FY2026, period ended September 30, 2026 |
| Earnings release | October 21, 2026 (Form 8-K) |
| 10-Q filed | October 23, 2026 |
| Revenue | $11.44 Billion (+5.5% YoY) |
| Diluted EPS | $2.12 (-4.9% YoY) |
| Operating margin | 42.5% (+3.2 pts YoY) |
| Operating cash flow (TTM) | $15.15 Billion |
| Operating income | $4.87 Billion (+14.1% YoY) |
Philip Morris Q3 2026 Revenue, EPS and Margins
Philip Morris's Q3 2026 diluted EPS was $2.12, down 4.9% from $2.23, while operating income rose 14.1% to $4.87 billion. Diluted shares were 1,560 million, up 0.1%, so the share count explains none of the decline.
The Data: Operating margin reached 42.5%, up 3.2 points and the highest of the last 16 quarters. Net margin was 29.0%, only the fifth-highest of the same 16. The 10-Q's EPS bridge starts at $2.24, last year's figure once its own items are stripped out, and adds $0.19 from operations and $0.02 from interest. It then subtracts $0.24 of itemized charges, $0.08 from the tax rate and $0.01 from currency.
Why: The fair value of the company's India and Sri Lanka equity securities swung from a $103 million after-tax gain in Q3 2025 to a $99 million loss, worth $0.13 per share, and a $74 million pre-tax Dutch pension buy-out loss took $0.04 more. The tax rate rose 2.8 points to 21.5% because Q3 2025 carried a benefit from an interest expense election. Together the charges and the tax rate cost $0.32 per share against the $0.19 operations added.
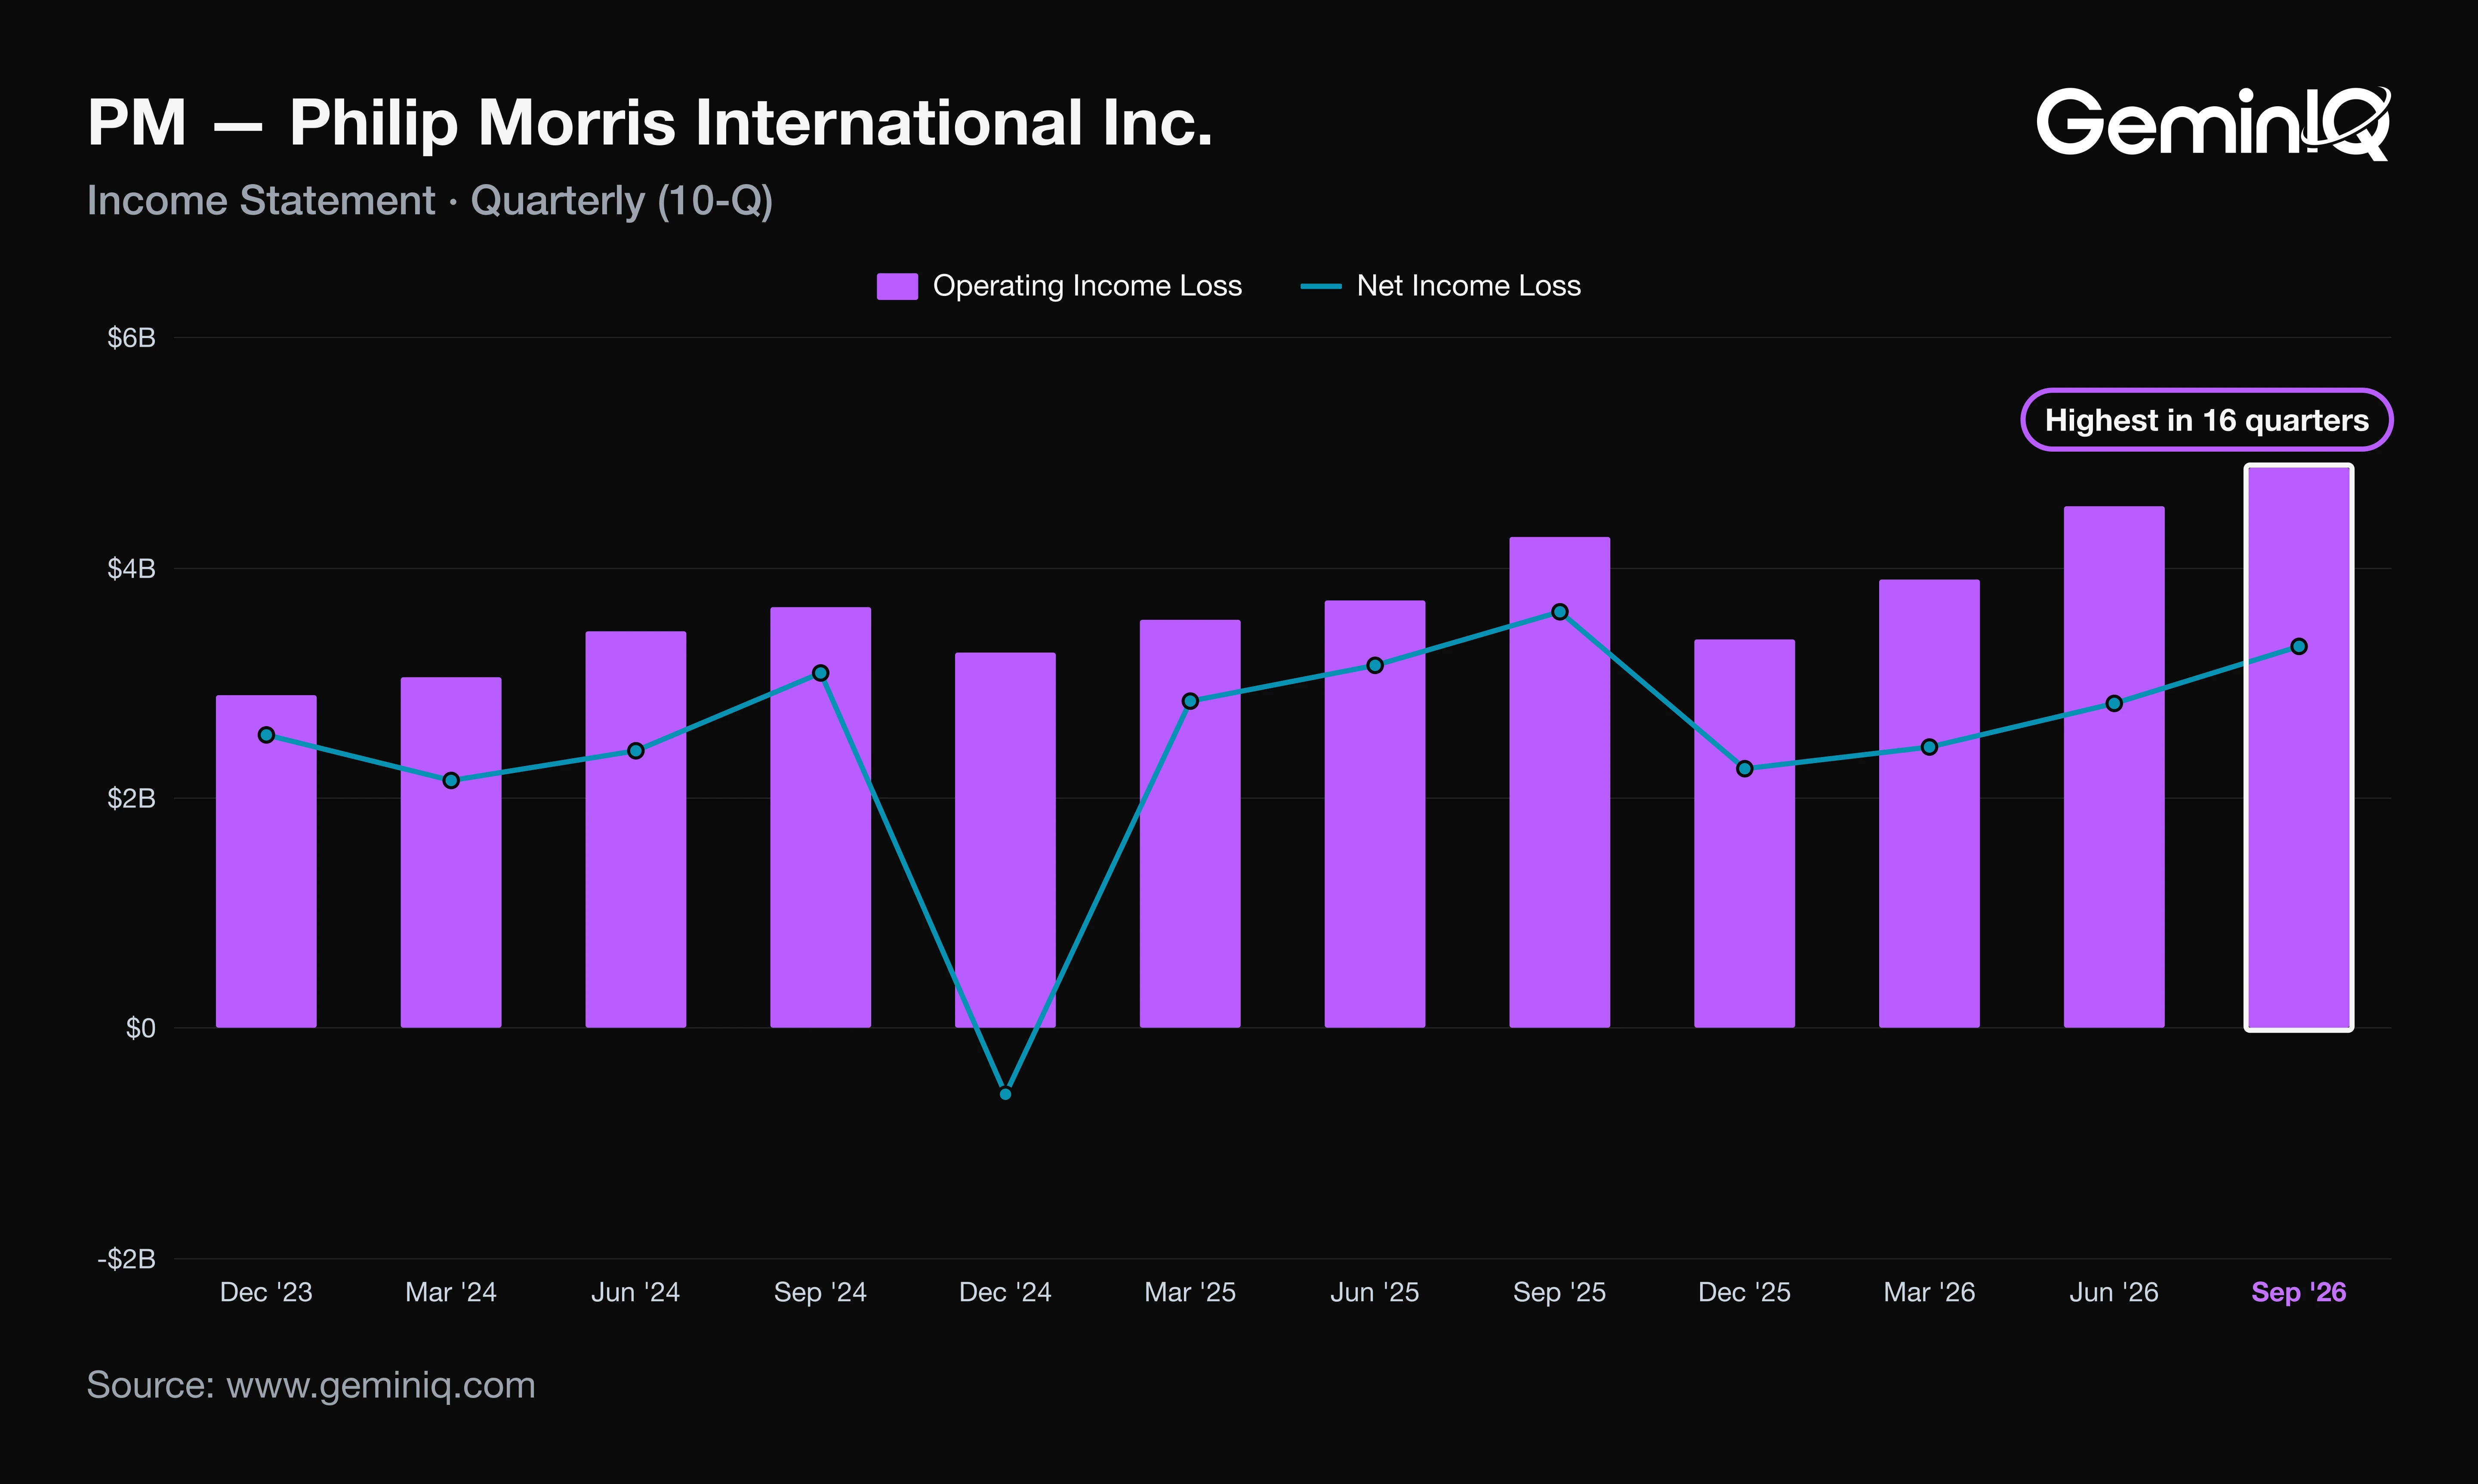
Operating income hit a 16-quarter high while net income, at $3.31 billion, ranked second-highest of the same 16 quarters.
What Philip Morris's Q3 2026 10-Q Shows Beyond the Press Release
Philip Morris's Q3 2026 gross profit rose $493 million to $7.85 billion, and the 10-Q's segment note shows International Combustibles supplied $366 million of it. The release framed the quarter around smoke-free momentum and a company "on track" for a sixth straight year of volume growth.
A reader who saw that framing would expect smoke-free to carry the profit. Instead International Smoke-Free gross profit grew $22 million (+0.8%), and the U.S. segment's $105 million gain came largely from lapping last year's promotions, per the release.
The Data: The operating review shows price of $739 million against total net revenue growth of $593 million; volume, mix and other added $36 million. Operating income rose $603 million, with price at $739 million, volume/mix at minus $23 million and costs at minus $71 million. Shipments grew 0.6%.
Why: Management attributes the pricing to international combustibles, where the release cites 8.9% pricing, and to the U.S. segment. Without price, operating income would have fallen $136 million. The comparison base also flatters: Q3 2025 absorbed a $176 million German excise tax charge, so adjusted operating income, per the release, grew 9.6% against the reported 14.1%. The release adds that a favorable restructuring of distribution terms in certain markets is "not expected to recur at the same level."
Smoke-free demand is stronger than its shipments suggest, though: the release reports adjusted in-market sales for the segment up 8.0%, and attributes flat revenue to Japanese shipment phasing. Price supplied the profit, and the 42.5% margin rests on it.
Philip Morris Q3 2026 Operating Cash Flow, Dividends and Debt
Philip Morris generated Q3 2026 operating cash flow of $5.35 billion, up 19.9% from a year earlier and the second-highest of the last 16 quarters. Cash flow strengthened in the quarter the income statement weakened.
The Data: Operating cash flow was 1.62 times net income, against 1.24 times a year earlier. Net income fell 8.3% while operating cash flow rose. Capital expenditure was $382 million, leaving free cash flow of $4.97 billion, and the $2.30 billion of dividends paid consumed 46% of it. GeminIQ's pre-calculated Net Debt to EBITDA fell to 2.45x from 3.11x.
Why: The fair value loss on equity securities is non-cash, per the release, so it reduced net income without touching operating cash flow. Debt, not shares, absorbed the surplus: long-term debt carried at $45.04 billion against $48.67 billion at December 31, 2025, while commercial paper of $1.88 billion appeared on the balance sheet. The 8-K guides to no share repurchases, and the share count was flat.
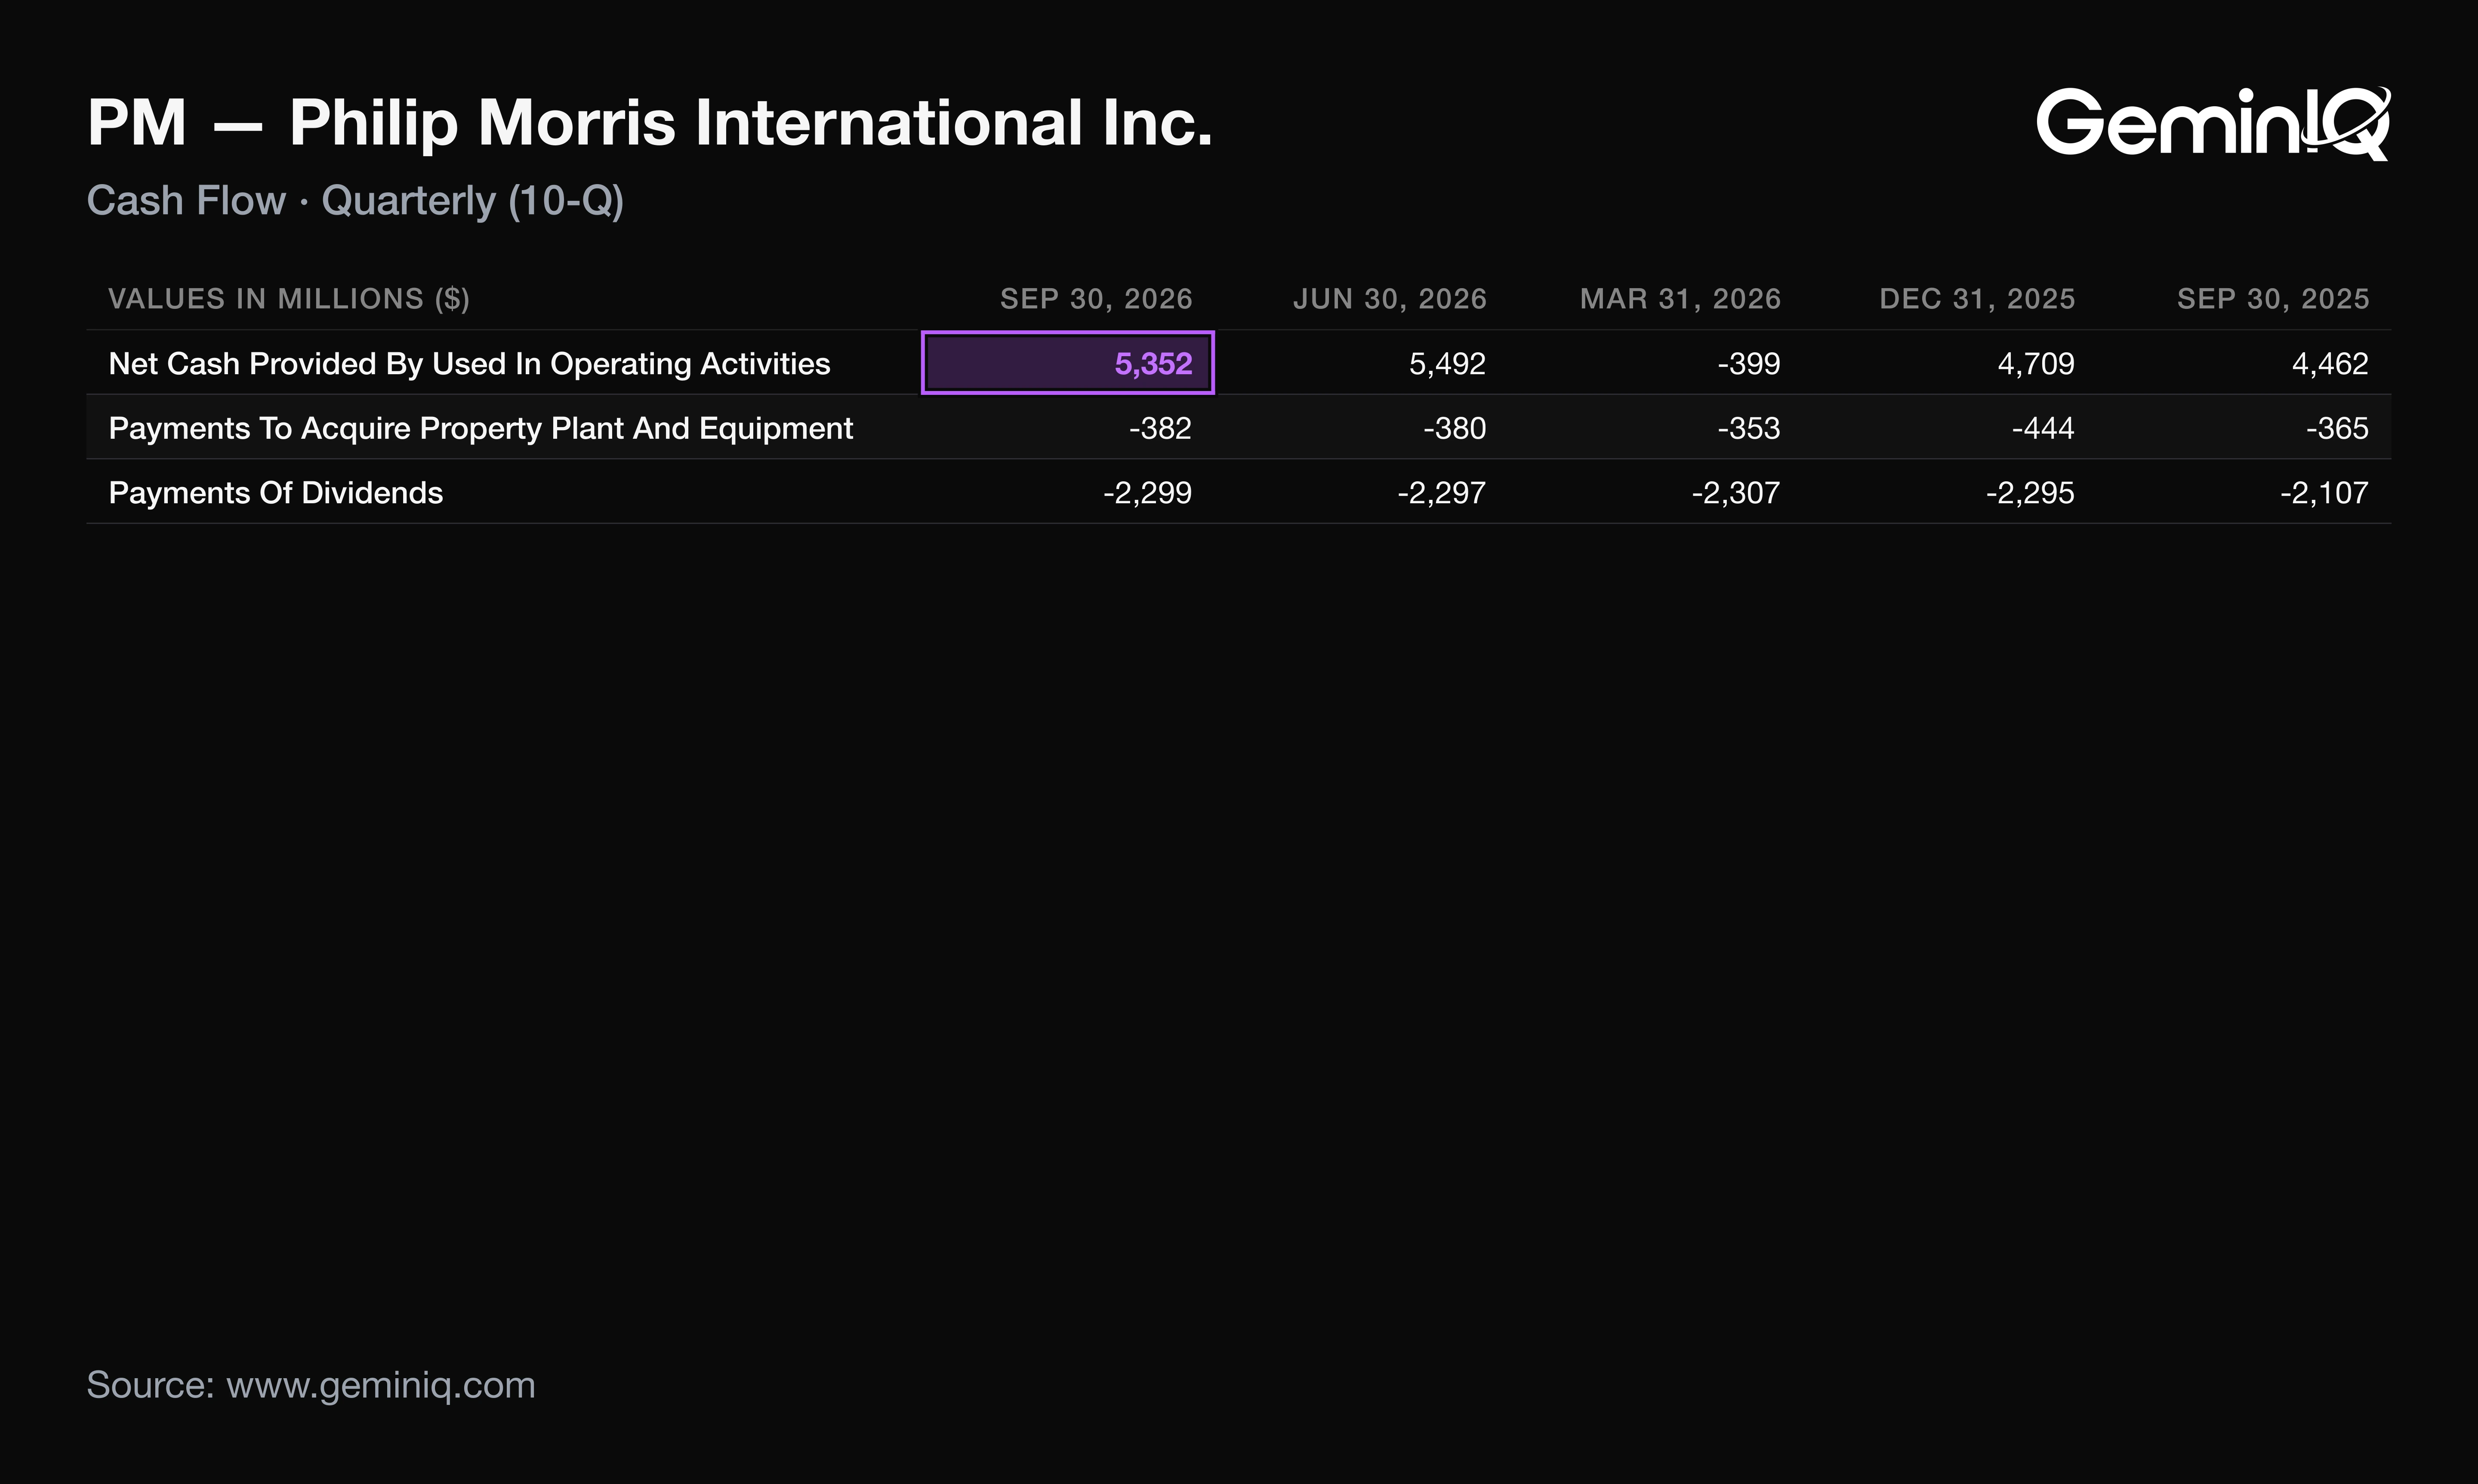
The company guided 2026 operating cash flow of around $13.5 billion in the 8-K, below the $15.15 billion trailing twelve months.
Philip Morris's 2026 Guidance After Q3
Philip Morris's 8-K forecasts 2026 adjusted diluted EPS of $8.29 to $8.44, up 9.9% to 11.9% from $7.54, and describes the update as currency only: the favorable currency effect was cut to $0.18 from $0.24.
The Data: Adjusted EPS was $6.52 for nine months, per the 8-K. The full-year range therefore implies a fourth quarter of $1.77 to $1.92, 19% to 25% below Q3's $2.36. Against the $1.71 implied for Q4 2025 ($7.54 less $5.83), that is growth of 3.5% to 12.3%. Both Q4 figures are derived from 8-K numbers.
Why: The company cites a further step-up in U.S. ZYN investment, a slightly larger energy-cost effect and a distribution-terms benefit that will not recur at the same level. It guides organic operating income growth of 7% to 9%, "middle or lower-half" more likely, after Q3's 10.5% and 7.7% for nine months.
Q3's all-time-high adjusted EPS is the quarter the company's own range guides away from.
How PM Stock Has Moved After Past Earnings Reports
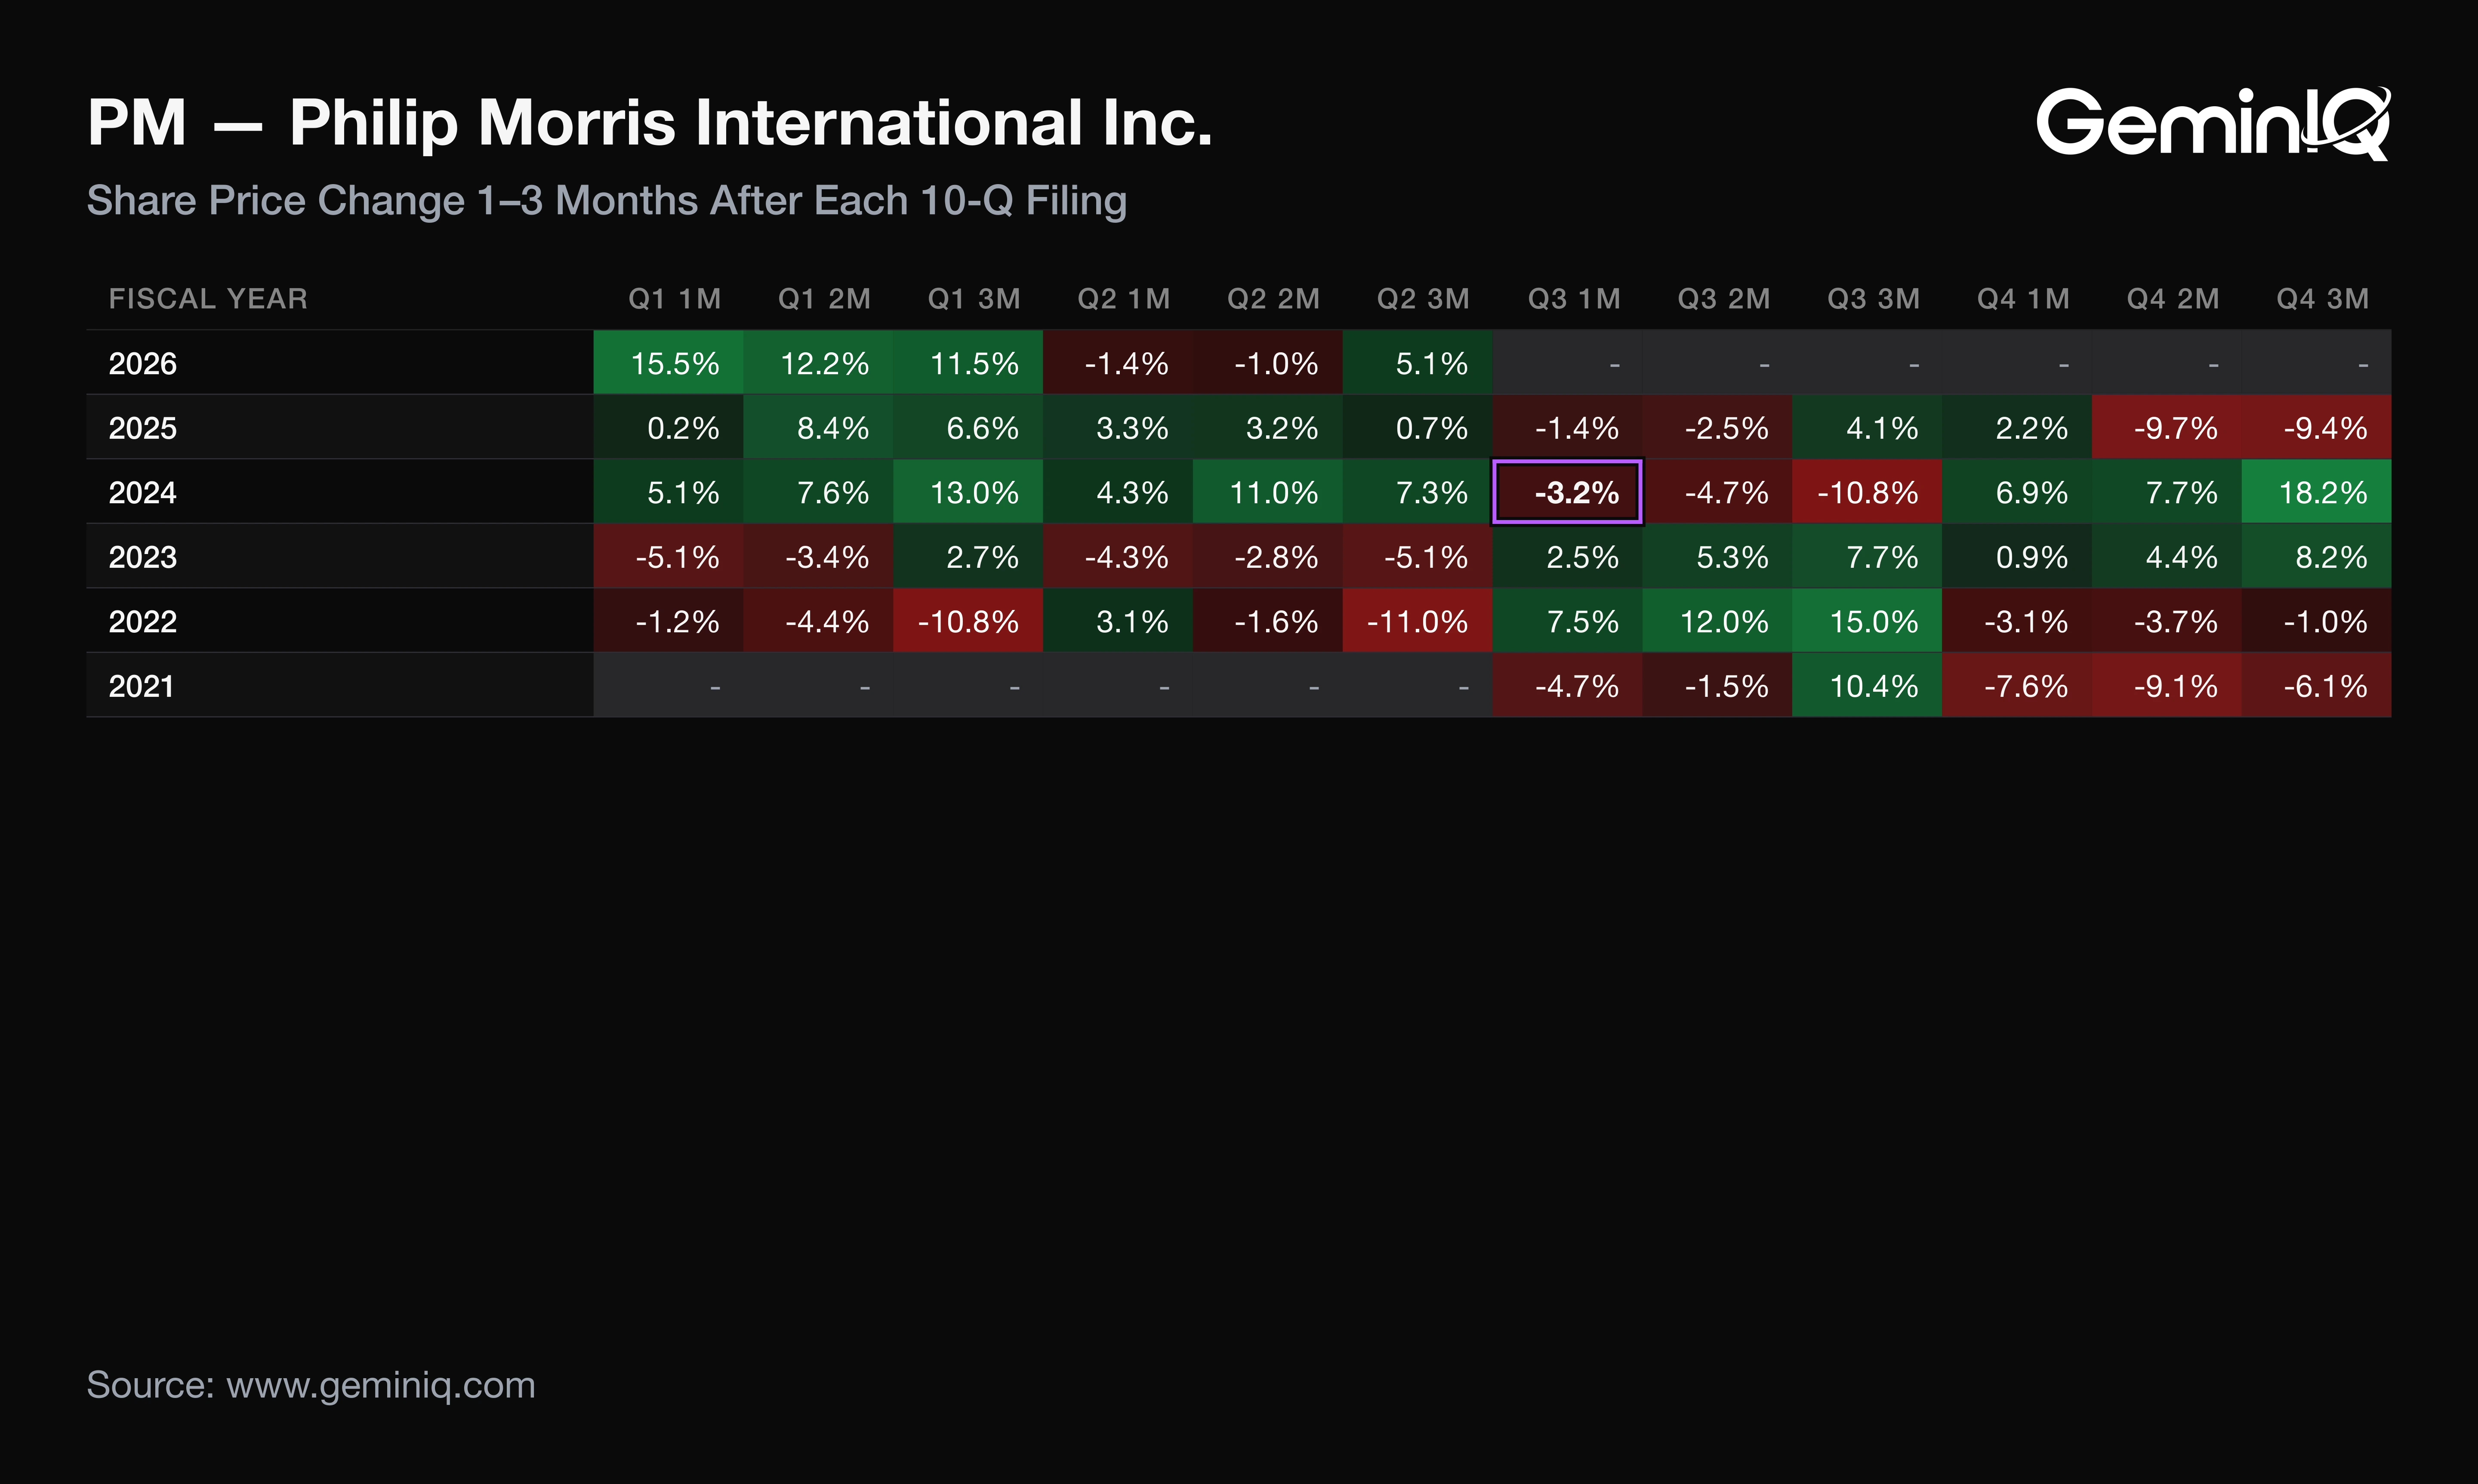
Across the last 12 Philip Morris 10-Q filings with a completed one-month window, filed October 2023 to July 2026, the one-month return had a median of +2.4% and was positive 9 times. The three-month median was +6.9%, positive 10 times.
The Data: One-month returns ranged from -3.2% (FY2024 Q3) to +15.5% (FY2026 Q1). The three past Q3 filings returned +2.5%, -3.2% and -1.4% after one month, so two of three were negative against 3 negatives in 12 overall. These figures describe how Philip Morris's stock moved after its past filings; they are a historical association, not a forecast. The current filing's window has not elapsed. See also GeminIQ's earnings reaction study and the Earnings Reaction Heat Map.
Why: The history assigns no cause. It measures dispersion: an 18.7-point range around a +2.4% median means any single window has sat far from the typical one.
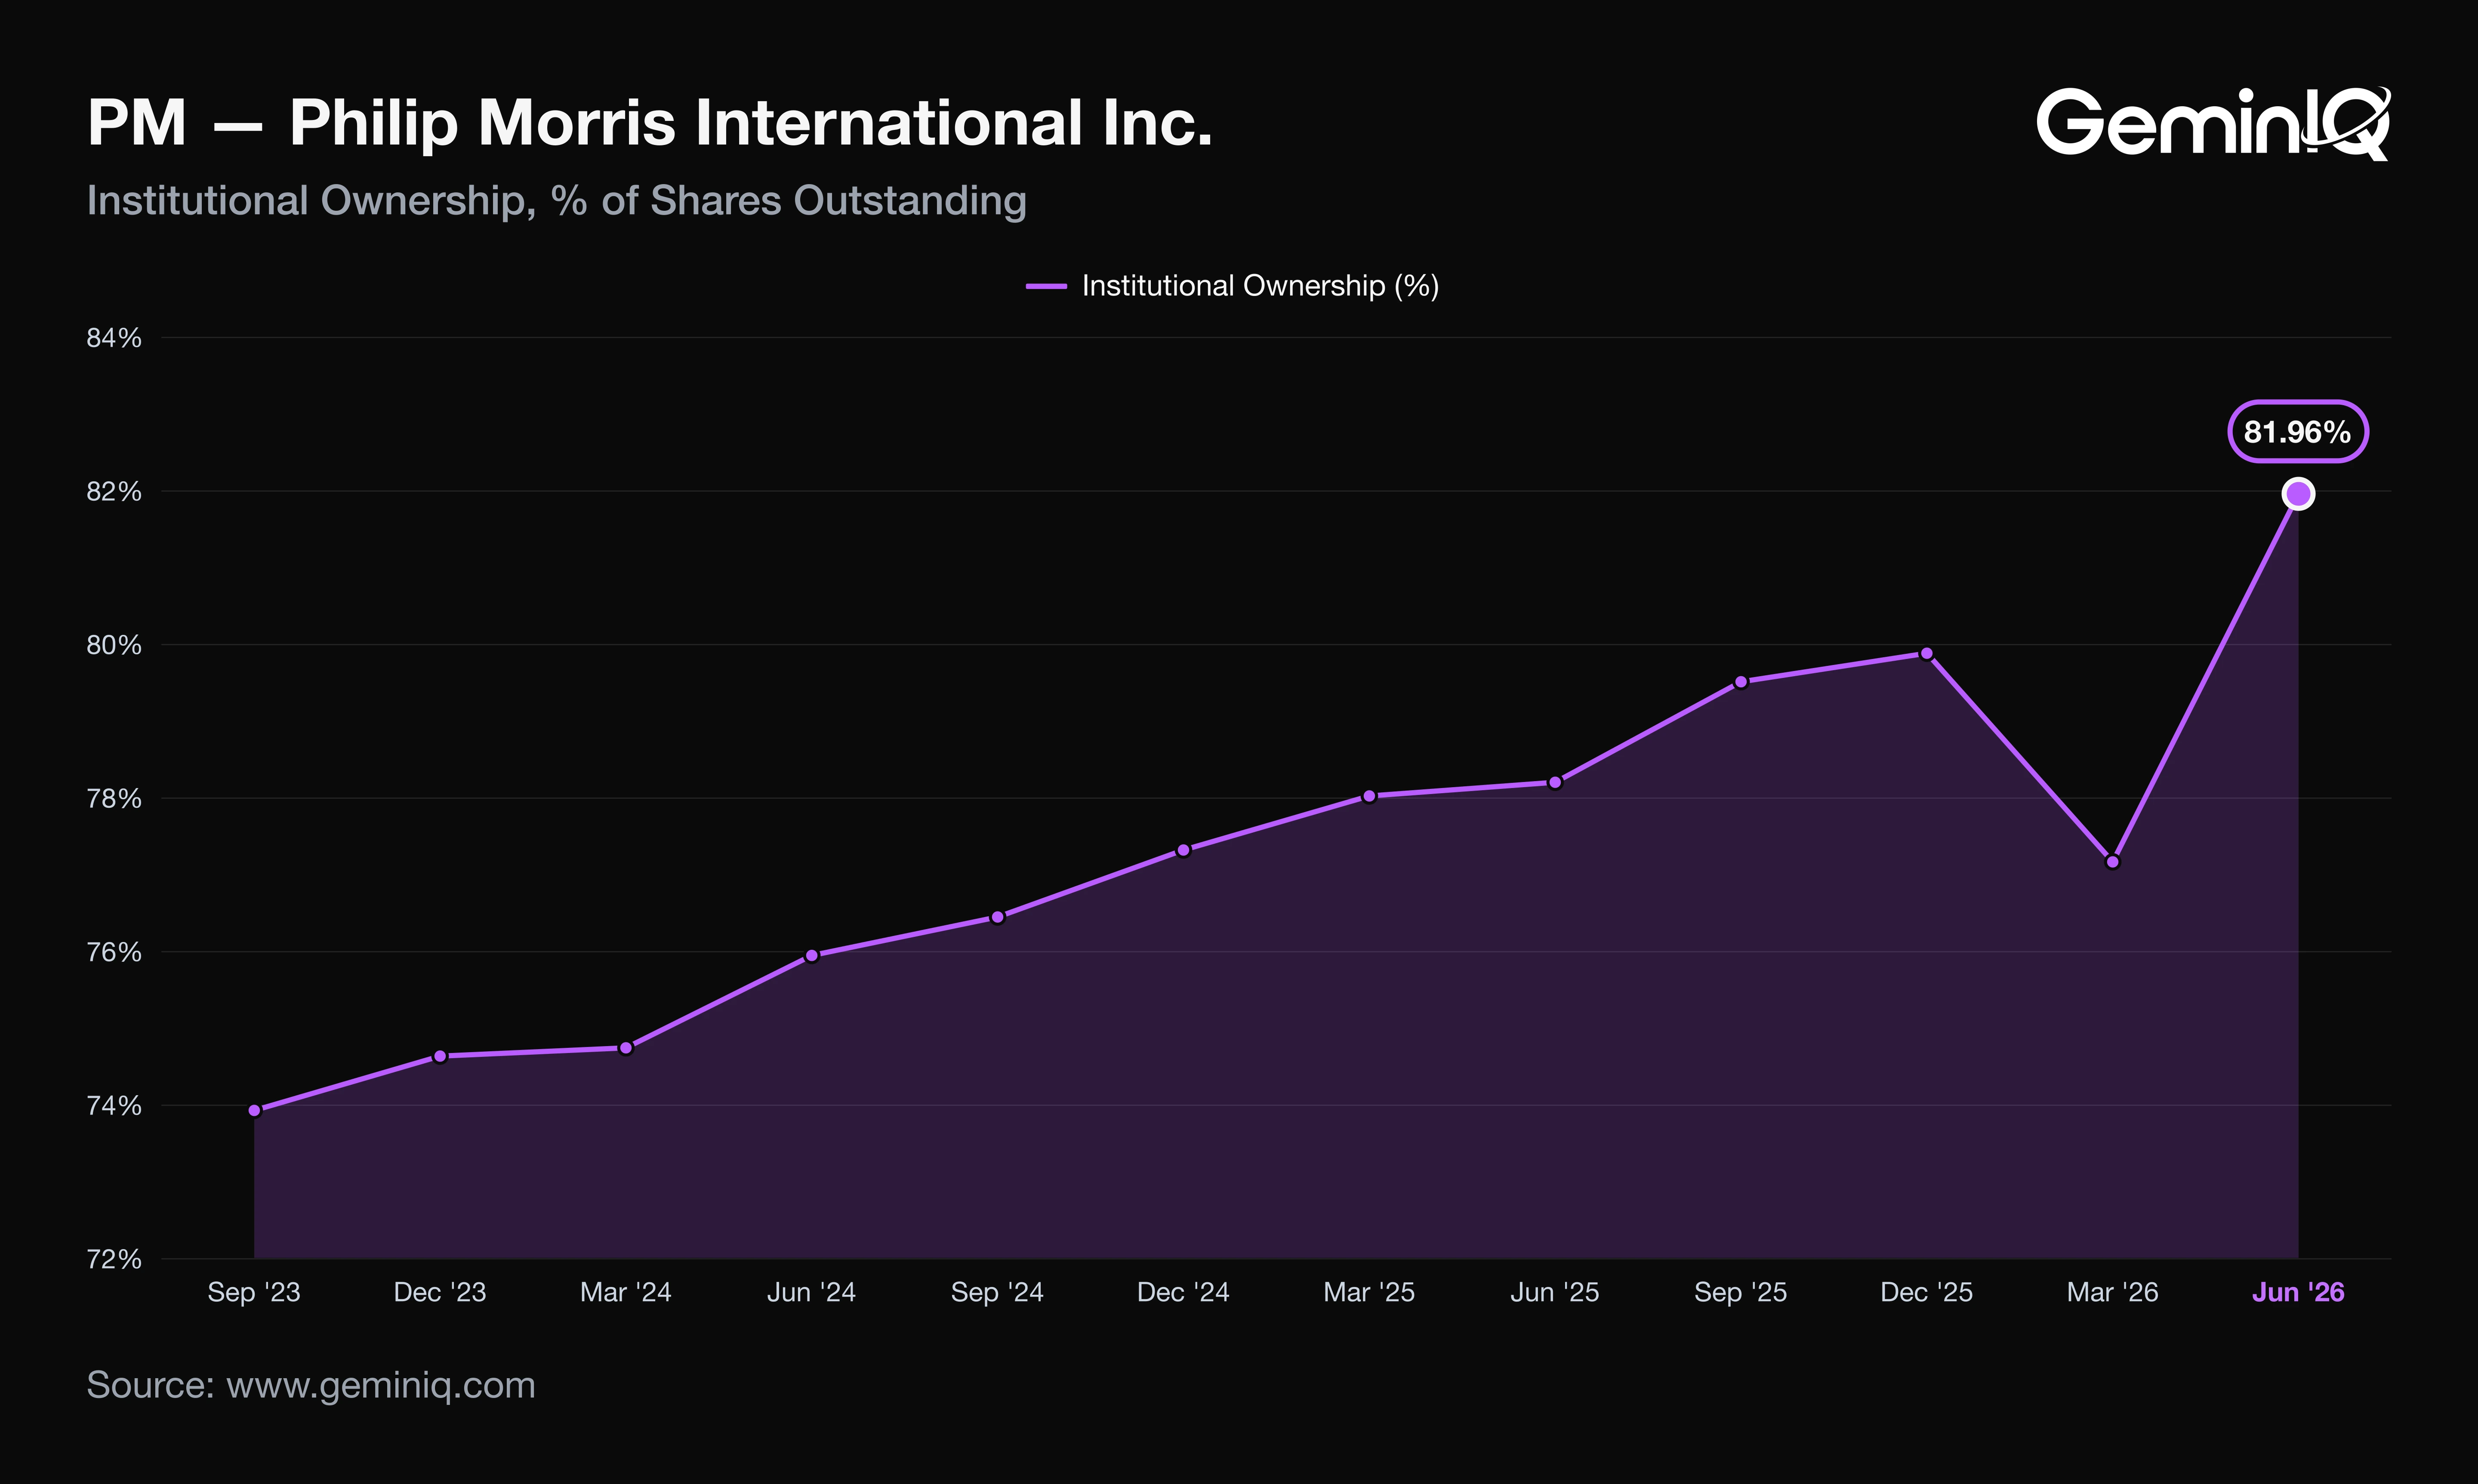
Institutions held 81.96% of Philip Morris at the latest 13F quarter end, June 30, 2026, up 3.76 points from a year earlier and the highest of the last 16 quarters. The September 30 filings are not yet in.
A quarter where pricing alone exceeds the whole gain in operating income has margins that depend on that pricing holding, and that is the line to read first in the next filing.
Frequently Asked Questions
When does Philip Morris report earnings?
Philip Morris reported Q3 2026 results on October 21, 2026 and filed its 10-Q on October 23, 2026. Last year it filed its fourth-quarter results on February 6, 2026, a pattern from the filing record and not a forecast of the next date.
Does Philip Morris pay a dividend?
Yes. Philip Morris paid $2.30 billion in dividends in Q3 2026 and $9.20 billion over the trailing twelve months, up 9.0%. The 8-K states the regular quarterly dividend was increased 8.8% to $1.60 per share, or $6.40 annualized.
Is Philip Morris doing well financially?
Philip Morris's trailing twelve-month net profit margin was 25.08%, up 2.53 points from a year earlier, and operating margin was 38.62%. GeminIQ's pre-calculated Return on Invested Capital was 35.77%, up 5.16 points, and trailing free cash flow was $13.60 billion, up 34.3%.
Where can I verify Philip Morris's Q3 2026 figures?
The figures come from the Q3 2026 10-Q filed October 23, 2026, and the earnings release filed October 21, 2026, both on SEC EDGAR.
Wall Street's data. Main Street's price.
Institutional terminals charge thousands a year for as-filed accuracy. GeminIQ gives you the same thing for a fraction of the cost: financials built directly from raw SEC EDGAR filings, not third-party APIs, with full XBRL traceability back to the original 10-K or 10-Q. No normalized guesswork, just calculated metrics, charts, screeners, and watchlists built on numbers exactly as the company reported them. Start researching now at GeminIQ.com.
All financial figures cited in this article reference Philip Morris International Inc.'s Q3 2026 10-Q (filed October 23, 2026, period ending September 30, 2026), with guidance and management commentary drawn from the company's Form 8-K earnings release (filed October 21, 2026). All SEC filings are publicly available at SEC EDGAR and SEC EDGAR.
Disclaimer: The content in this blog is for educational and entertainment purposes only and does not constitute financial, legal, or tax advice. Investing involves risk, including the loss of principal. The views expressed are my own and not intended as financial advice or a guarantee of future performance.