
The QuickFS Alternative That Actually Pulls From the Filings

By Chad Hartman
Published · Last updated
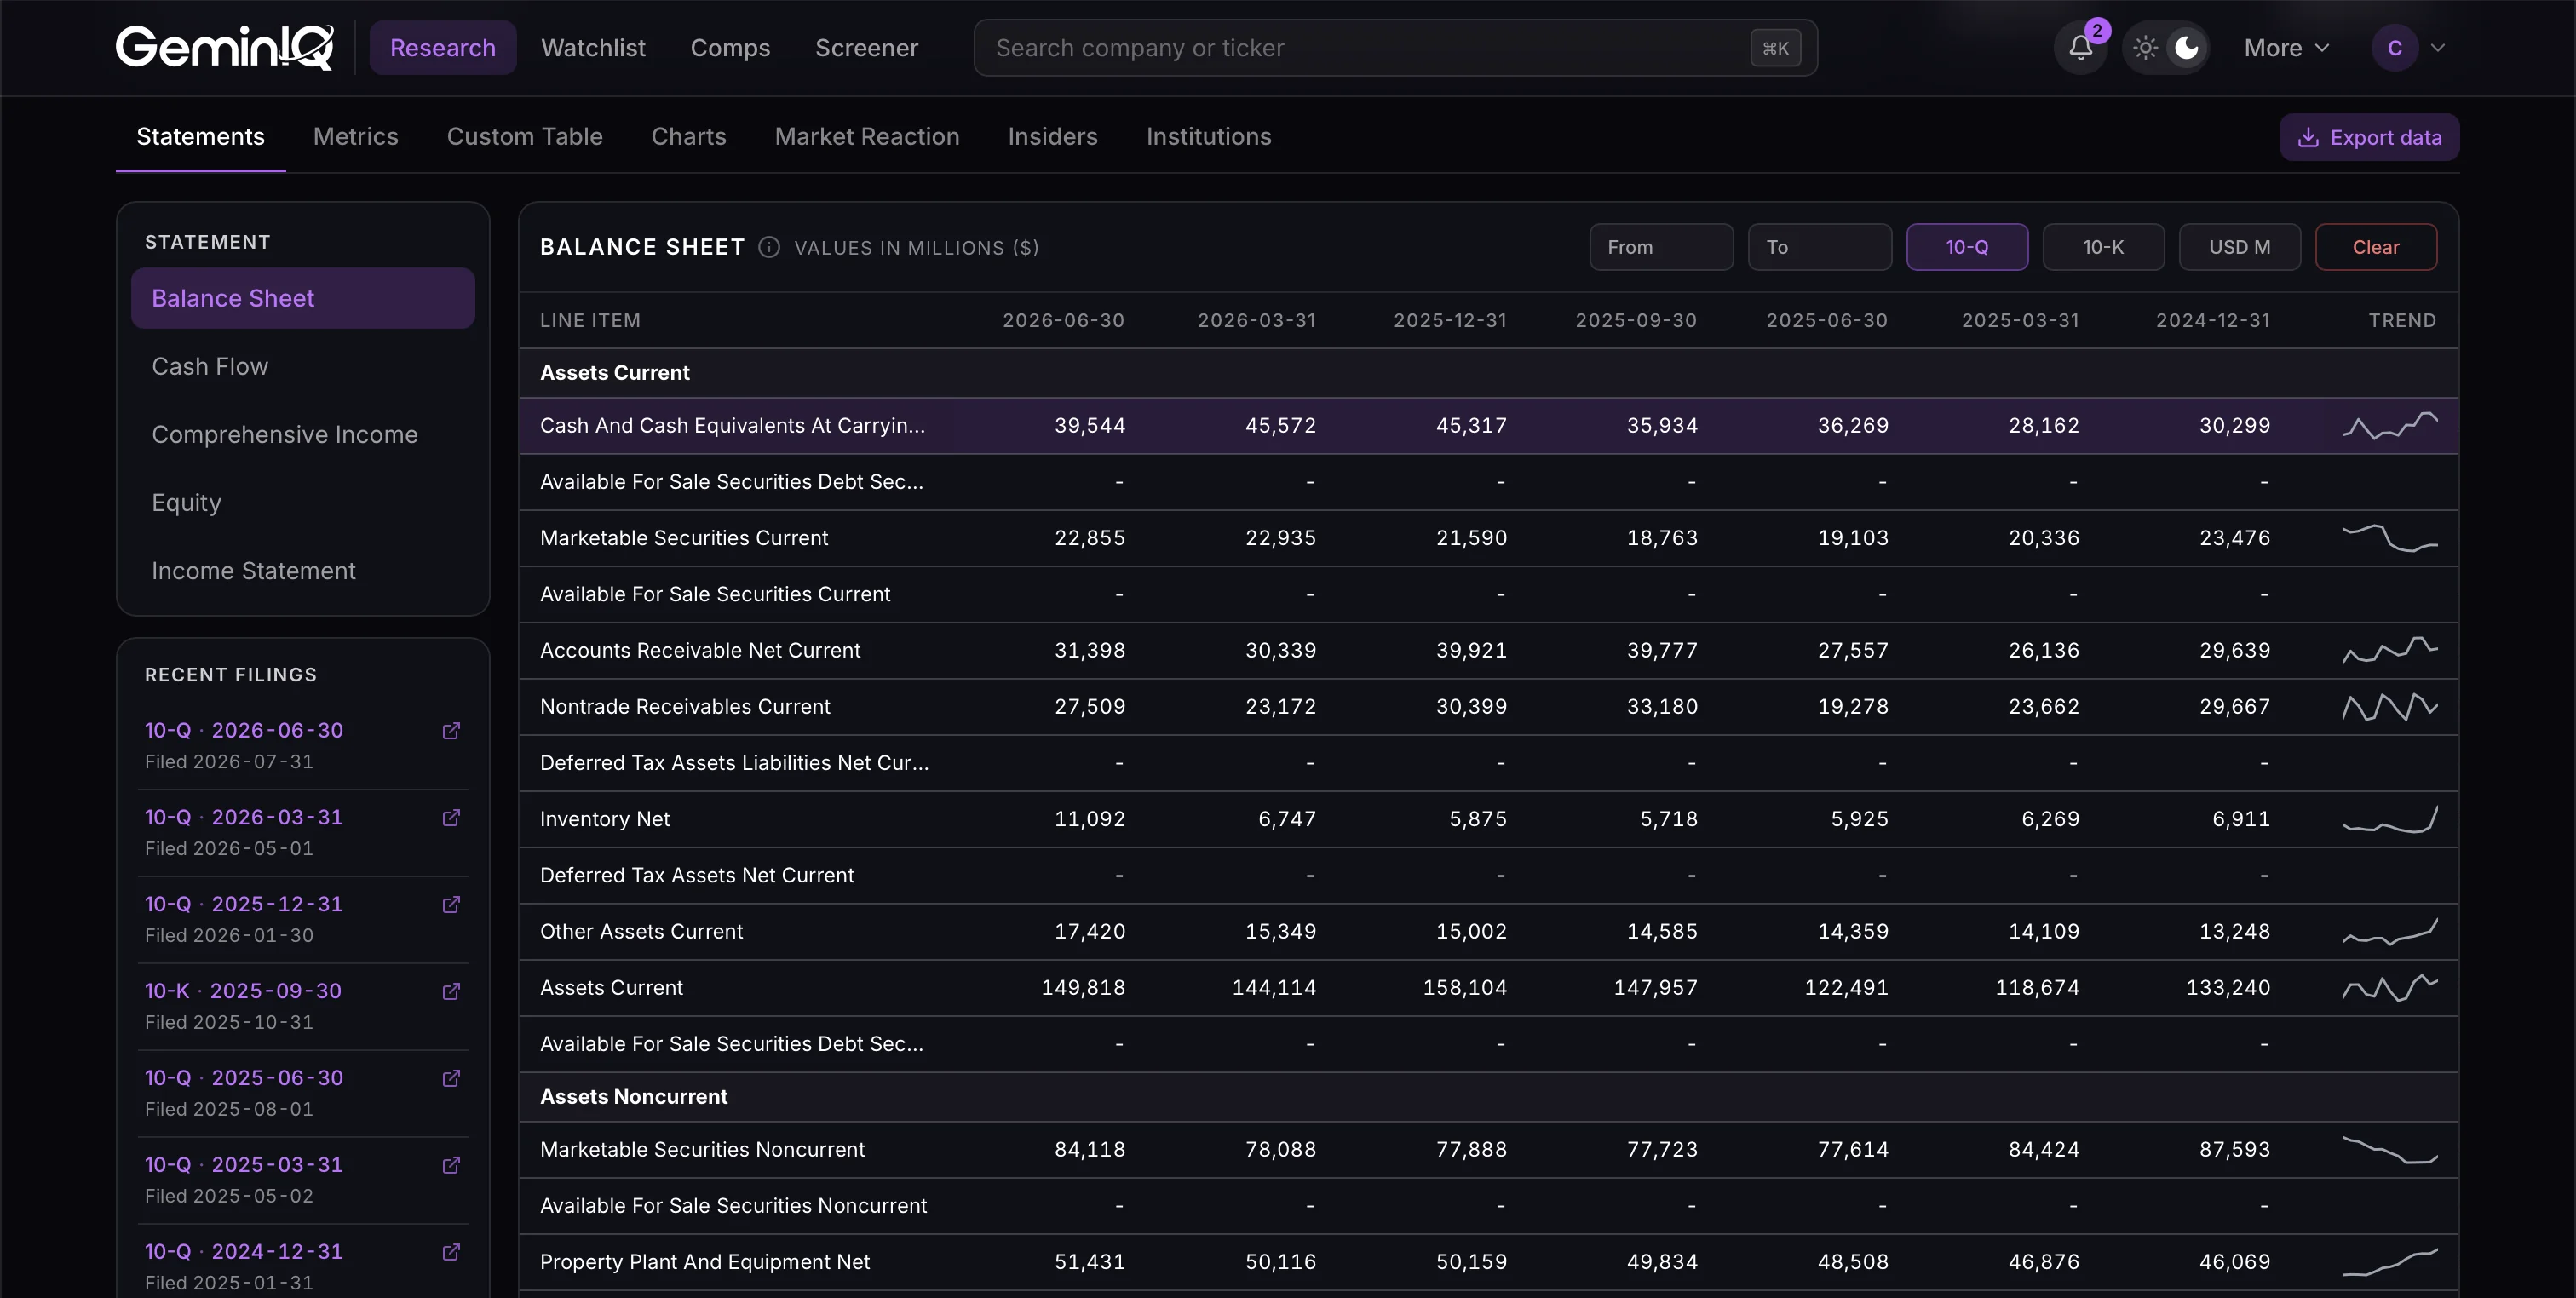
QuickFS told users its data came straight from company filings. GeminIQ's does. We parse every US 10-K and 10-Q ourselves, keep every line item as filed, link each period to its source filing, and export the whole history to Excel in one click.
Start your 7-day free trial → or see Apple's full history free.
Direct from SEC EDGAR, no data vendors · 17+ years of history · Every period linked to its filing · $29/mo billed annually
Table of Contents
- What Happened to QuickFS
- Why "From the Filings" Matters: One Apple Number
- Coming From QuickFS? Here Is What Maps to What
- Do Not Trust Us. Check Any Number in Three Clicks.
- How the Main QuickFS Alternatives Compare
- What GeminIQ Does Not Do (Yet)
- One Plan, Priced for Individual Investors
- Built by Two Founders Who Wanted the Real Numbers
- Frequently Asked Questions
What Happened to QuickFS
On February 3, 2026, QuickFS announced it was shutting down. A day later, its founder disclosed that the data customers believed came directly from company filings had in fact been GuruFocus data, redistributed without permission. The original notices are no longer online; QuickFS's site now shows a farewell note from its founder, and Shibui Finance summarizes both notices.
If you relied on QuickFS, you lost two things at once: your favorite tool and your confidence in where the numbers came from. Many users built years of spreadsheets on it.
We are not here to pile on. We built GeminIQ because we had the same problem from the other side: the numbers on the big data sites did not match the 10-K, and we wanted to know why.
Why "From the Filings" Matters: One Apple Number
In its fiscal 2025 10-K, Apple reports two separate figures in its cash flow statement:
| Line item as filed (Apple FY2025 10-K) | Amount |
|---|---|
| Repurchases of common stock | $90,711M |
| Payments for taxes related to net share settlement of equity awards | $5,960M |
| What a standardized data feed shows as "Repurchase of Common Stock" | $96,671M |
That $5,960M is not a buyback. It is cash Apple paid to tax authorities on behalf of employees when their stock awards vested. A standardized template that has one buyback row combines the two into a single "repurchases" line, so a shareholder-yield calculation built on that number overstates real buybacks by about 6.6%.
At Broadcom the gap is bigger. In fiscal 2025, shares repurchased for tax withholdings on vesting of equity awards came to $3,860M, more than the $2,450M the company spent on repurchases under its buyback program.
GeminIQ keeps every row the way the company filed it, labeled with the XBRL element the company tagged it with. Apple's two figures stay on two rows, Payments For Repurchase Of Common Stock and Payments Related To Tax Withholding For Share Based Compensation, across all 17 fiscal years from 2009 to 2025. The hidden problems with third-party financial data post covers more ways a standardized template regroups what a company reported.
See Apple's cash flow as filed →
Coming From QuickFS? Here Is What Maps to What
| What you used in QuickFS | In GeminIQ |
|---|---|
| About 20 years of financial statements | 17+ years on paid plans (from 2009 for large filers, 2011 for smaller ones), annual and quarterly |
Excel add-in that pulled data live with =QFS() formulas, plus an API |
One-click .xlsx export on paid plans: statements, 90+ metrics, insider trades, institutional ownership, earnings reaction; real numeric values; per-dataset date ranges |
| Standardized line items (GuruFocus data, per its founder's notice) | Line items exactly as filed, keyed by XBRL tag so each row stays consistent over time |
| Ratios and metrics | 90+ calculated metrics: ROIC, FCF yield, Altman Z, EV/EBITDA, cash conversion cycle, 3- and 5-year growth |
| US, Canadian, Australian and European stocks | US SEC filers only |
| Also in GeminIQ | Every period linked to its source filing; screener with 100+ metrics, up to 10 stacked filters and 18 prebuilt value strategies; watchlists with thesis, price targets and alerts for new 10-K/10-Q filings; insider Form 4 tracker; 13F ownership trend; post-filing price reaction heat map; peer comps with implied valuation range |
Rebuilding your QuickFS spreadsheets? Export a company from GeminIQ and open the statements sheet next to your old file. Each row is one reported value with its XBRL tag, period end, and form, so a SUMIFS or a pivot on tag and period rebuilds any line your old formulas pointed at, and the same tag lines up year after year.
Do Not Trust Us. Check Any Number in Three Clicks.
- Open any company page, for example /stocks/AAPL, and pick a statement: Balance Sheet, Cash Flow, or Income Statement.
- In the Recent filings list beside the statement, click the 10-K or 10-Q for the period you want.
- The source filing opens on SEC EDGAR. Find the line, compare the number.
If a number does not match, email feedback@geminiq.com. We correct filer errors where we can.
How the Main QuickFS Alternatives Compare
Prices and features as published on each company's site, checked October 10, 2026. Tell us if anything here is out of date and we'll fix it.
| GeminIQ | GuruFocus | TIKR | ROIC.ai | StockAnalysis | |
|---|---|---|---|---|---|
| Price | $348/yr or $39/mo | US Premium $549/yr | Plus about $215/yr ($24.95/mo monthly) | $29 or $89/mo | Pro $79/yr |
| Paid history | 17+ yrs | Up to 30 yrs | 10 yrs (Plus, Pro); 30 yrs (Ultimate) | 5 yrs (Individual); all available (Professional) | 10 to 40 yrs |
| Data approach | Parsed in-house from SEC XBRL, as filed | Licensed fundamentals (Morningstar) | S&P Capital IQ, standardized | Normalized template | Standardized default; As Reported view available |
| Excel export | Yes, one click | Excel and Google Sheets add-ins | Yes | Yes, paid tiers | Yes (Pro: 1 download/day) |
| Coverage | US only | Global | Global | Global (paid tiers) | Global (130,000+ stocks and funds) |
Where a competitor is stronger, it says so above: every one of them covers more of the world than we do, and most go further back. For feature-by-feature detail, see GeminIQ vs. GuruFocus, GeminIQ vs. TIKR, and GeminIQ vs. ROIC.ai. If what you miss most is pulling numbers live into a spreadsheet with a formula, the Wisesheets alternative post covers that category honestly.
What GeminIQ Does Not Do (Yet)
- US companies only. If you need international coverage, GeminIQ is not your tool.
- No live spreadsheet add-in or API. You export to Excel; you don't pull live with a formula.
- Banks, insurers and REITs are covered, but their XBRL filings are messier, so expect more gaps.
- History starts with XBRL, in 2009 for the largest filers and 2011 for smaller ones.
One Plan, Priced for Individual Investors
- $29/mo billed annually ($348/yr) or $39/mo monthly
- 7-day trial
- Free tier with no account: 3 years of history on every company page, plus a free screener with 18 prebuilt strategies
Built by Two Founders Who Wanted the Real Numbers
We are Chad Hartman and Brett Hartman. Brett is a software engineer; Chad's background is quantitative analysis and data. We started GeminIQ after the numbers on the big data sites kept disagreeing with the 10-Ks we were reading. So we wrote our own parser for SEC XBRL, with no data vendors in between. We still answer every support email ourselves.
Frequently Asked Questions
Can I import my old QuickFS spreadsheets?
Not automatically. Export the company from GeminIQ to .xlsx, place it beside your old file, and repoint your formulas. Rows are labeled by XBRL tag, so they stay consistent year to year.
Where does GeminIQ's data come from?
Directly from SEC EDGAR XBRL filings, parsed by our own software. We do not license data from any vendor.
How far back does the data go?
To 2009 for the largest filers and 2011 for smaller ones, which is when XBRL filing began. That is 17+ years on paid plans; the free tier shows 3 years.
How fast do new filings show up?
Filings are processed overnight, so a 10-K filed today is usually on the site tomorrow.
Do you cover international stocks?
No. GeminIQ covers US SEC filers only.
Why do your numbers sometimes differ from other sites?
Most sites show standardized data, which regroups line items into a fixed template. We show what the company filed. Open the filing from the Recent filings list on any company page to check the source.
What happens if a company files an error?
We correct filer errors where we can identify them.
Is there a free trial?
Yes, 7 days. There is also a free tier with no account needed.
Rebuild Your Research on Numbers You Can Check
Every US company, 17+ years, exactly as filed, one click to Excel.
Or browse any company free, no account needed.
Data Used / Sources
- Apple Inc. Form 10-K for the fiscal year ended September 27, 2025 (filed October 31, 2025, accession 0000320193-25-000079), consolidated statement of cash flows: Repurchases of common stock $90,711M; Payments for taxes related to net share settlement of equity awards $5,960M.
- Broadcom Inc. Form 10-K for the fiscal year ended November 2, 2025 (filed December 18, 2025, accession 0001730168-25-000121), consolidated statement of cash flows: Repurchases of common stock - repurchase program $2,450M; Shares repurchased for tax withholdings on vesting of equity awards $3,860M.
- Both sets of figures cross-checked against the SEC's XBRL company facts (PaymentsForRepurchaseOfCommonStock, PaymentsRelatedToTaxWithholdingForShareBasedCompensation).
- QuickFS shutdown and data-source notices (February 2026): summarized by Shibui Finance; QuickFS's current farewell note is at quickfs.net.
- Competitor prices and features taken from each company's public website.
- Standardized "Repurchase of Common Stock" of -$96,671M for Apple FY2025 as shown on StockAnalysis's default (standardized) cash flow view, checked October 10, 2026.
QuickFS, GuruFocus, TIKR, ROIC.ai and StockAnalysis are trademarks of their respective owners. GeminIQ is not affiliated with them. Comparison information was taken from each company's public website.
Disclaimer: The content in this blog is for educational and entertainment purposes only and does not constitute financial, legal, or tax advice. Investing involves risk, including the loss of principal. The views expressed are my own and not intended as financial advice or a guarantee of future performance.