
Royal Caribbean (RCL) Q3 2026 Earnings: EPS Up 12.4%, SG&A Down 0.6%

By Chad Hartman
Published · Last updated
Royal Caribbean (RCL) reported diluted EPS of $6.45 (+12.4% from $5.74) on revenue of $5.59 billion (+8.8%) for the quarter ended September 30, 2026, in an 8-K and a 10-Q both dated October 27, 2026. Operating margin reached 33.5%, the highest of the last 16 quarters, yet cruise operating expenses grew 9.4%, faster than revenue, and the entire margin gain came from marketing, selling and administrative expense, which fell 0.6% to $519 million. The company's release attributes lower costs to timing, and that explanation decides how much of the quarter repeats.
| Field | Value |
|---|---|
| Company | Royal Caribbean ($RCL) |
| Quarter | Q3 FY2026, period ended September 30, 2026 |
| Earnings release | October 27, 2026 (Form 8-K) |
| 10-Q filed | October 27, 2026 |
| Revenue | $5.59 Billion (+8.8% YoY) |
| Diluted EPS | $6.45 (+12.4% YoY) |
| Operating margin | 33.5% (+0.3 pts YoY) |
| Operating cash flow (TTM) | $6.90 Billion |
| Marketing, selling and administrative expense (YoY) | $519 million (-0.6%) |
Royal Caribbean Q3 2026 Revenue, EPS and Operating Margin
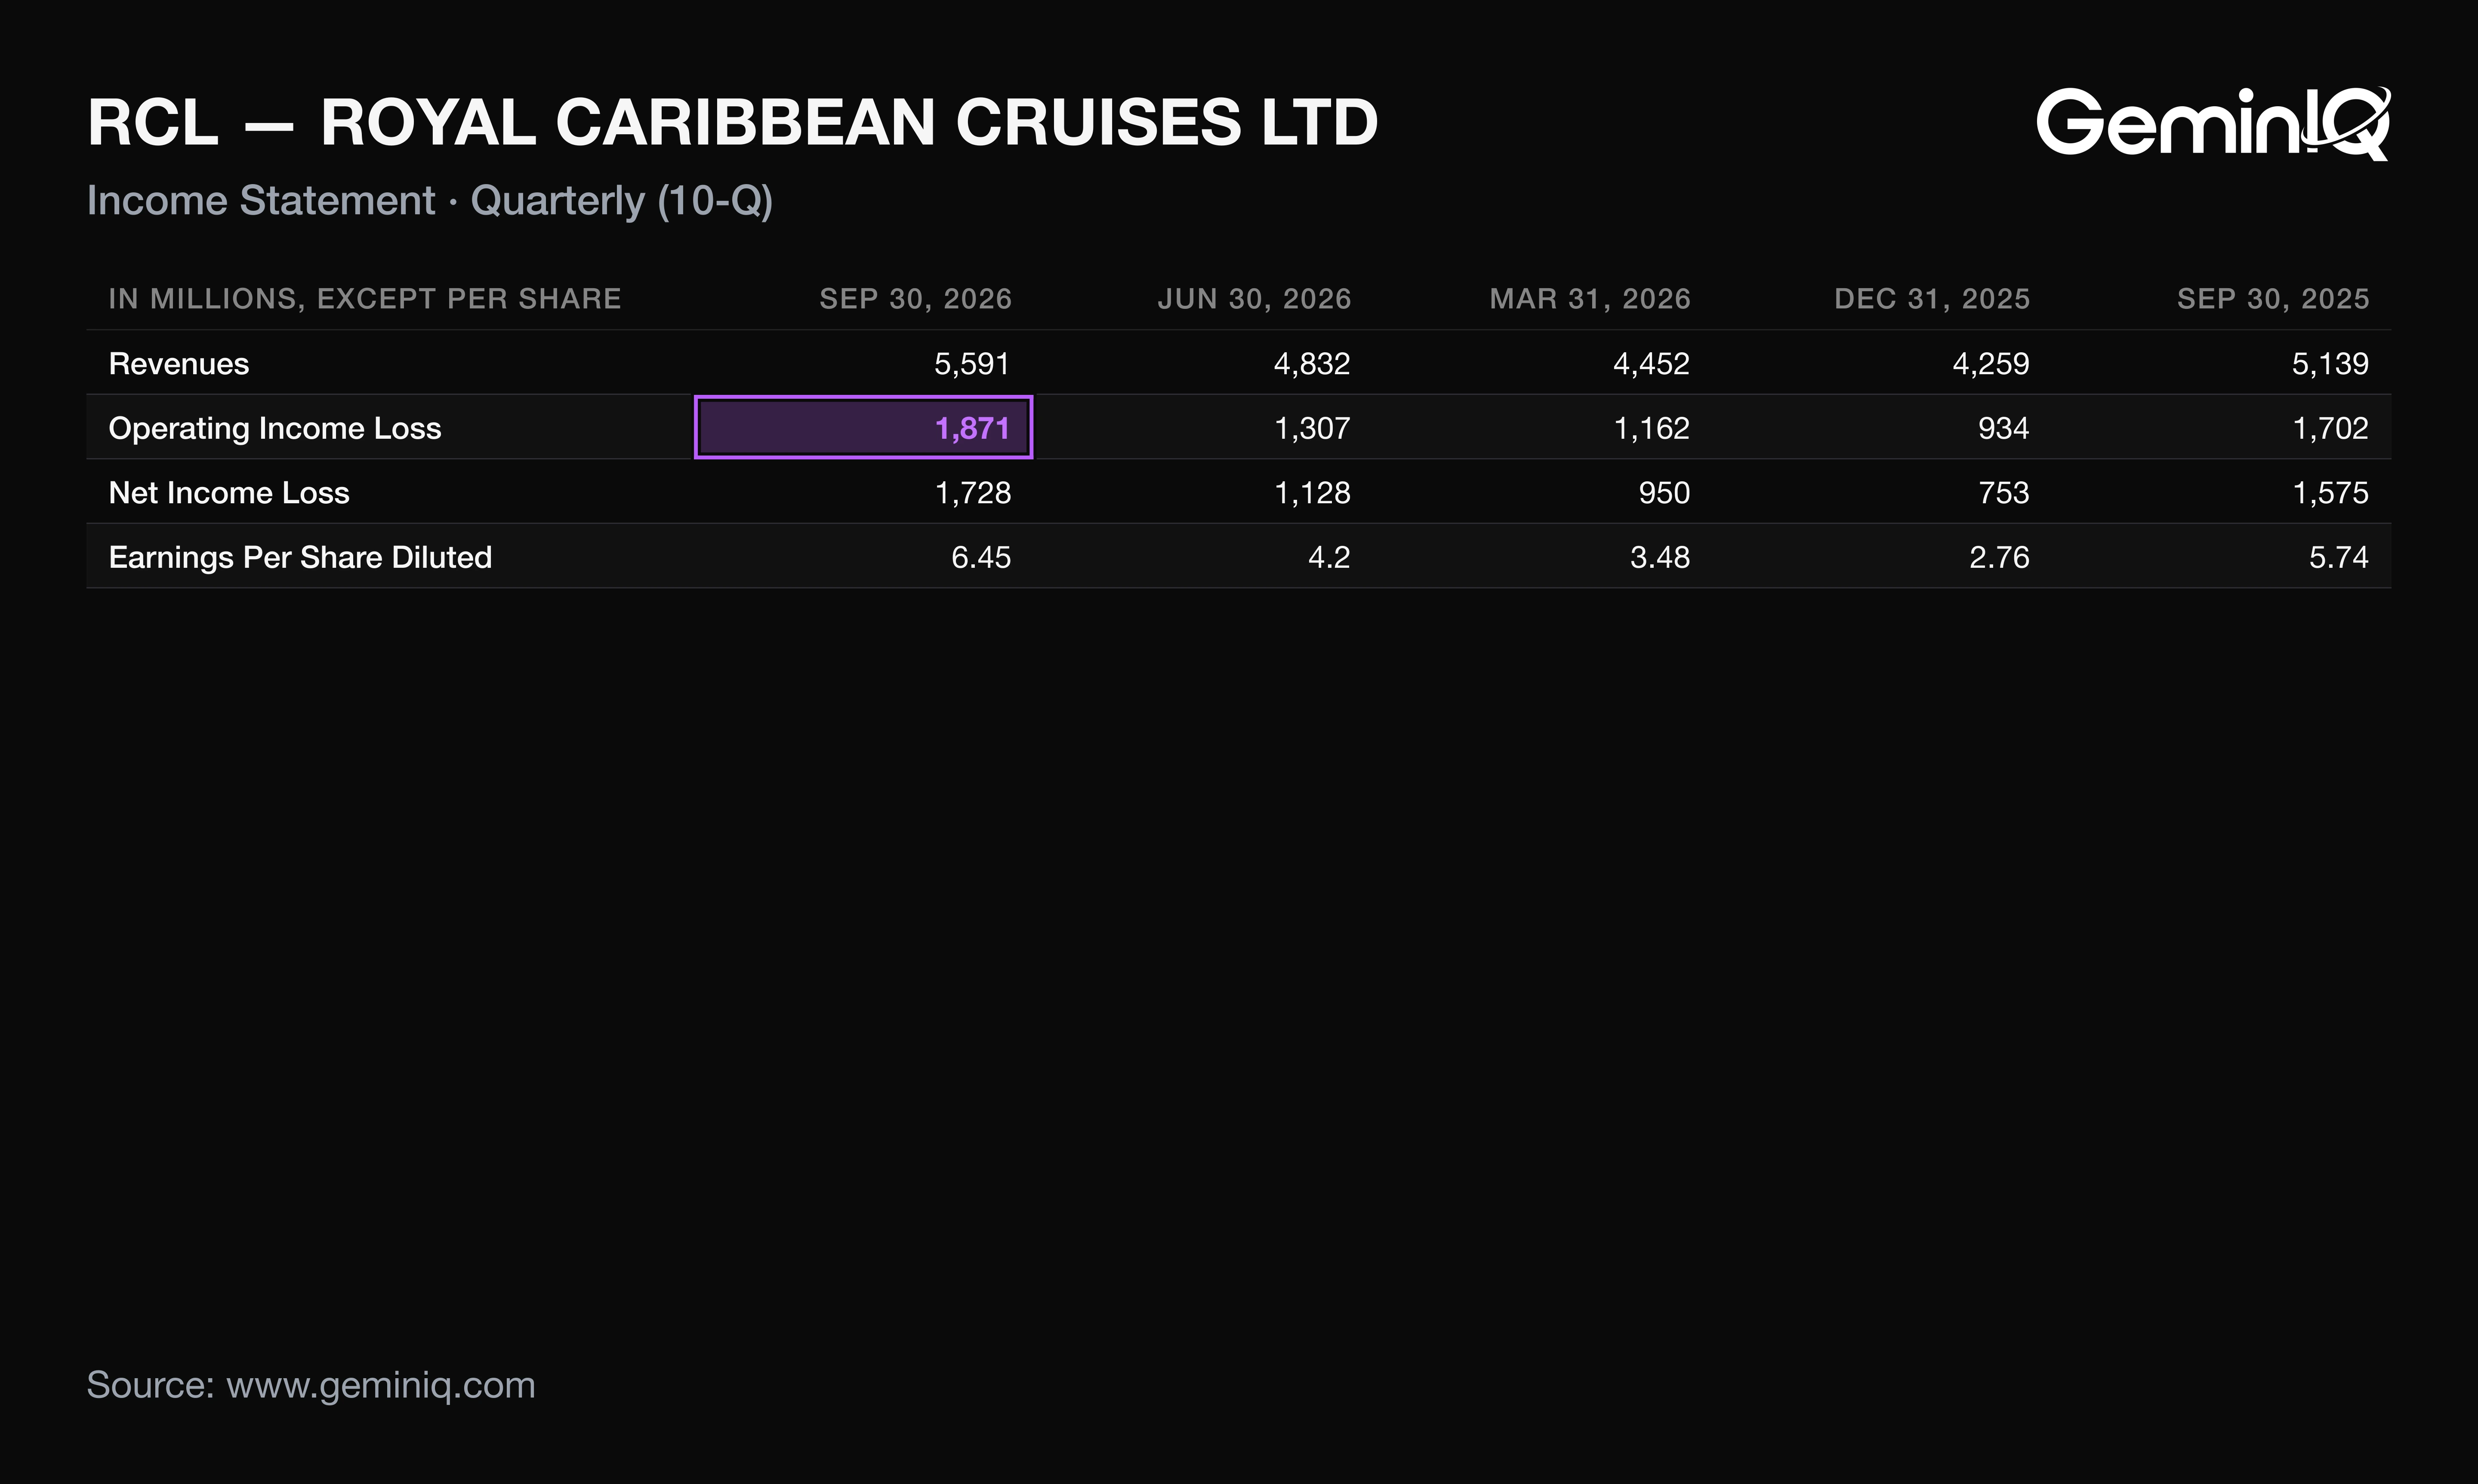
Royal Caribbean's Q3 2026 diluted EPS was $6.45, up 12.4% from $5.74, on revenue of $5.59 billion, up 8.8%. EPS grew faster than net income, and the margin rose only slightly.
The Data: Operating income was $1.87 billion (+9.9%), against revenue growth of 8.8%, lifting operating margin 0.3 points to 33.5%. Net income rose 9.7% to $1.73 billion. Diluted shares fell to 268 million from 274 million. Gross margin slipped 0.2 points to 51.5%. Q3 is the seasonal peak, so ranks against the last 16 quarters flatter any third quarter; the year-over-year change is the fairer yardstick.
Why: Net income grew 9.7% and EPS 12.4%. The 2.7-point gap, more than a fifth of EPS growth, came from a 2.2% smaller share count, not from operations. Operating margin edged up while gross margin edged down, so the gain sits below the gross line, in operating expenses.
What Royal Caribbean's 10-Q Shows Beyond the Press Release
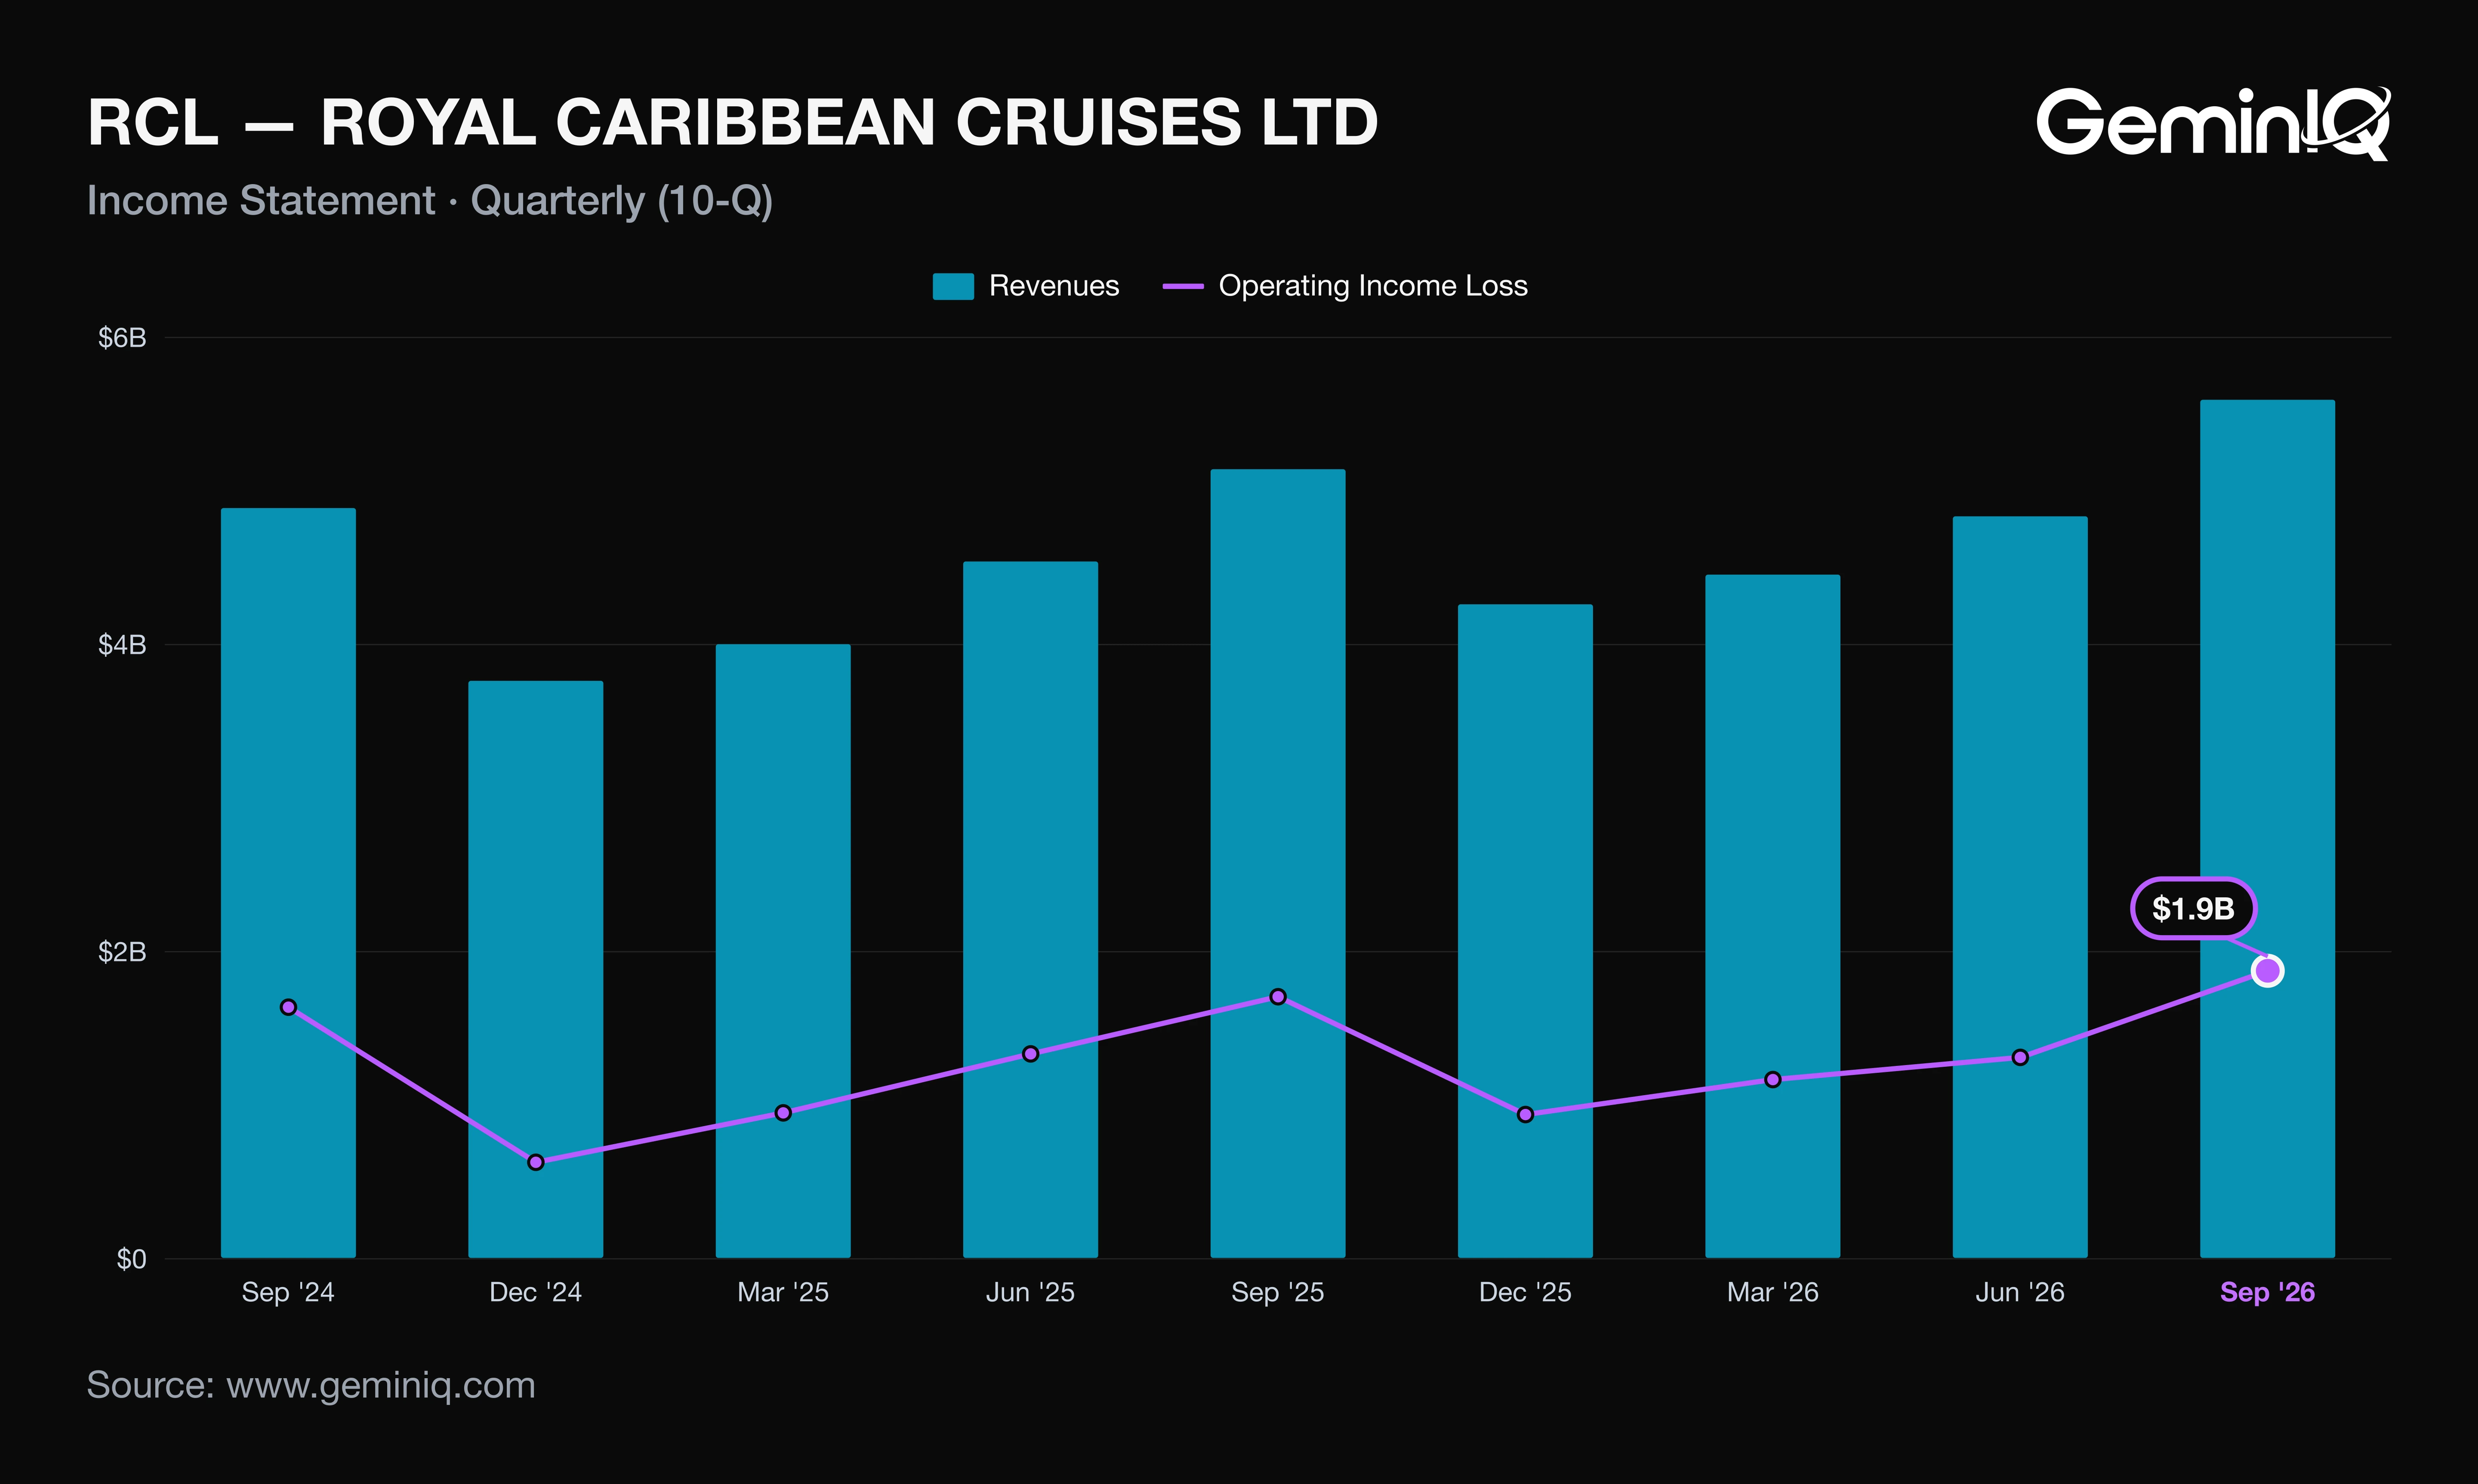
Royal Caribbean's Q3 2026 marketing, selling and administrative expense was $519 million, down from $522 million a year earlier, while revenue rose 8.8%. That one line carried the margin gain.
A reader who sees the highest operating margin of the last 16 quarters would expect pricing and fill to have done the work. Instead the 10-Q's cost table shows the other big lines moving against margin.
The Data: Cruise operating expenses rose 9.4% to $2.71 billion, or 48.5% of revenue against 48.2%. Depreciation and amortization rose 12.6% to $490 million, or 8.8% of revenue against 8.5%. Marketing, selling and administrative expense fell to 9.3% of revenue from 10.2%. Those three moves, minus 0.3, minus 0.3 and plus 0.9 points, net to the 0.3-point margin gain.
Why: The 8-K attributes the cost performance to "the timing of expenses that shifted into the fourth quarter" and puts cost per available passenger cruise day, excluding fuel, down 1.9%. Had marketing, selling and administrative expense grown with revenue, it would have been about $568 million, operating income about $1.82 billion (+7%) and operating margin about 32.6%, below the year-ago 33.1%. The line includes $9 million of restructuring charges against $1 million a year ago, so the underlying fall was slightly larger. GAAP EPS of $6.45 sits $0.12 below the 8-K's adjusted $6.57, a gap of $32 million mostly from debt extinguishment.
Royal Caribbean Q3 2026 Free Cash Flow, Dividends and Debt
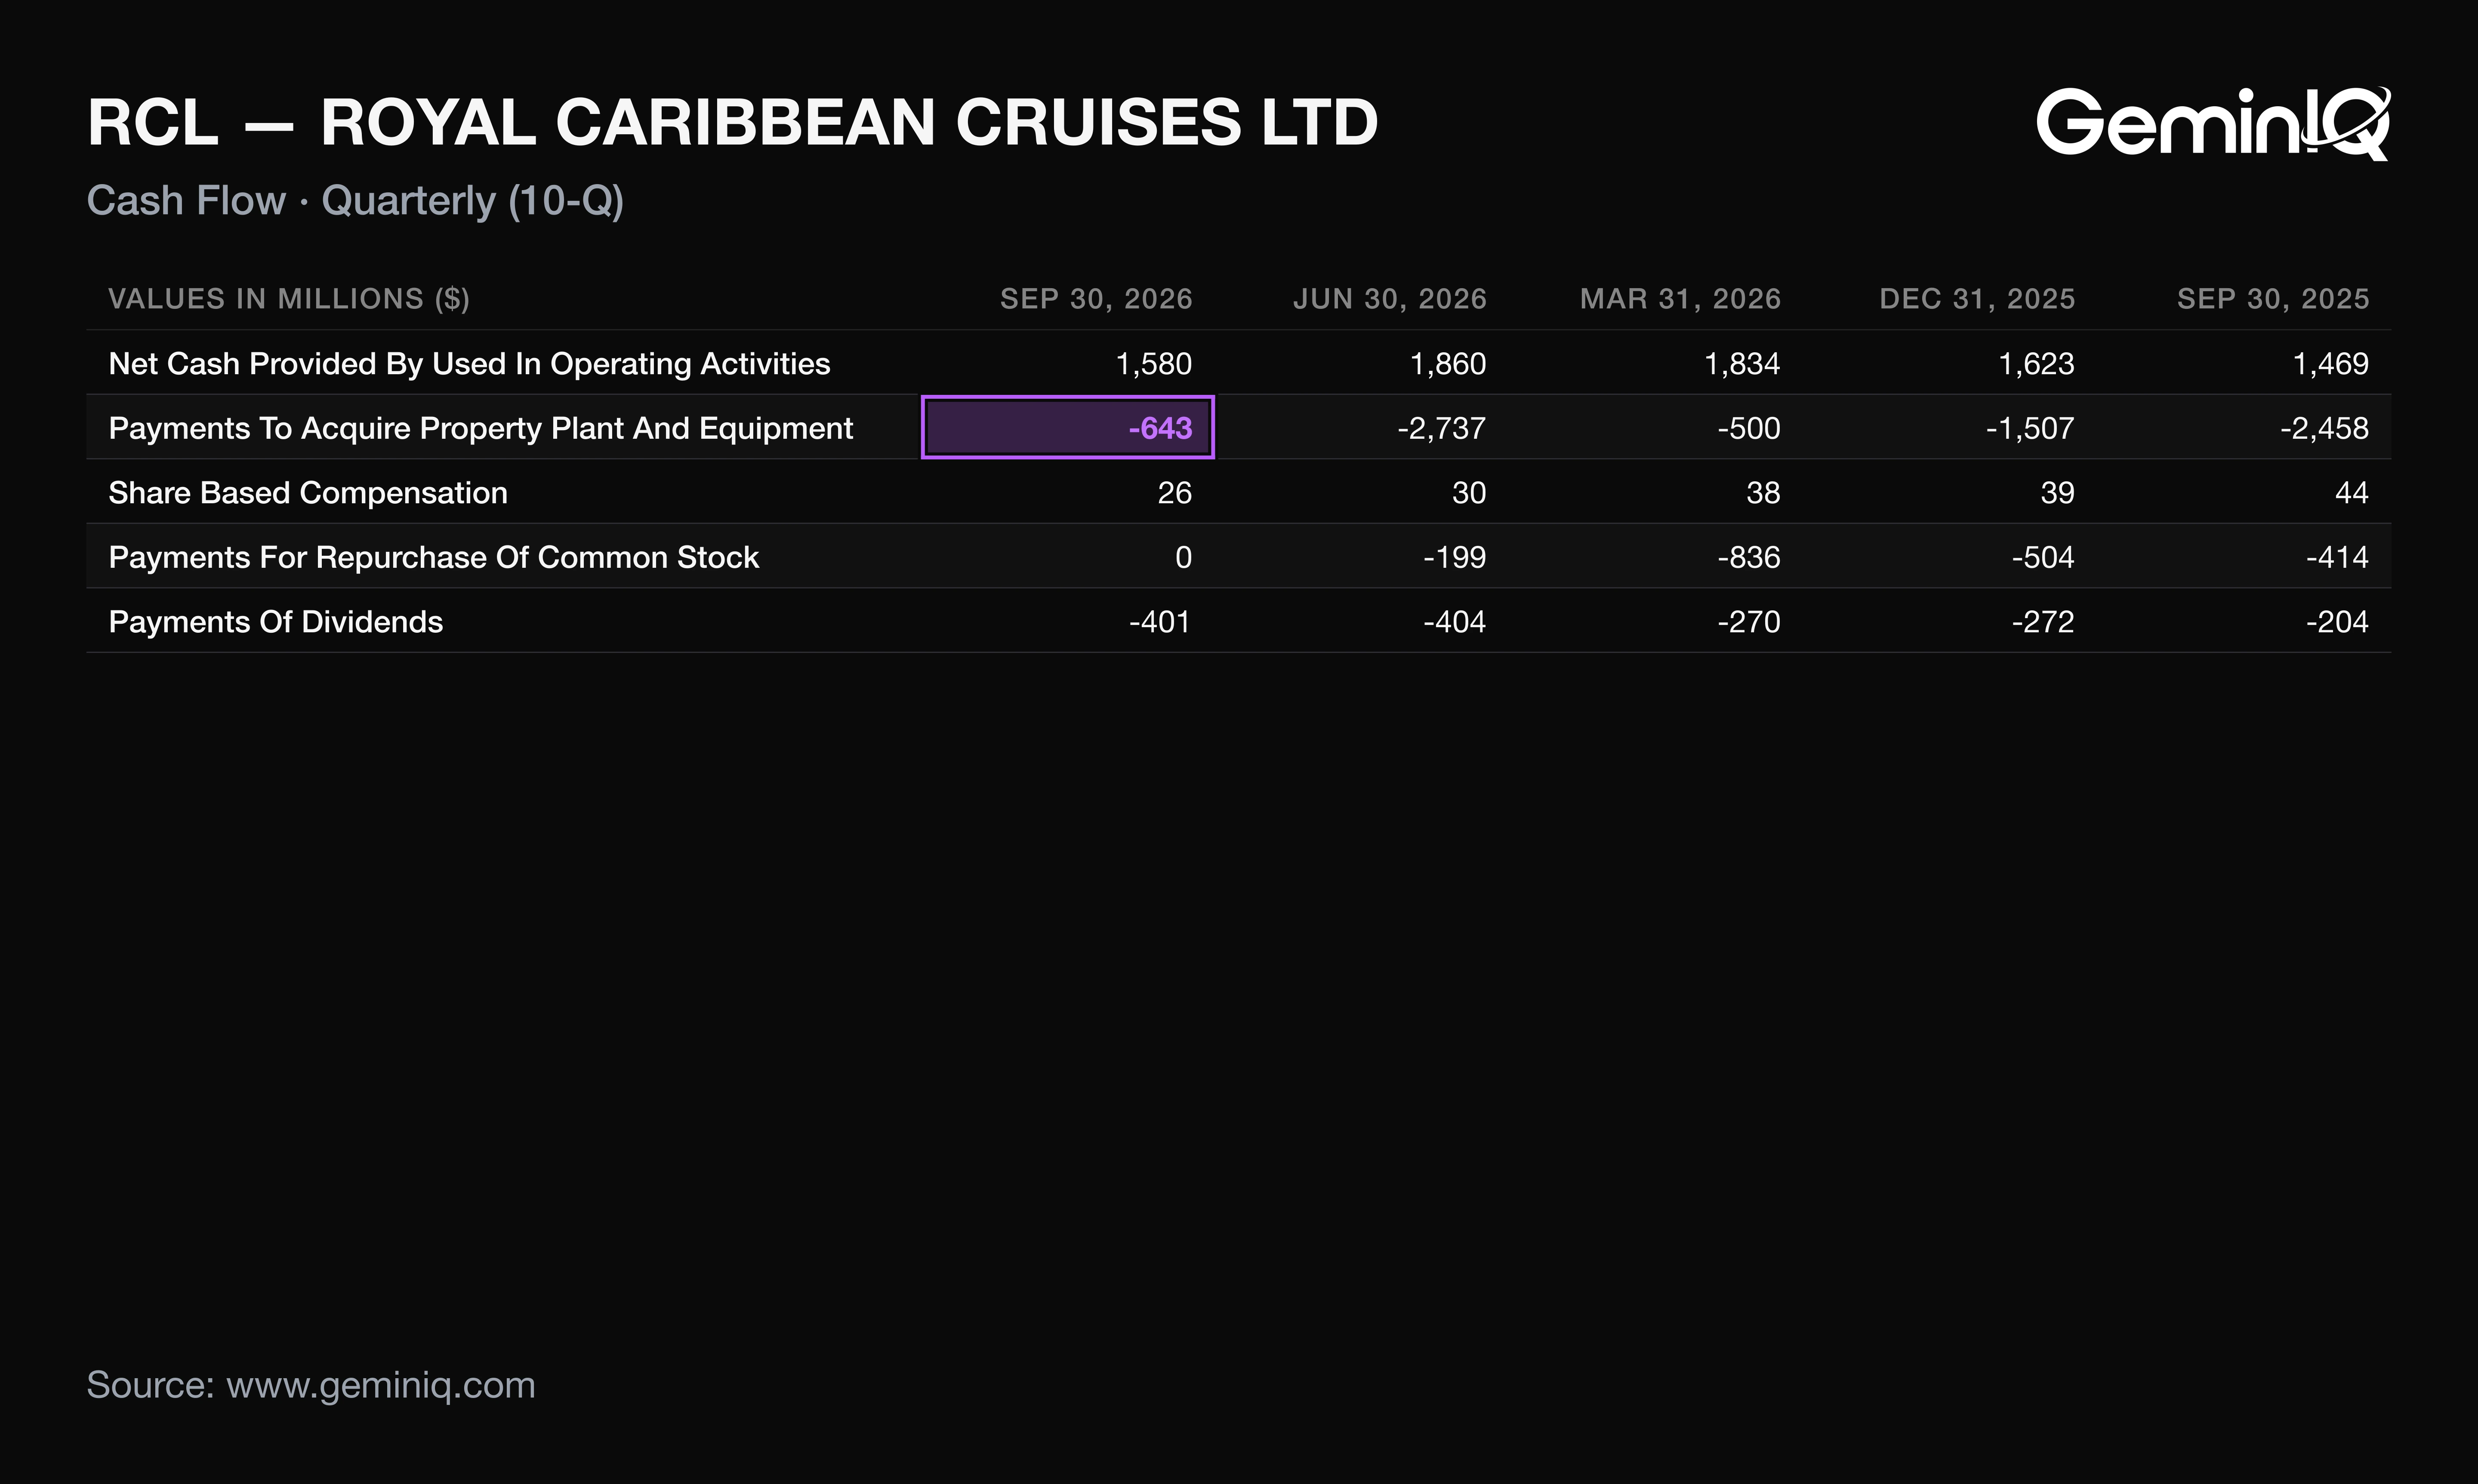
Royal Caribbean's Q3 2026 free cash flow was $937 million, against negative $877 million in Q2 and negative $989 million a year earlier. The swing is a capital spending calendar, not a step change in cash generation.
The Data: Capital expenditure fell to $643 million from $2.74 billion in Q2, the quarter Legend of the Seas was delivered. Operating cash flow was $1.58 billion, 91% of net income, down 15.1% from Q2. Trailing-twelve-month free cash flow is $1.51 billion, down 25.8%, according to GeminIQ's pre-calculated Free Cash Flow. Dividends paid were $401 million, double the $204 million a year earlier, and $1.35 billion over twelve months, about 89% of that trailing free cash flow.
Why: The dividend is $1.50 per share a quarter, per the 10-Q's equity note. The company also repurchased 3.7 million shares for $1 billion in nine months, yet diluted shares were flat at 268 million from Q2. Interest expense rose 17% to $291 million, including $21 million of debt extinguishment loss. Royal Caribbean had $22.87 billion of total debt, GeminIQ's pre-calculated Net Debt to EBITDA was 3.01x against 3.16x, and the current ratio was 0.22x. The 8-K lists $2.4 billion of 2027 maturities, and the pending Sandals and Beaches stake costs about $3.0 billion, twice trailing free cash flow, backed by a $3 billion 364-day term loan.
Royal Caribbean's 2026 Guidance After Q3
The 8-K raised Royal Caribbean's full-year 2026 adjusted EPS guidance to $17.85 to $17.95 from $17.73 to $17.87, lifting the midpoint $0.10 to $17.90. The raise rests on revenue, not costs.
The Data: Q3 net yields rose 0.9% against guidance of approximately flat, and the full-year net yield outlook moved to approximately 2.7% from 2.35% to 2.85%. Q3 cost per available passenger cruise day, excluding fuel, fell 1.9%, below the guided decline of 1.7% to 1.2%. The full-year cost guide stayed at approximately plus 0.4%. Nine-month adjusted diluted EPS was $14.36, so the $17.90 midpoint implies about $3.54 for Q4, inside the company's $3.48 to $3.58 Q4 range.
Why: A full-year cost guide that did not move after a Q3 cost reading below its range means the company expects the difference to return in Q4. The 8-K also names higher fuel costs and currency as partial offsets to the raise.
How RCL Stock Has Moved After Past Earnings Reports
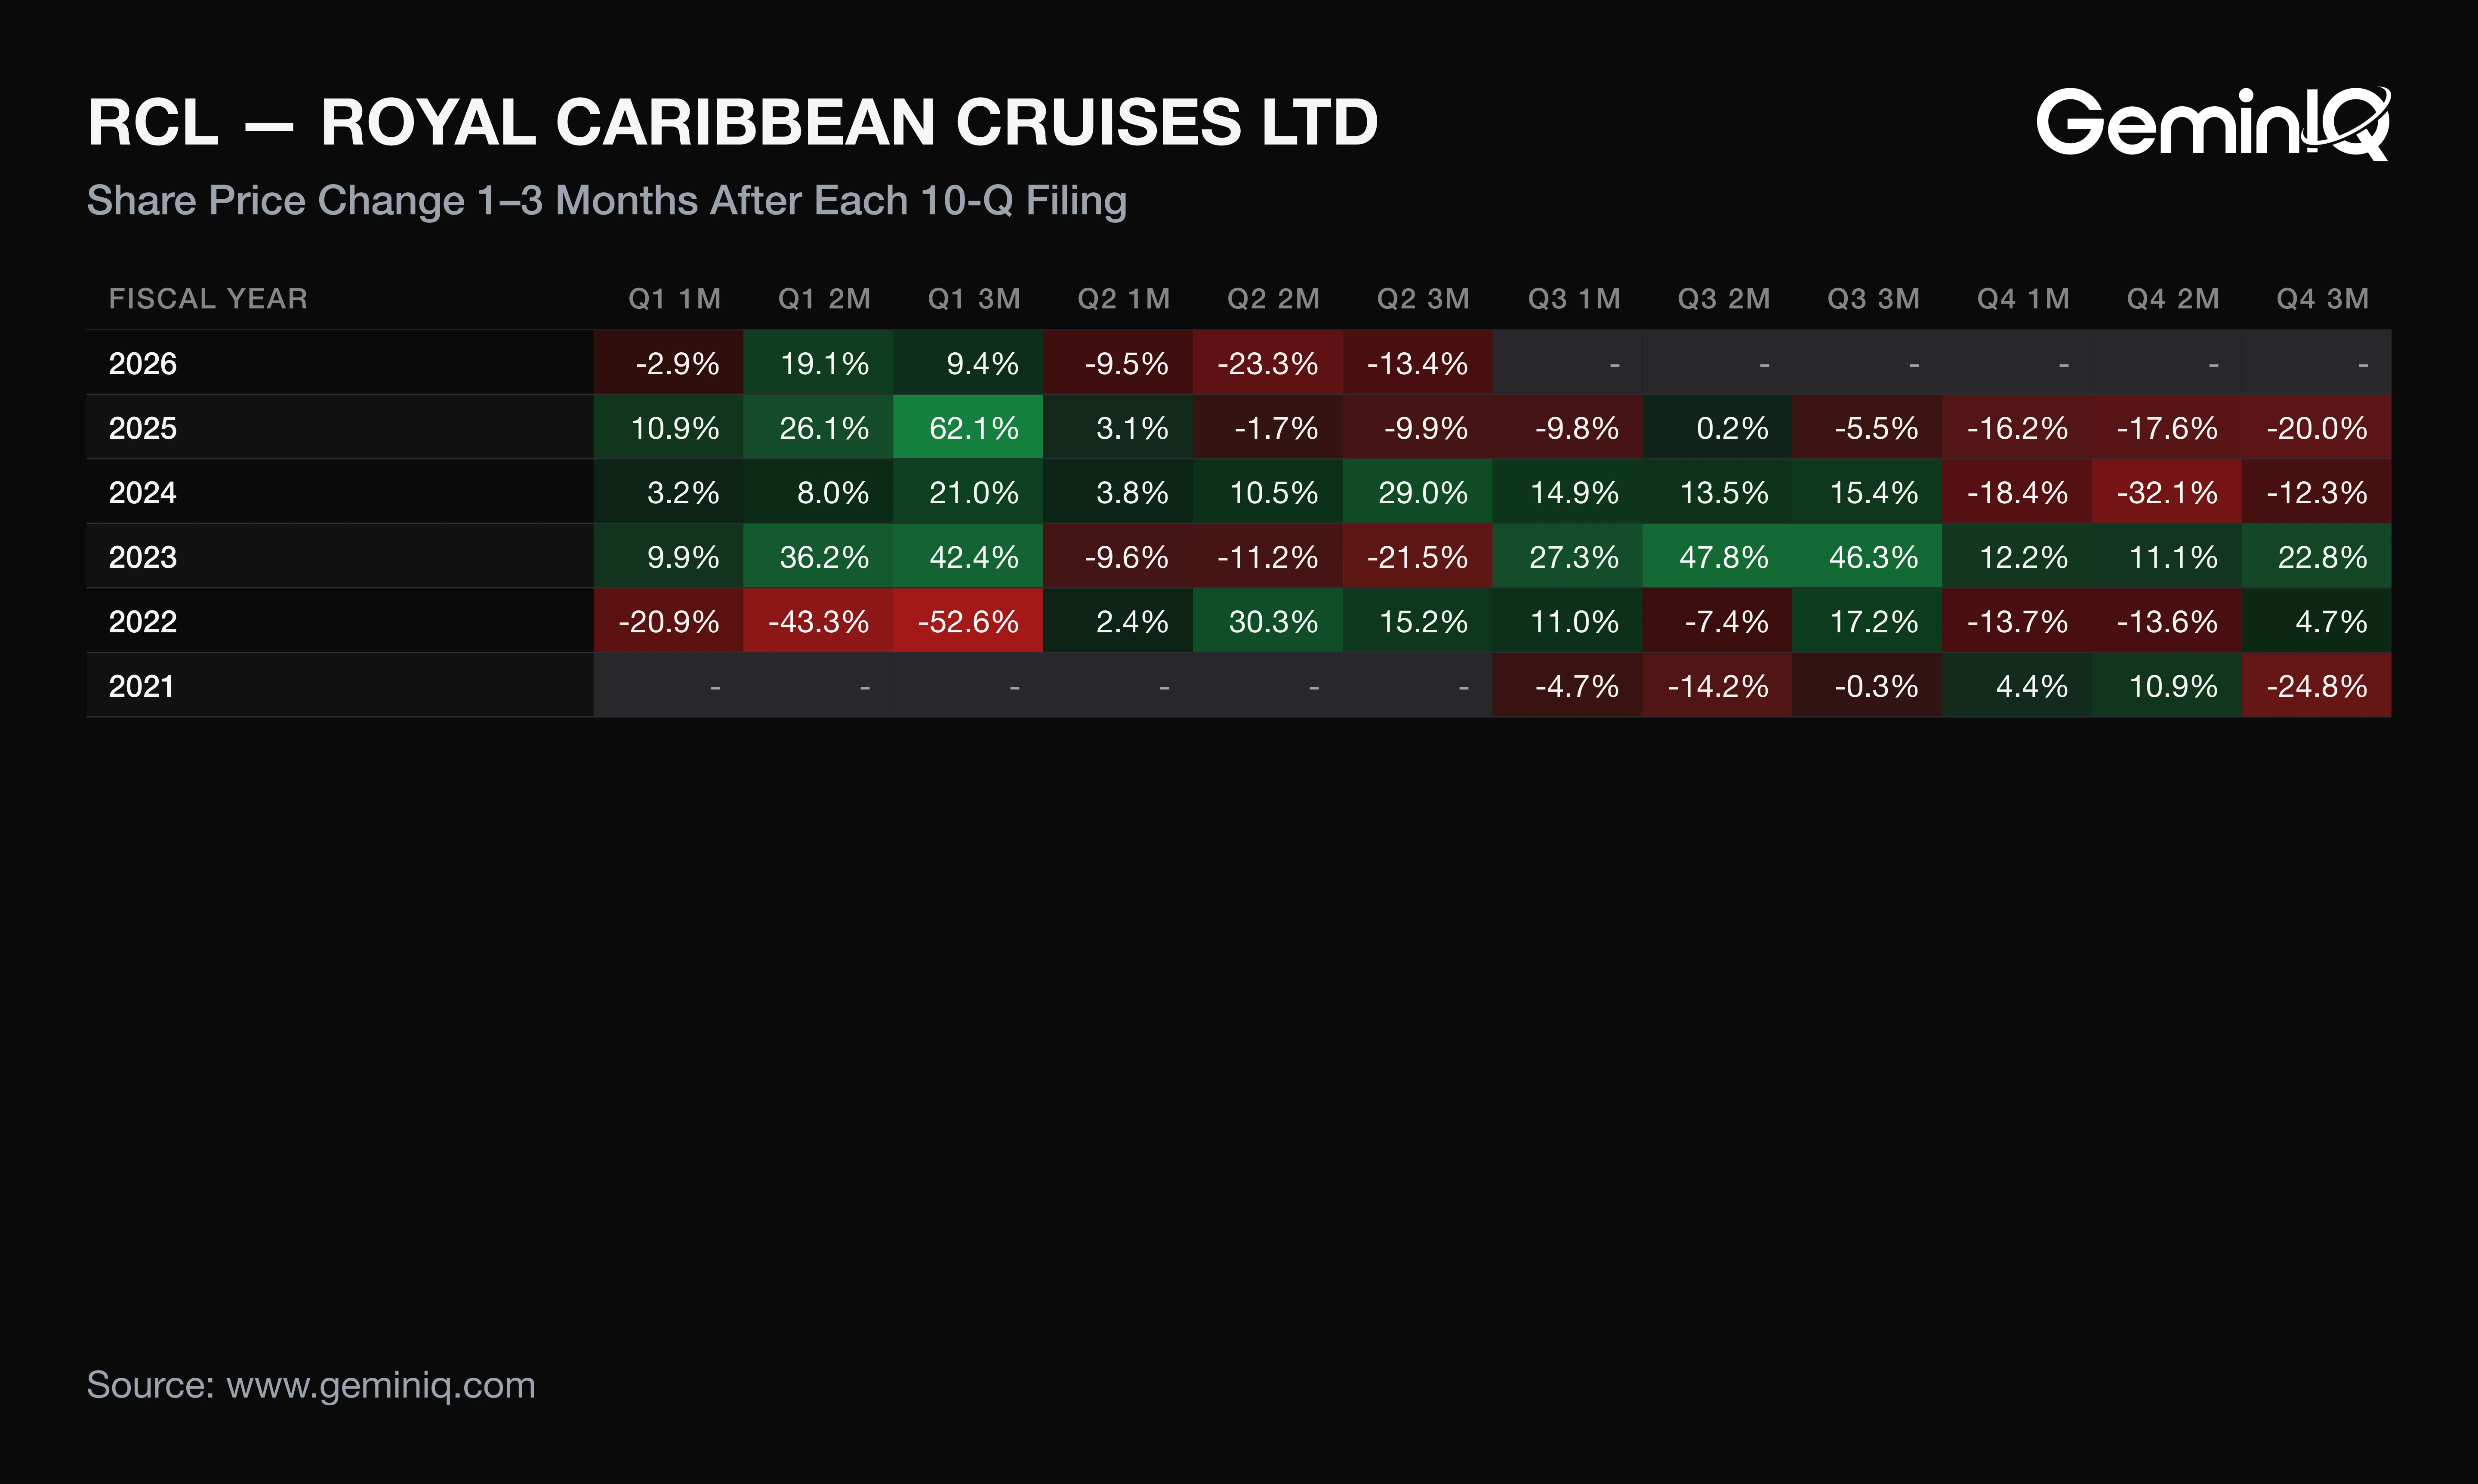
RCL's one-month return after its last 12 completed 10-Q filings had a median of +3.2%, positive after 7 of 12, from -18.4% to +27.3%. The three-month median was +12.4%, also positive after 7 of 12.
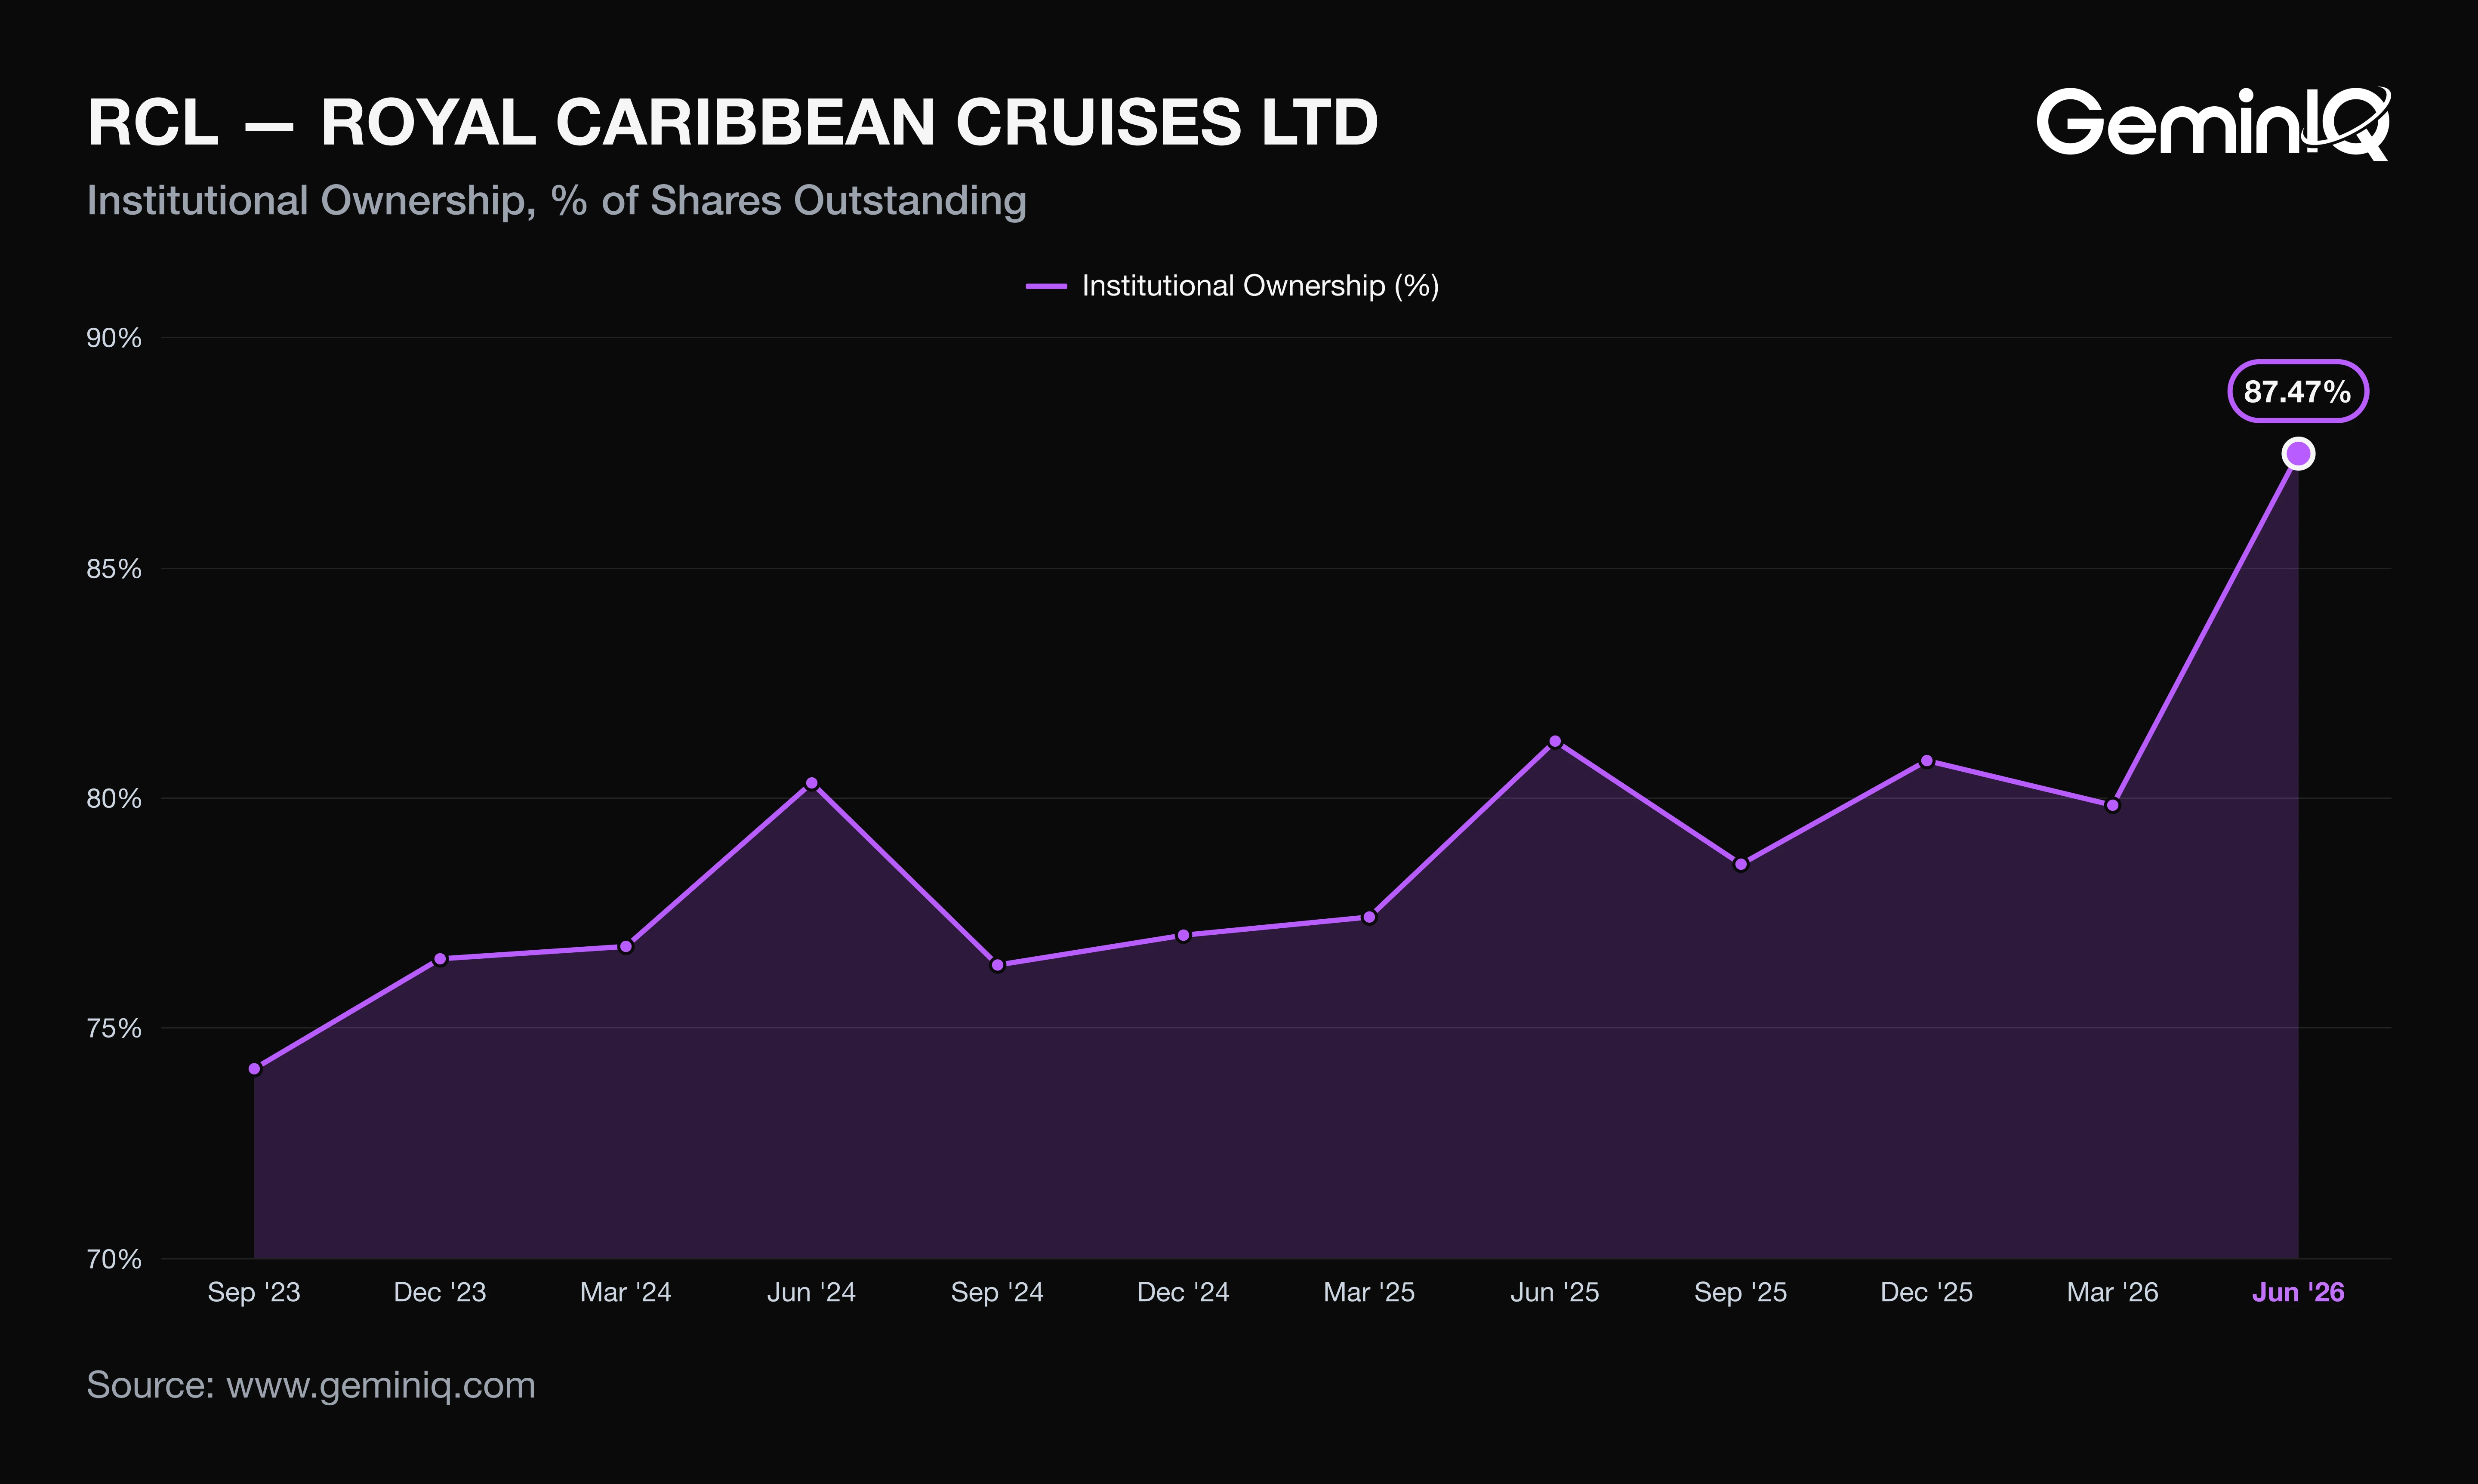
The Data: The weakest three-month window, -20.0%, followed the filing of February 11, 2026. Institutions held 87.47% of shares at June 30, 2026, up 6.24 points from a year earlier and the highest of the last 16 quarters. Over the 12 months through July 29, 2026, insiders sold $641.3 million across 21 sales and bought nothing. Arne Alexander Wilhelmsen accounted for 86% of the dollars, against 74% of $262.6 million a year earlier.
Why: These figures describe how Royal Caribbean's stock moved after its past filings; they are a historical association, not a forecast. Sell-heavy insider data is the population norm of about 3 sales per purchase, and one seller's weight explains most of the total. The GeminIQ Earnings Reaction Heat Map shows the fiscal-year grid, and this filing's window has not yet elapsed.
A margin gain built on a cost line that management calls timing is borrowed from the next quarter, and the matching line in the next filing is where the loan comes due.
Frequently Asked Questions
Is Royal Caribbean doing well financially?
Royal Caribbean's trailing-twelve-month operating margin at September 30, 2026 was 27.56%, up 1.19 points, and its net margin was 23.83%. GeminIQ's pre-calculated Return on Invested Capital was 16.17% against 15.53% a year earlier. Net debt was 3.01 times EBITDA.
When does Royal Caribbean report earnings?
Royal Caribbean reported Q3 2026 results and filed its 10-Q on October 27, 2026. Last year it filed its fourth-quarter results on February 11, 2026, a pattern from the filing record, not a forecast of the next date.
Does Royal Caribbean pay a dividend?
Royal Caribbean paid $401 million of dividends in Q3 2026 and $1.35 billion over the trailing twelve months. Its board declared $1.50 per share in the quarter, paid in October 2026.
How has RCL stock reacted after past third-quarter reports?
One-month returns after the last three Q3 filings were +27.3% (FY2023), +14.9% (FY2024) and -9.8% (FY2025). Three-month returns were +46.3%, +15.4% and -5.5%. That is a historical association across three observations.
Wall Street's data. Main Street's price.
Institutional terminals charge thousands a year for as-filed accuracy. GeminIQ gives you the same thing for a fraction of the cost: financials built directly from raw SEC EDGAR filings, not third-party APIs, with full XBRL traceability back to the original 10-K or 10-Q. No normalized guesswork, just calculated metrics, charts, screeners, and watchlists built on numbers exactly as the company reported them. Start researching now at GeminIQ.com.
All financial figures cited in this article reference ROYAL CARIBBEAN CRUISES LTD.'s Q3 2026 10-Q (filed October 27, 2026, period ending September 30, 2026), with guidance and management commentary drawn from the company's Form 8-K earnings release (filed October 27, 2026). All SEC filings are publicly available at SEC EDGAR and SEC EDGAR.
Disclaimer: The content in this blog is for educational and entertainment purposes only and does not constitute financial, legal, or tax advice. Investing involves risk, including the loss of principal. The views expressed are my own and not intended as financial advice or a guarantee of future performance.