
Tesla (TSLA) Q3 2026 Earnings: EPS Down 44%, Opex Up 39%

By Chad Hartman
Published · Last updated
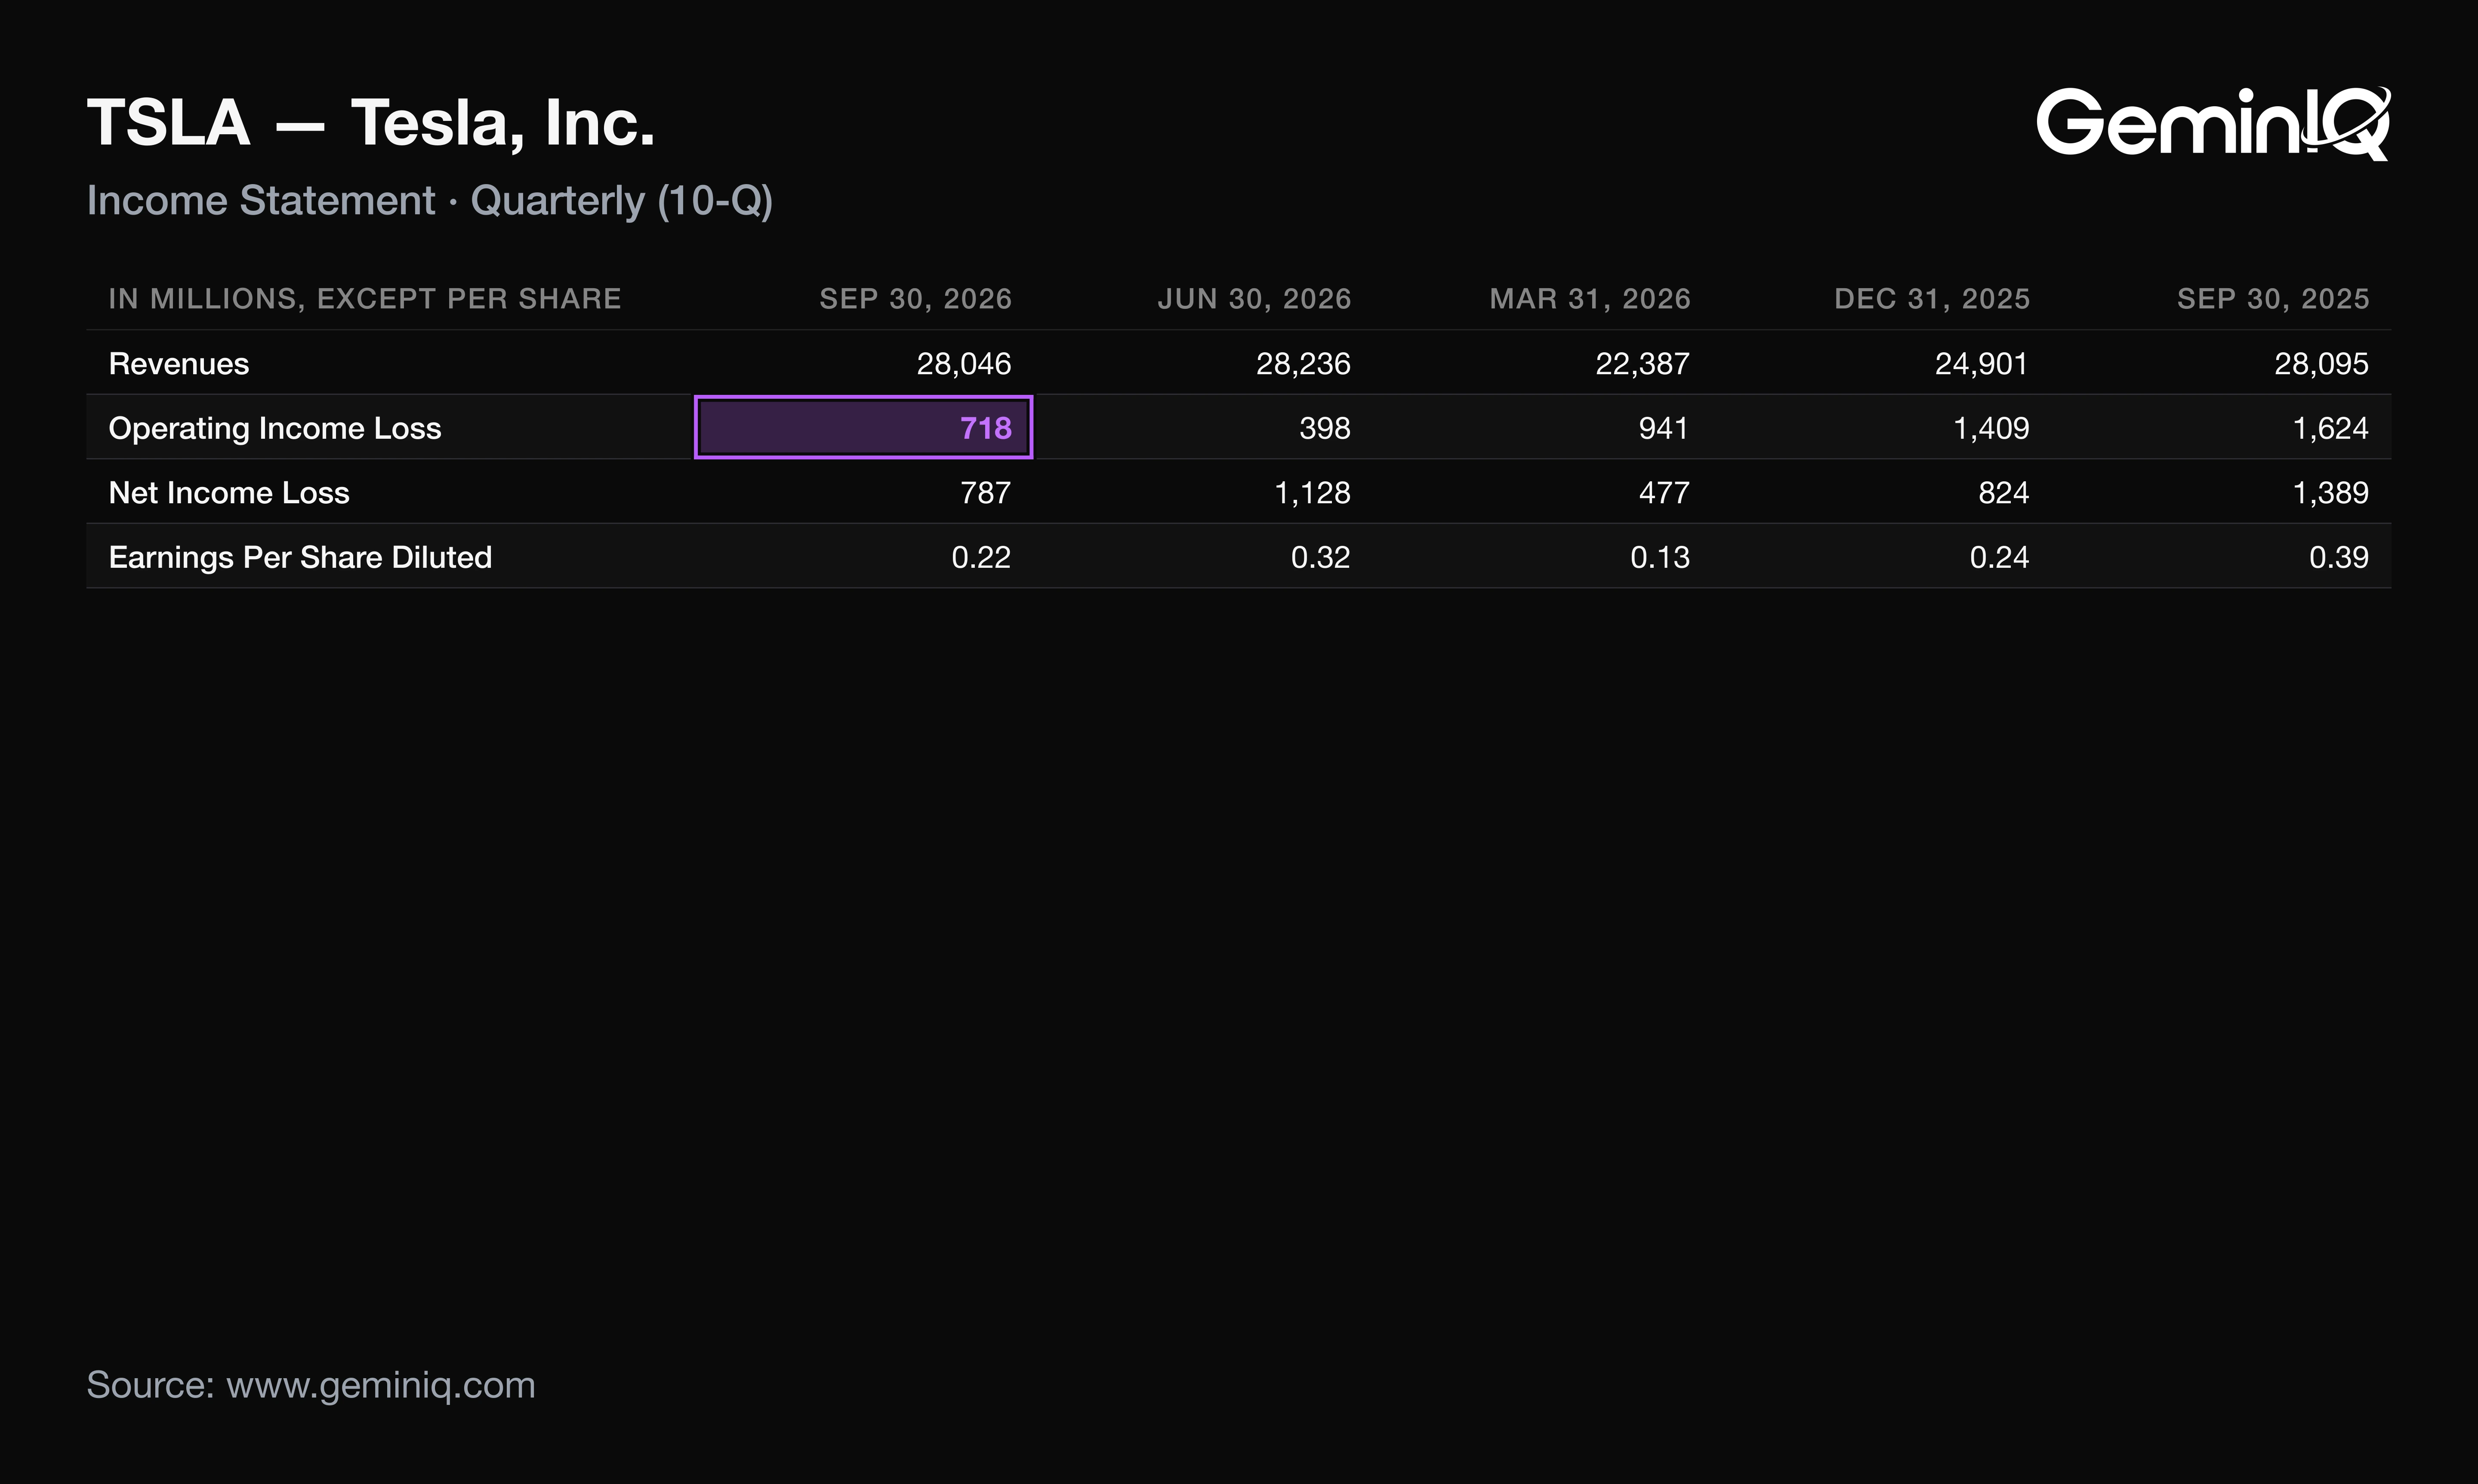
Tesla (TSLA) filed Q3 FY2026 revenue of $28.05 billion, down 0.2%, and diluted EPS of $0.22, down 43.6%, for the quarter ended September 30, 2026; the company reported the quarter on October 21 and filed its 10-Q on October 22. Gross profit rose 8.7% in the same quarter, yet operating income fell 55.8% to $718 million, because operating expenses grew $1.35 billion, three times the $440 million of gross profit gained. The release led with $0.48 of non-GAAP EPS; the 10-Q reports $0.22.
| Field | Value |
|---|---|
| Company | Tesla ($TSLA) |
| Quarter | Q3 FY2026, period ended September 30, 2026 |
| Earnings release | October 21, 2026 (Form 8-K) |
| 10-Q filed | October 22, 2026 |
| Revenue | $28.05 Billion (-0.2% YoY) |
| Diluted EPS | $0.22 (-43.6% YoY) |
| Operating margin | 2.6% (-3.2 pts YoY) |
| Operating cash flow (TTM) | $18.71 Billion |
| Operating expenses | $4.78 Billion (+39.2% YoY) |
Tesla Q3 2026 Revenue, EPS and Operating Margin
Tesla's Q3 2026 diluted EPS was $0.22, down 43.6% from $0.39 and the third lowest of the last 16 quarters, on revenue that was flat at $28.05 billion. Spending outran gross profit, and a lower tax rate cushioned part of the drop.
Revenue held while its parts moved, the 10-Q shows: services and other revenue rose 33% to $4.61 billion, automotive revenue fell 3% to $20.56 billion, and energy generation and storage fell 16% to $2.88 billion. A reader who saw flat revenue and a gross margin up 1.6 points to 19.6%, the fifth highest of the last 16 quarters, would expect operating income to hold. Instead it fell.
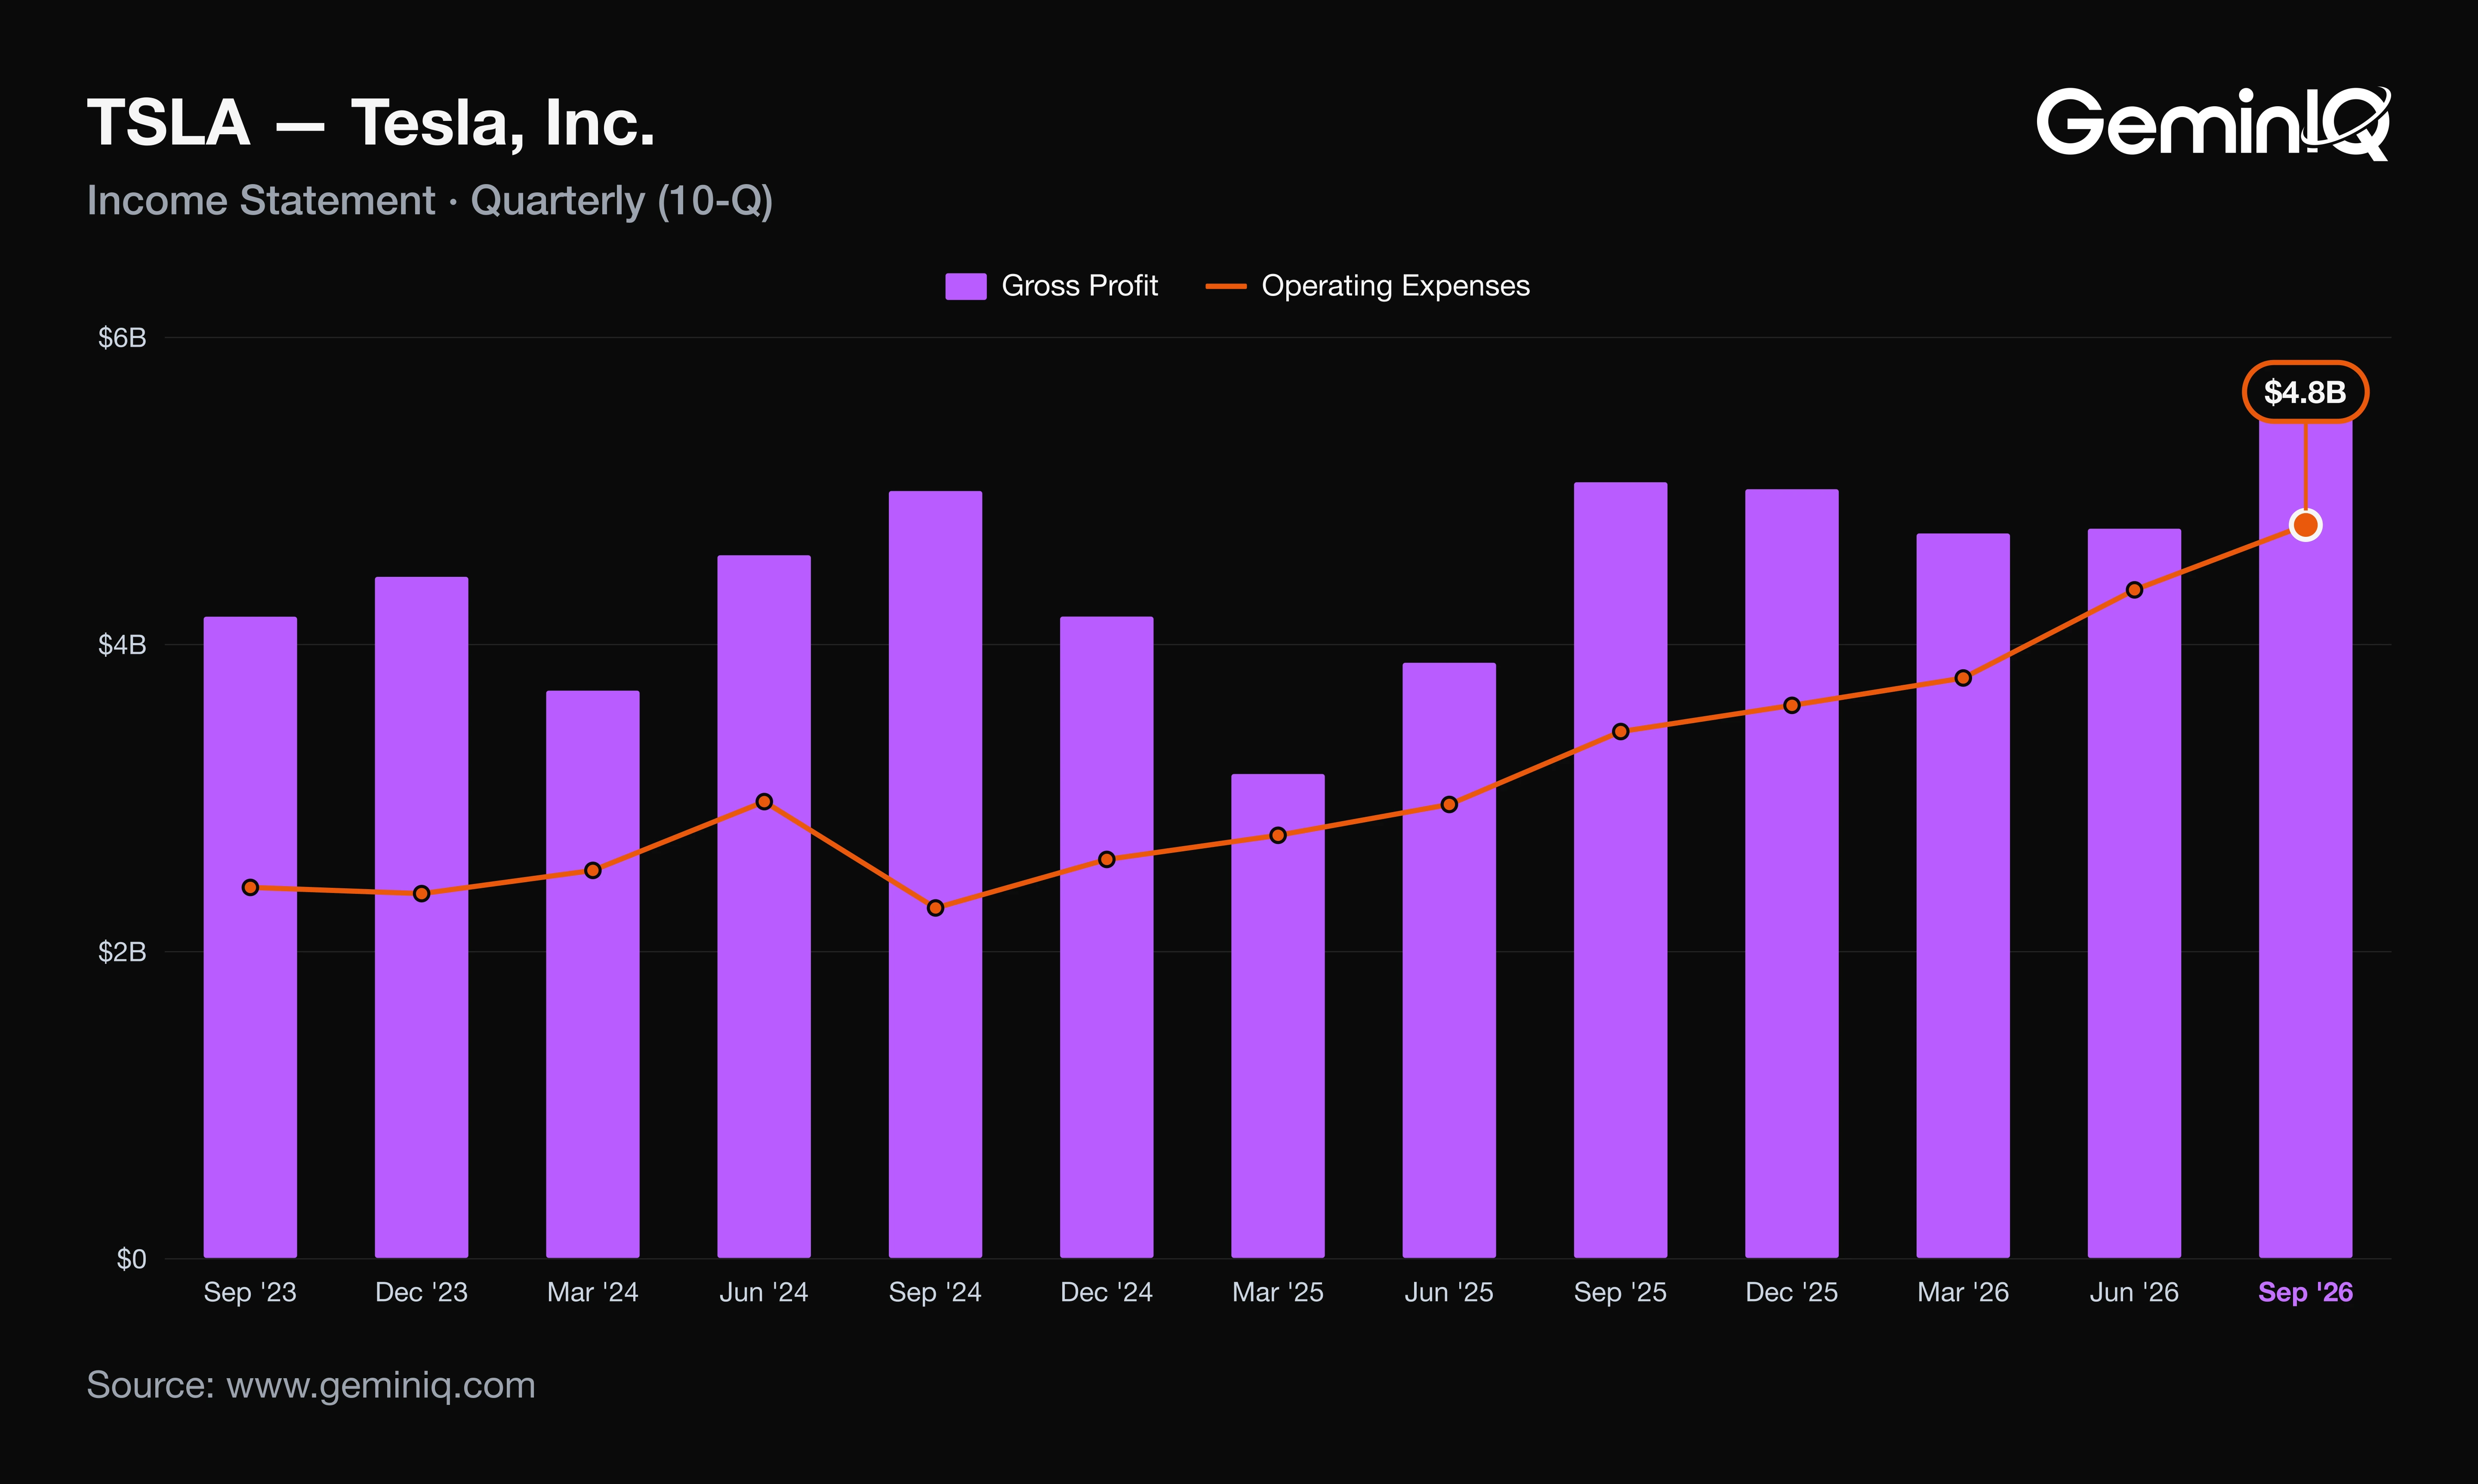
The Data: Gross profit rose $440 million to $5.49 billion. Operating expenses rose $1.35 billion to $4.78 billion, so operating income fell to $718 million from $1.62 billion. Operating margin was 2.6%, down 3.2 points and the third lowest of the last 16 quarters; GeminIQ's pre-calculated Operating Profit Margin for the trailing twelve months was 3.35%, against 4.74% a year earlier.
Why: R&D rose 69% to $2.76 billion, which the 10-Q attributes to SI, Optimus, silicon, battery and new vehicle programs plus $178 million more stock-based compensation. SG&A rose 29% to $2.02 billion, including a $293 million increase in stock-based compensation that the filing links primarily to the 2025 CEO Performance Award. Year-ago operating expenses held $238 million of restructuring that this quarter lacks, so excluding it they rose about 50%. Below the line, GeminIQ's Effective Tax Rate fell to 16% from 29%; at last year's rate, diluted EPS would have been about $0.19 instead of $0.22.
What Tesla's Q3 2026 10-Q Shows Beyond the Press Release
The October 21 release led with $1.7 billion of non-GAAP net income and $0.48 of non-GAAP diluted EPS; the 10-Q filed October 22 reports GAAP net income attributable to common stockholders of $787 million and $0.22. The distance between the two more than doubled in a year.
The Data: In the release's quarterly table, Q3 2025 non-GAAP EPS was $0.50 against GAAP $0.39, a gap of $0.11. Q3 2026's gap is $0.26. In dollars, non-GAAP net income exceeded GAAP by $397 million a year ago and by $910 million now. The 8-K shows no non-GAAP gap that large in any of the five quarters it prints. The 10-Q's expense discussion names $471 million of added stock-based compensation across R&D and SG&A.
Why: Not a rounding difference. The reconciliation in the release itemizes the adjustments, and the filing's own expense lines show where one large piece arose: the 2025 CEO Performance Award, whose expense the 10-Q also calls non-deductible for tax. Cash costs are untouched by that charge, but the GAAP line carries it, and so does the $0.22. The filing also complicates the margin story: it credits tariff refunds with lowering cost of automotive and energy revenue while cutting Megapack revenue, and it does not quantify either effect, so how much of the 19.6% gross margin comes from refunds is not stated.
Tesla Q3 2026 Free Cash Flow, Capex and Debt
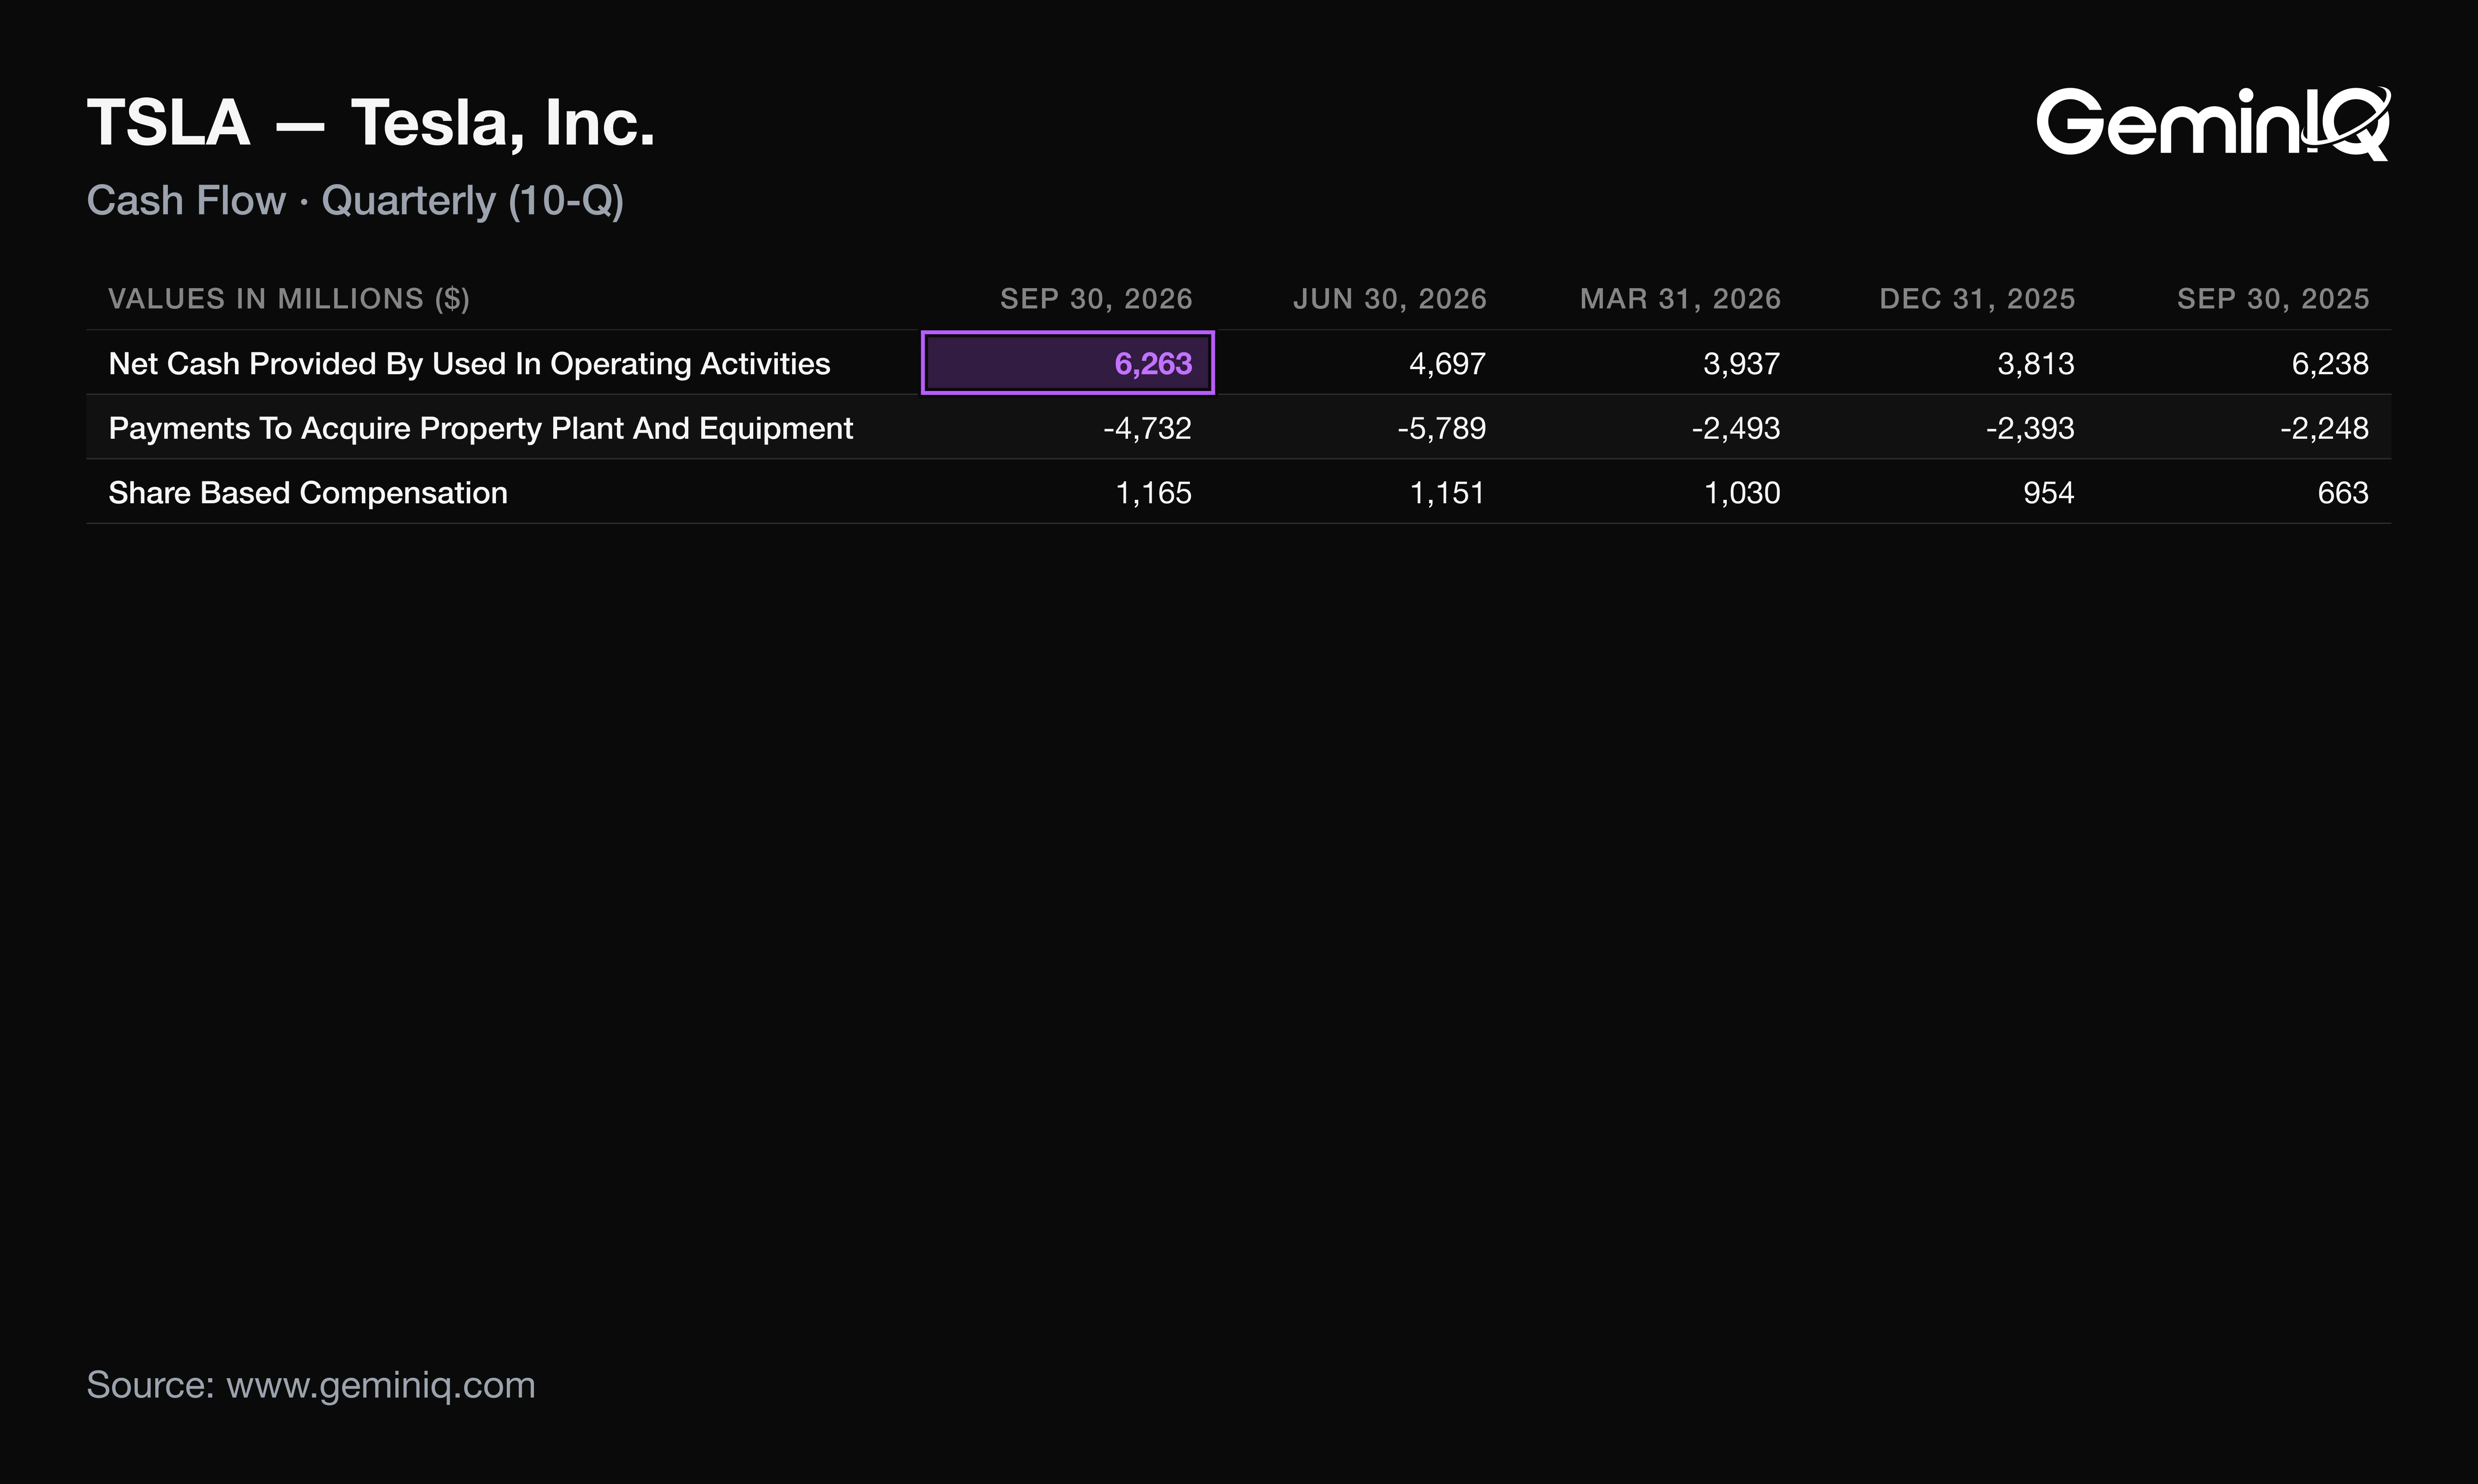
Tesla's Q3 2026 operating cash flow was $6.26 billion, up 0.4% year over year and the highest of the last 16 quarters, yet capex of $4.73 billion, up 110.5%, left free cash flow at $1.53 billion, down 61.6%. The cash engine posted its best quarter in that window while what it leaves over shrank.
The Data: Trailing-twelve-month operating cash flow was $18.71 billion, up 18.8%; trailing free cash flow was $3.30 billion, down 51.7%. Nine-month capex was $13.01 billion, and the 10-Q says Tesla expects capex above $20 billion in 2026. That implies more than $6.99 billion in Q4, above any quarter of the last 16, whose peak was $5.79 billion in Q2. The 10-Q lists cash and short-term investments of $45.45 billion and principal debt of $9.28 billion; GeminIQ's Net Debt to EBITDA was -5.15x, against -4.04x a year earlier. Trailing ROIC fell to 3.90% from 5.90%.
Why: The 10-Q ties the capex to compute infrastructure and data centers, manufacturing and R&D lines, and a growing fleet of company-operated SI-enabled assets. In September Tesla signed three credit agreements with $30 billion of commitments, all unused at quarter end, and states that periods of heavy capex will need funding beyond operating cash flow. Tesla paid no dividend in the quarter. The cash is being committed to assets that, on ROIC so far, earn less than the capital already employed.
How TSLA Stock Has Moved After Past Earnings Reports
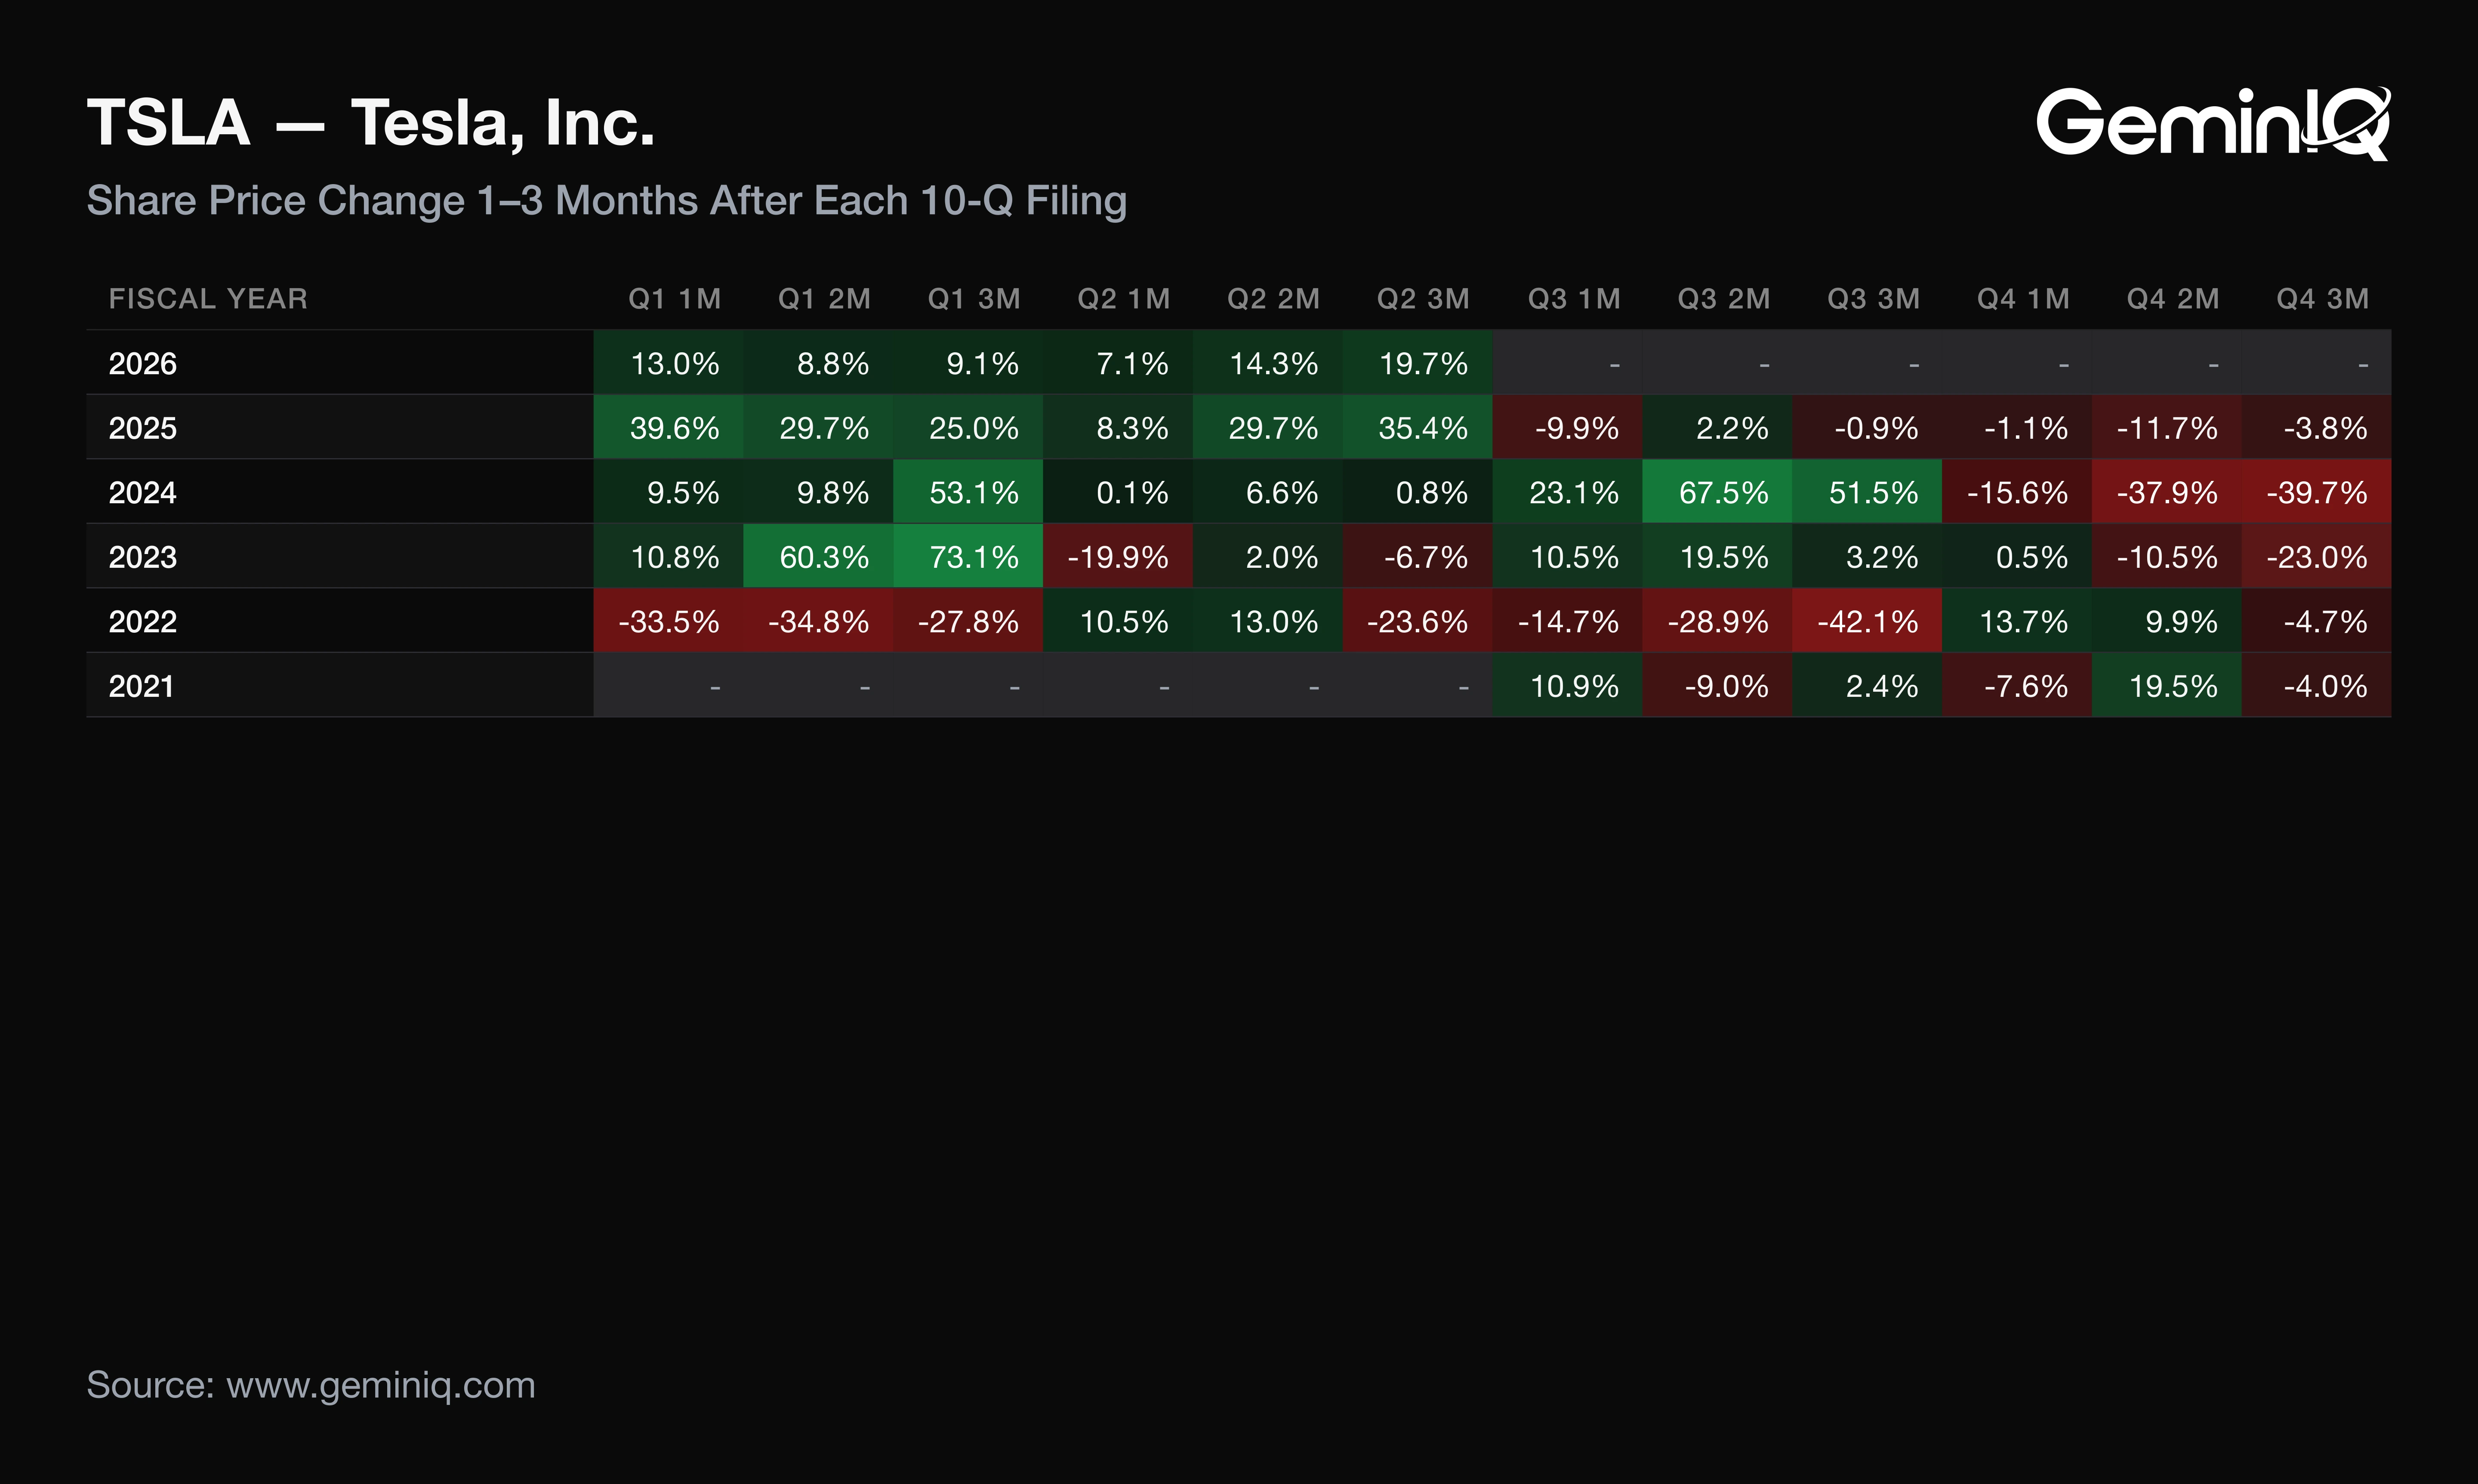
Across Tesla's last 12 10-Q filings with a completed one-month window (filed October 23, 2023 to July 23, 2026), the median one-month return after filing was +7.7%, and it was positive after 9 of 12. The three-month median was +6.2%, positive after 8 of 12. These figures describe how Tesla's stock moved after its past filings; they are a historical association, not a forecast.
The Data: The one-month range ran from -15.6% (FY2024 Q4, filed January 30, 2025) to +39.6% (FY2025 Q1, filed April 23, 2025). Past Q3 filings were followed by one-month returns of +10.5% (FY2023), +23.1% (FY2024) and -9.9% (FY2025). The row for this filing has no returns yet because its window has not elapsed. The Earnings Reaction Heat Map shows the 1-3 months after each 10-Q filing.
Why: The spread, not the median, is what the history measures. The 12 one-month windows span 55.2 points, so +7.7% marks the middle of a wide distribution rather than a typical outcome.
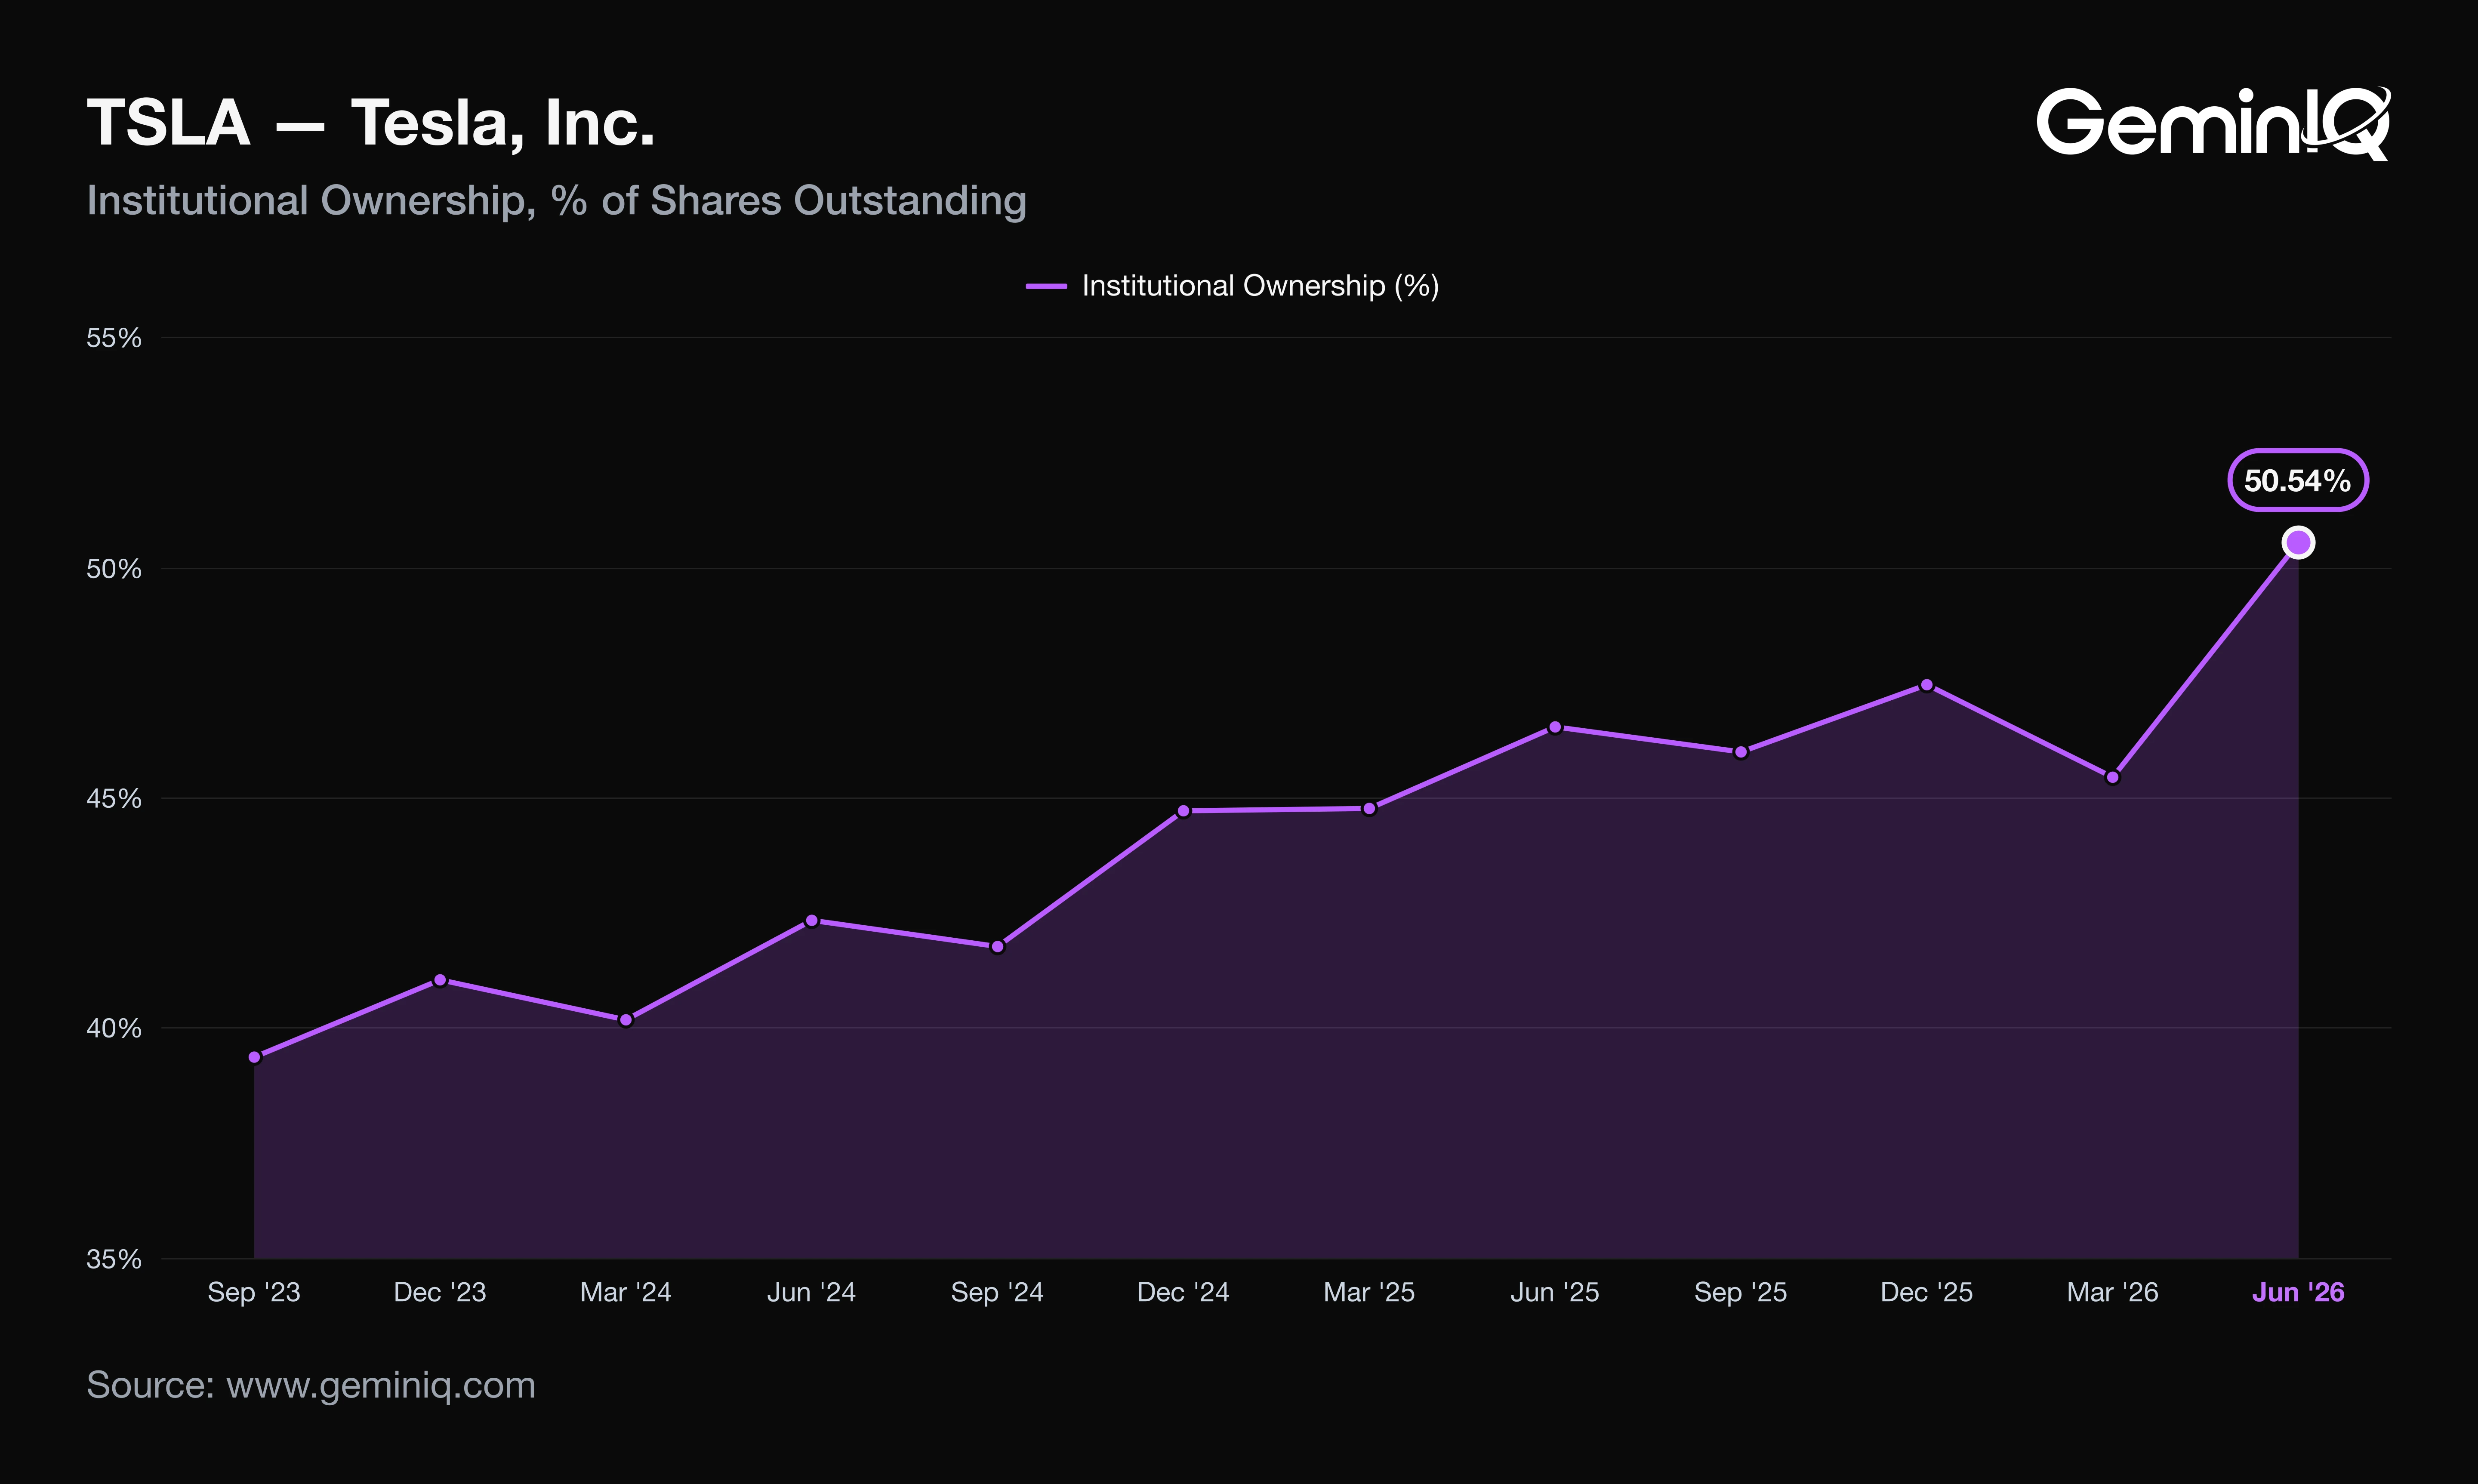
Ownership context is dated. GeminIQ's SEC Form 13F data puts institutions at 50.54% of Tesla shares at June 30, 2026, up 4.00 points from 46.53% a year earlier and the highest of the last 16 quarters; the September 30 snapshot has not been filed yet. Form 4 filings through September 8, 2026 show 12 sales totaling $120.4 million over the prior 12 months, against 37 sales totaling $661.2 million in the 12 months before, plus one purchase of $987.5 million dated September 12, 2025.
A gross-profit gain that never reaches operating income says the expense base, not the product, sets the earnings.
Frequently Asked Questions
Is Tesla doing well financially?
Tesla's trailing-twelve-month net profit margin was 3.11% at September 30, 2026, down from 5.40% a year earlier. Its Current Ratio was 1.74x, against 2.07x, and its trailing Operating Cash Flow was $18.71 billion. Profit has narrowed while liquidity remains large, with $45.45 billion in cash and short-term investments.
When does Tesla report earnings?
Tesla reported Q3 2026 results on October 21, 2026 and filed its 10-Q on October 22, 2026. Last year it filed its fourth-quarter results on January 29, 2026, a pattern in the filing record and not a forecast of the next date.
Does Tesla pay a dividend?
Tesla paid no dividend in Q3 2026, in the prior quarter, or in the year-ago quarter, and trailing-twelve-month dividends paid were $0. Its 10-Q describes cash being directed to capex, now expected above $20 billion for 2026.
Where can I verify Tesla's Q3 2026 figures?
Tesla's Q3 2026 figures are in its 10-Q on EDGAR, accession 0001628280-26-066775, filed October 22, 2026. The October 21 earnings release carries the non-GAAP figures and the company's quarterly operating data.
Wall Street's data. Main Street's price.
Institutional terminals charge thousands a year for as-filed accuracy. GeminIQ gives you the same thing for a fraction of the cost: financials built directly from raw SEC EDGAR filings, not third-party APIs, with full XBRL traceability back to the original 10-K or 10-Q. No normalized guesswork, just calculated metrics, charts, screeners, and watchlists built on numbers exactly as the company reported them. Start researching now at GeminIQ.com.
All financial figures cited in this article reference Tesla, Inc.'s Q3 2026 10-Q (filed October 22, 2026, period ending September 30, 2026), with guidance and management commentary drawn from the company's Form 8-K earnings release (filed October 21, 2026). All SEC filings are publicly available at SEC EDGAR and SEC EDGAR.
Disclaimer: The content in this blog is for educational and entertainment purposes only and does not constitute financial, legal, or tax advice. Investing involves risk, including the loss of principal. The views expressed are my own and not intended as financial advice or a guarantee of future performance.