Western Digital (WDC) Q1 FY2027 Earnings: EPS Up 51%, Shares Up 3.6%

By Chad Hartman
Published · Last updated
Western Digital (WDC) reported Q1 FY2027 revenue of $4.38 billion, up 55.5%, and diluted EPS of $4.63, up 50.8%, for the quarter ended October 2, 2026; the company released results on October 22 and filed its 10-Q on October 23. Operating income rose 158% year over year, yet the share count rose too: 374 million shares were outstanding at quarter-end, against 361 million on July 3, 2026, in a quarter when the company spent $1.00 billion on repurchases. The 10-Q shows why. Settling convertible notes issued about 14 million shares, seven times the 2.0 million bought back.
| Field | Value |
|---|---|
| Company | Western Digital ($WDC) |
| Quarter | Q1 FY2027, period ended October 2, 2026 |
| Earnings release | October 22, 2026 (Form 8-K) |
| 10-Q filed | October 23, 2026 |
| Revenue | $4.38 Billion (+55.5% YoY) |
| Diluted EPS | $4.63 (+50.8% YoY) |
| Operating margin | 46.7% (+18.6 pts YoY) |
| Operating cash flow (TTM) | $4.86 Billion |
| Shares outstanding | 374 million (+3.6% vs July 3, 2026) |
Western Digital Q1 FY2027 Revenue, EPS and Operating Margin
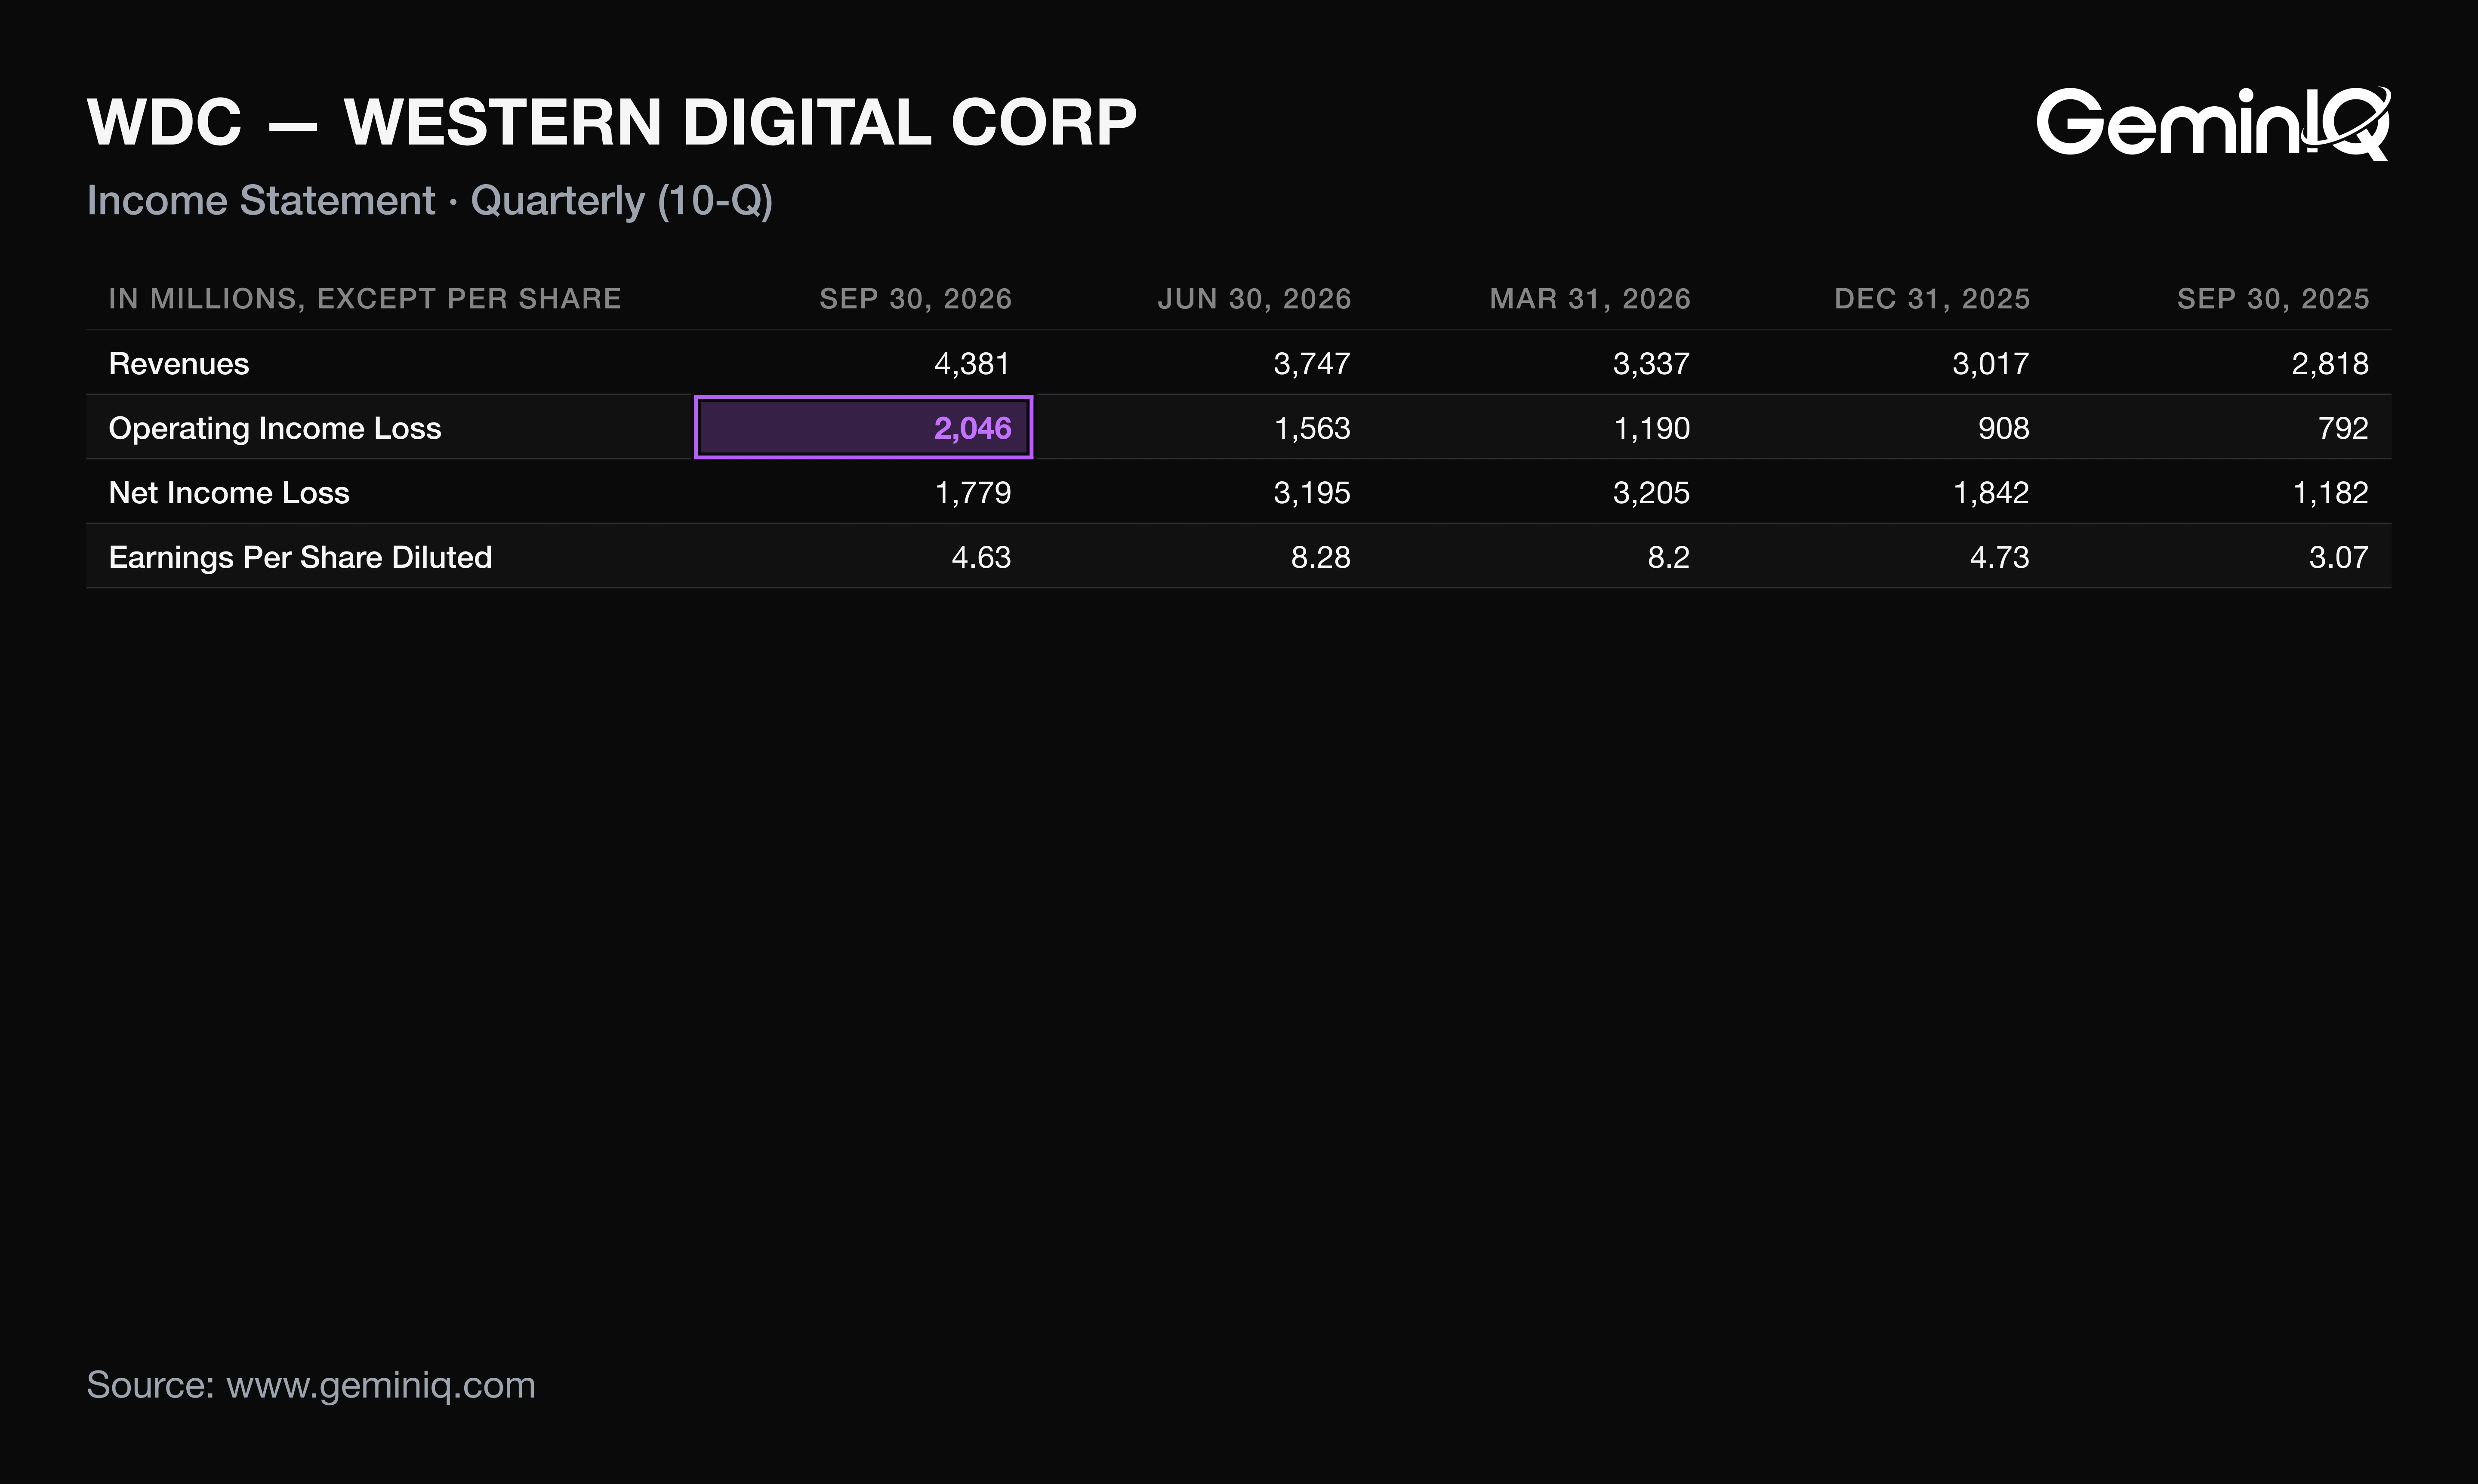
Western Digital's Q1 FY2027 revenue was $4.38 billion, up 55.5% from a year earlier and the highest of the last 16 quarters. Operating income grew nearly three times as fast as revenue, while net income grew 50.5%.
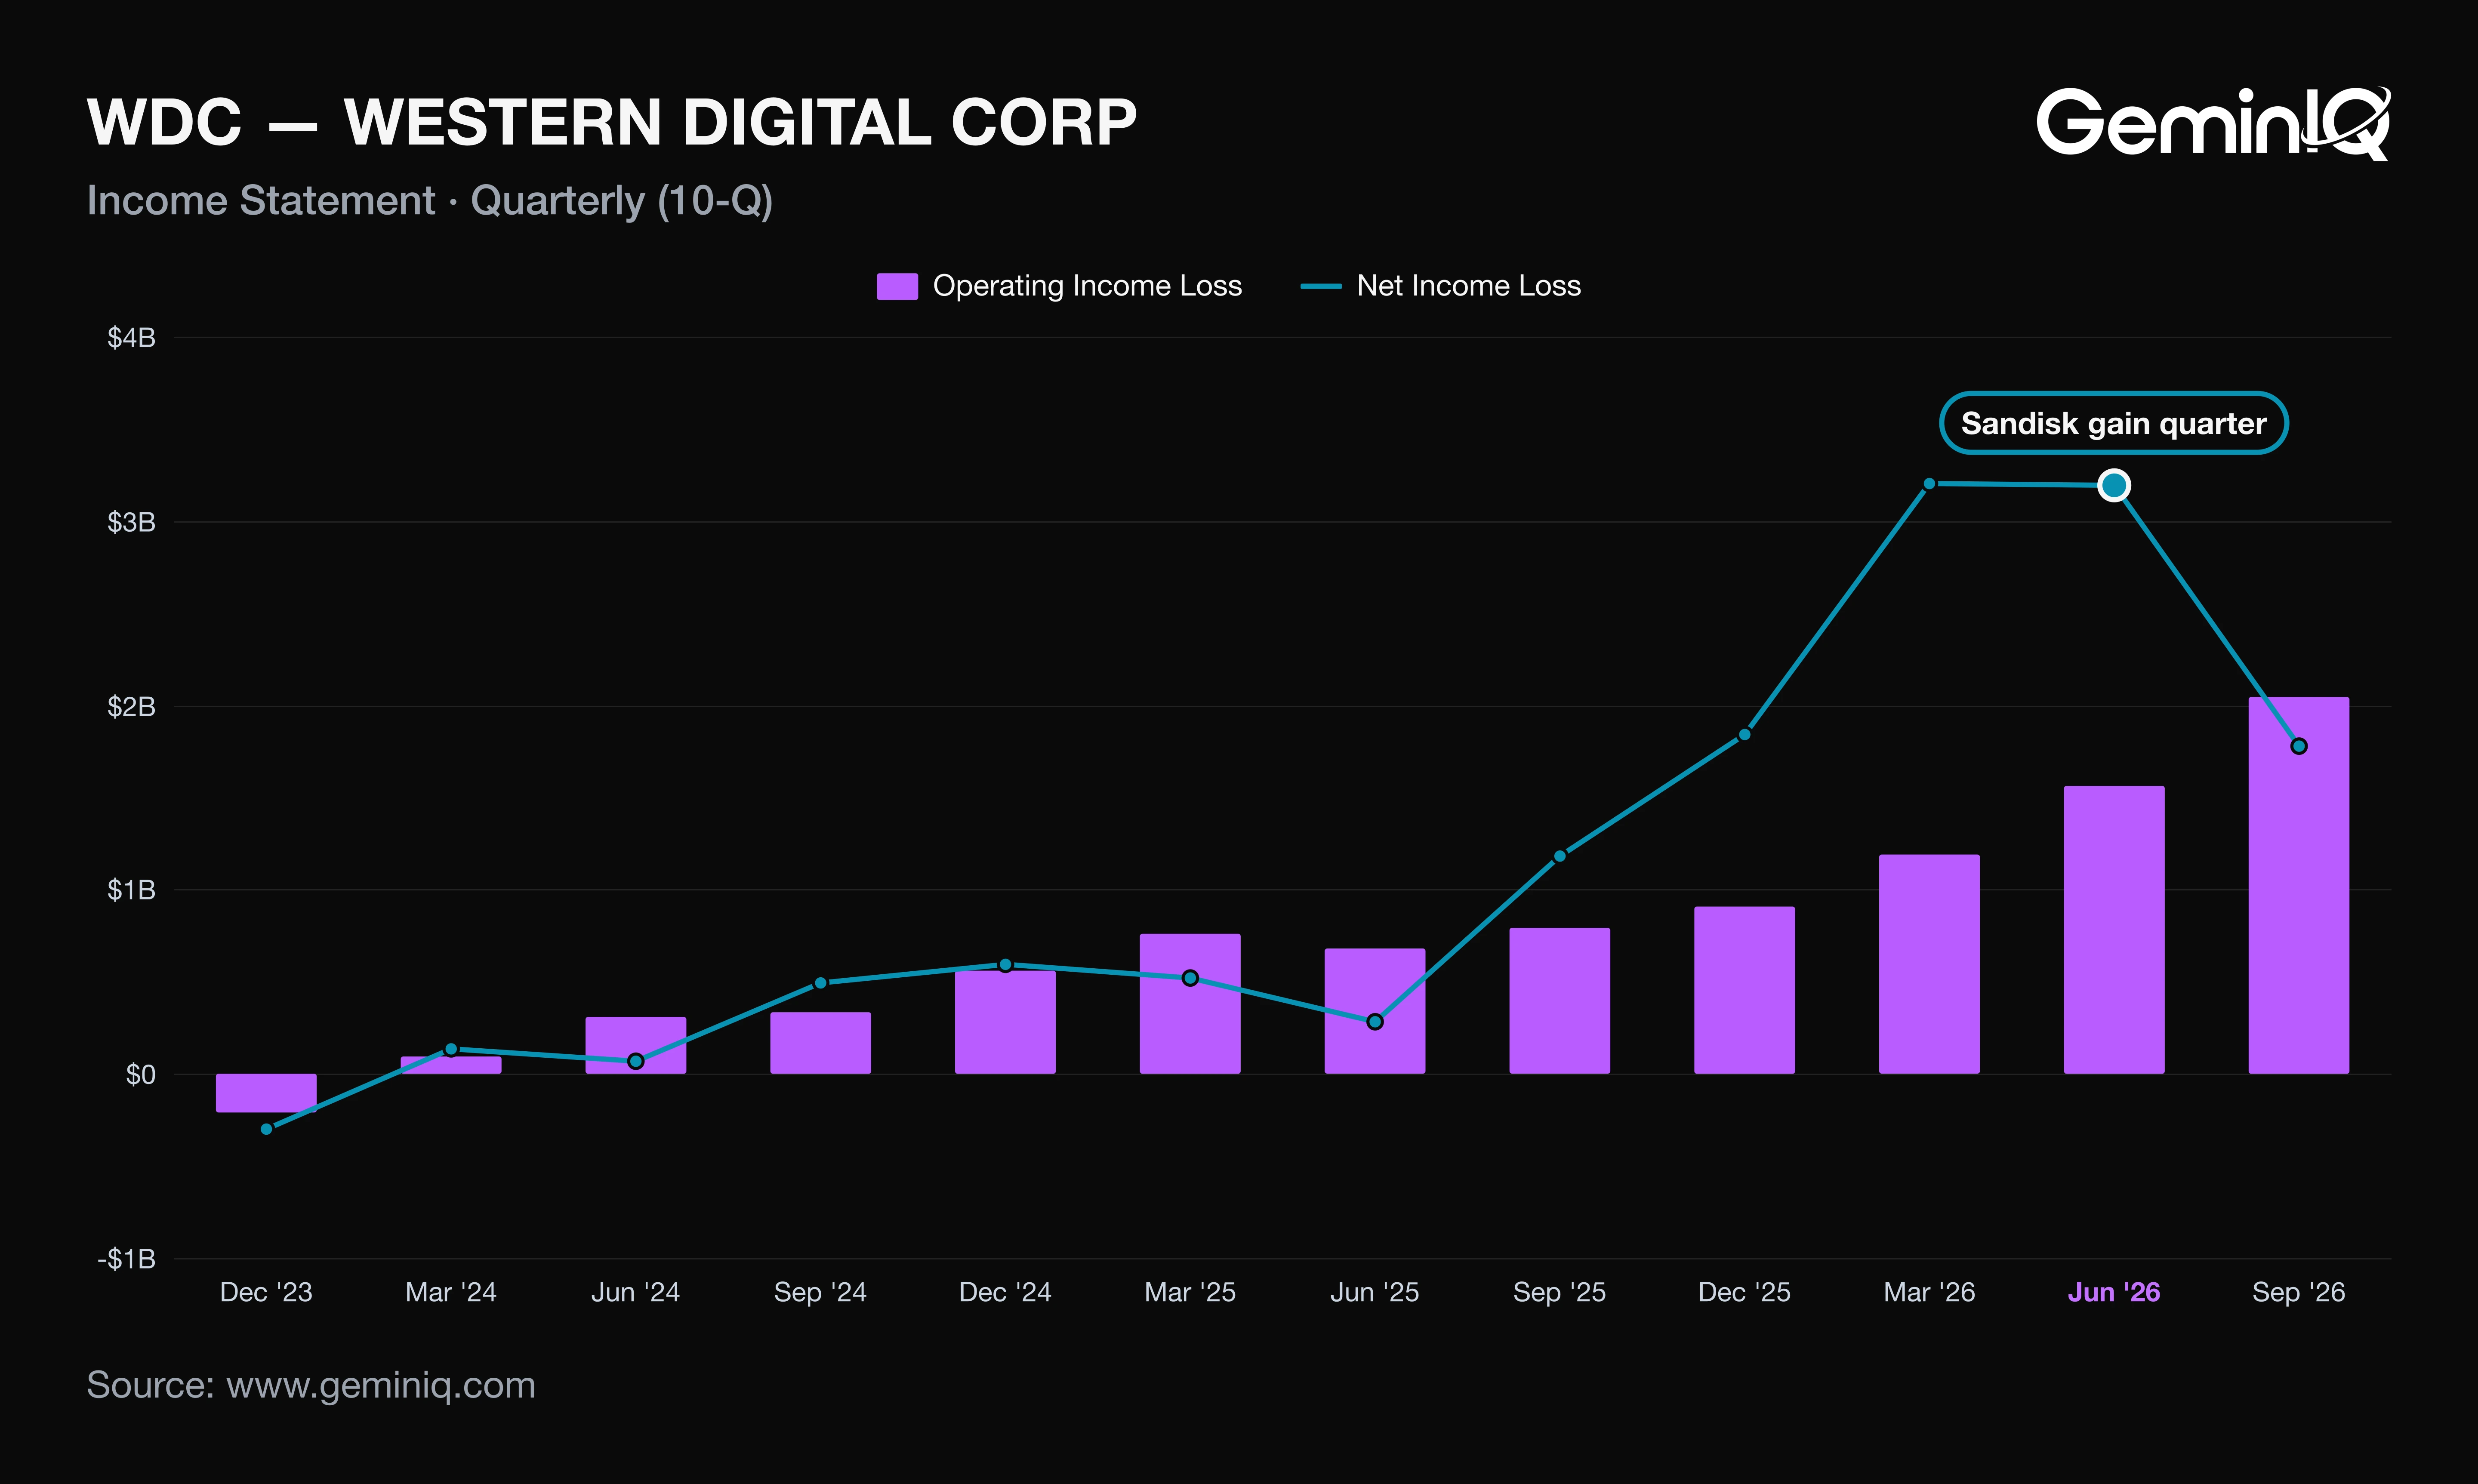
The Data: Gross margin reached 57.8%, up 14.3 points and the highest of the last 16 quarters. Operating margin reached 46.7%, up 18.6 points. Net income was the fourth-highest of the last 16 quarters, down 44.3% from $3.19 billion in Q4 FY2026, and diluted EPS was $4.63 against $3.07.
Why: Operating income added $1,254 million, but the year-ago quarter held a $611 million tax-free gain on the retained Sandisk interest that did not recur. Interest and other swung $553 million, and income tax rose $104 million to $259 million (a 13% effective rate). Without the gain, year-ago net income would have been about $571 million, and this quarter's $1.78 billion is roughly 3.1 times that. Q4 FY2026's $3.19 billion carried a $2.05 billion Sandisk gain, per the 8-K reconciliation. EPS grew 51% with no non-operating gain, against a year-ago quarter that had one.
What Western Digital's 10-Q Shows Beyond the Q1 FY2027 Press Release
Western Digital's 10-Q puts shares outstanding at 374 million, up 3.6% from 361 million on July 3, in a quarter with a $1.00 billion buyback. The release's CEO comment cites a 17% dividend increase as its evidence of capital return; the share count appears only in the filing.
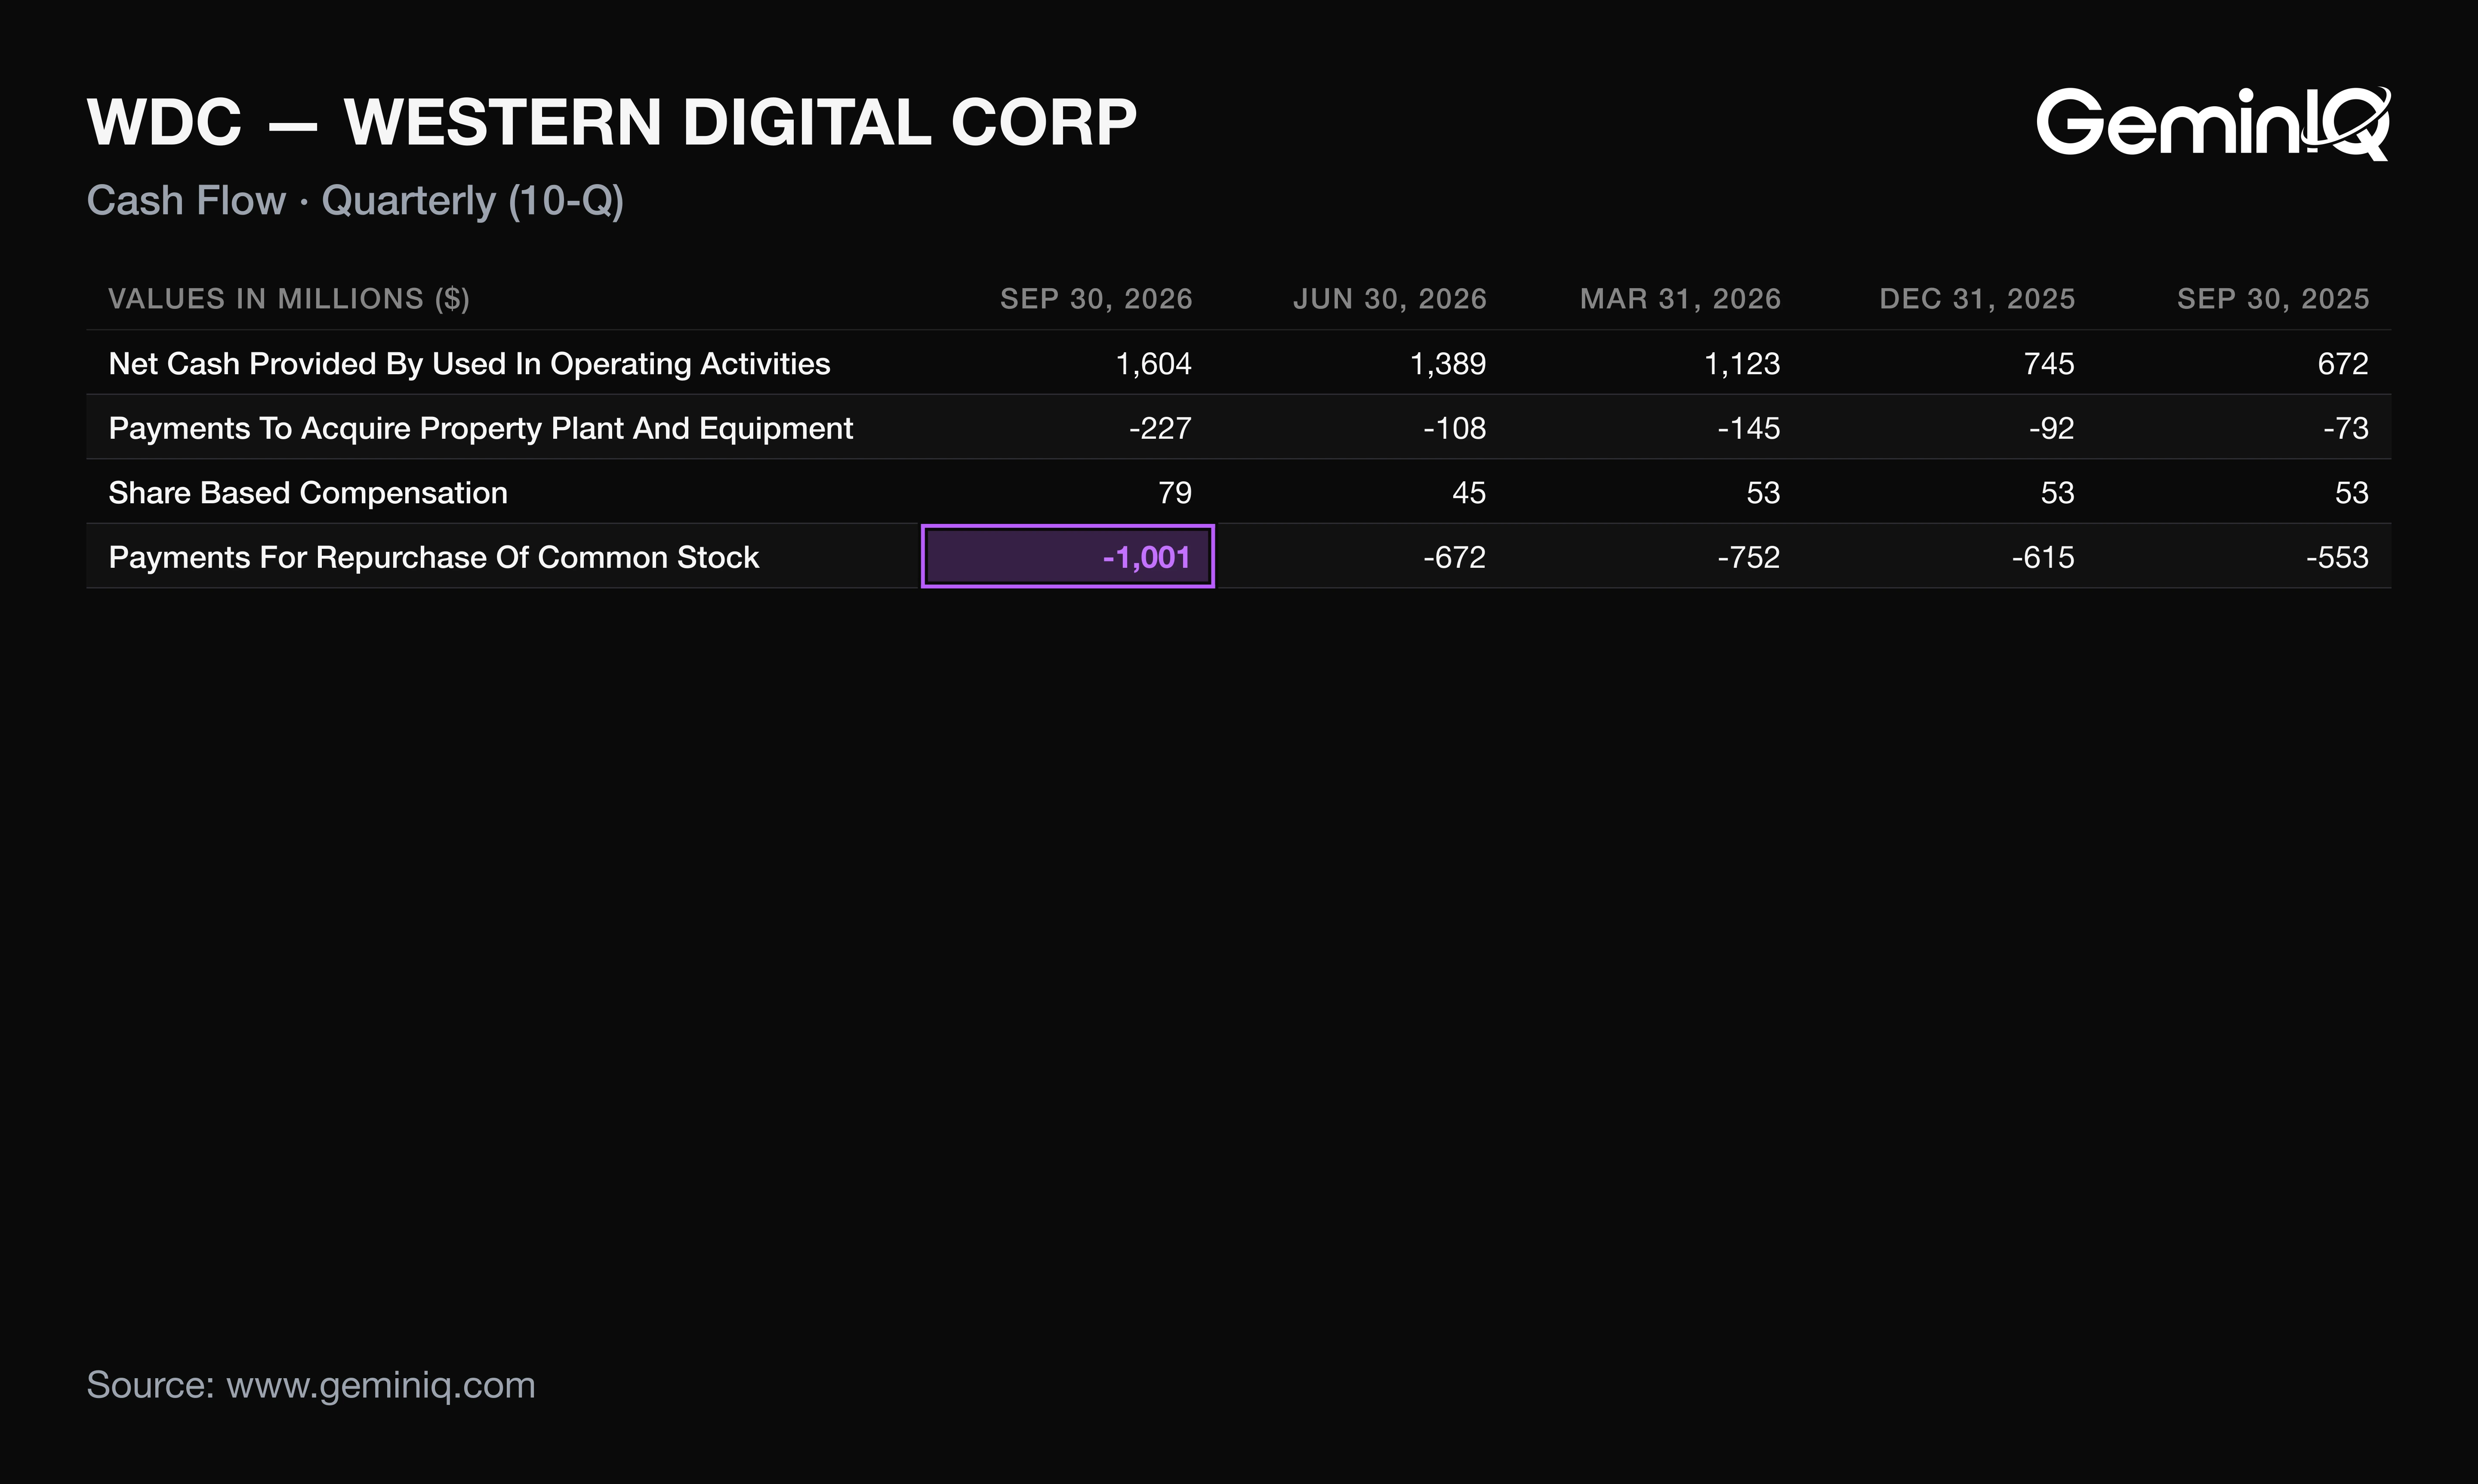
A reader who sees $1.00 billion of repurchases would expect a smaller share count. Instead the company issued about 14.0 million shares to settle the conversion premium on its convertible notes (4.7 million in negotiated exchanges, 9.3 million in tendered conversions) and 1.8 million more as stock units vested, against 2.0 million repurchased.
The Data: The $1.00 billion bought 2.0 million shares, roughly $500 each, and equaled 73% of free cash flow. Convertible principal took another $570 million in cash and taxes withheld on vested awards $317 million. Those three uses total $1.89 billion against $1.60 billion of operating cash flow; net revolver borrowing supplied $300 million and cash fell $265 million.
Why: The notes convert at about $37.70 a share, while the units that vested this quarter were worth about $456 each, so nearly all of the conversion value settled in stock. The capped calls stop offsetting dilution at about $50.38, and the 8-K's guidance assumes no material benefit from them. Another $141 million of principal remains; the company expects holders of substantially all of it to convert before the November 16 redemption date, and the $31 million already tendered settles in Q2 in shares.
Western Digital Q1 FY2027 Free Cash Flow, Working Capital and Debt
Western Digital's Q1 FY2027 free cash flow was $1.38 billion, up 129.9% from a year earlier and the highest of the last 16 quarters.
The Data: Operating cash flow was 90% of net income, against 57% a year earlier. Capital expenditure rose 110% from the prior quarter to $227 million, the second-highest of the last 16 quarters and 5.2% of revenue. Working capital absorbed $331 million: inventories $269 million and receivables $206 million, partly offset by $131 million of taxes payable. Inventories ended at $1,781 million, up 17.9% from July 3; receivables at $2,232 million, up 10.2%; revenue rose 16.9% sequentially.
Why: Receivables grew slower than revenue, so collections show no divergence, and inventory grew in step with sales; the 10-Q attributes the build to a production ramp for growing demand. All $789 million of debt is current, including a $650 million revolver, up from $350 million, that matures in January 2027 with $600 million undrawn. The company says cash and operating cash flow will cover repayment, and repaying the revolver would absorb about 47% of a quarter's free cash flow at Q1's pace.
Western Digital's Q2 FY2027 Guidance After Q1
In the 8-K, Western Digital guided Q2 FY2027 revenue of $5.1 billion, plus or minus $100 million, up 66% to 72% year over year. The guide implies sequential growth of 16.4%, against the 9.4% implied by last quarter's guide.
The Data: For Q1 the company guided revenue of $4.1 billion plus or minus $100 million, non-GAAP gross margin of 55% to 56% and non-GAAP EPS of $4.00 plus or minus $0.15. It reported $4.38 billion, 58.1% and $4.64, above the top of each range. For Q2 it guided gross margin of 60% to 61%, operating expenses of $400 million to $410 million, a tax rate near 17%, about 380 million diluted shares and EPS of $5.80 plus or minus $0.20.
Why: The midpoints imply non-GAAP operating income near $2.68 billion, a 52.6% margin against 49.1% in Q1. EPS at the midpoint is 25% above Q1's $4.64 on revenue 16% higher, so margin carries the extra growth. The company guides on a non-GAAP basis only, quantifying about $95 million of known adjustments, so Q2 GAAP EPS depends on items the 8-K leaves open.
How WDC Stock Has Moved After Past Earnings Reports
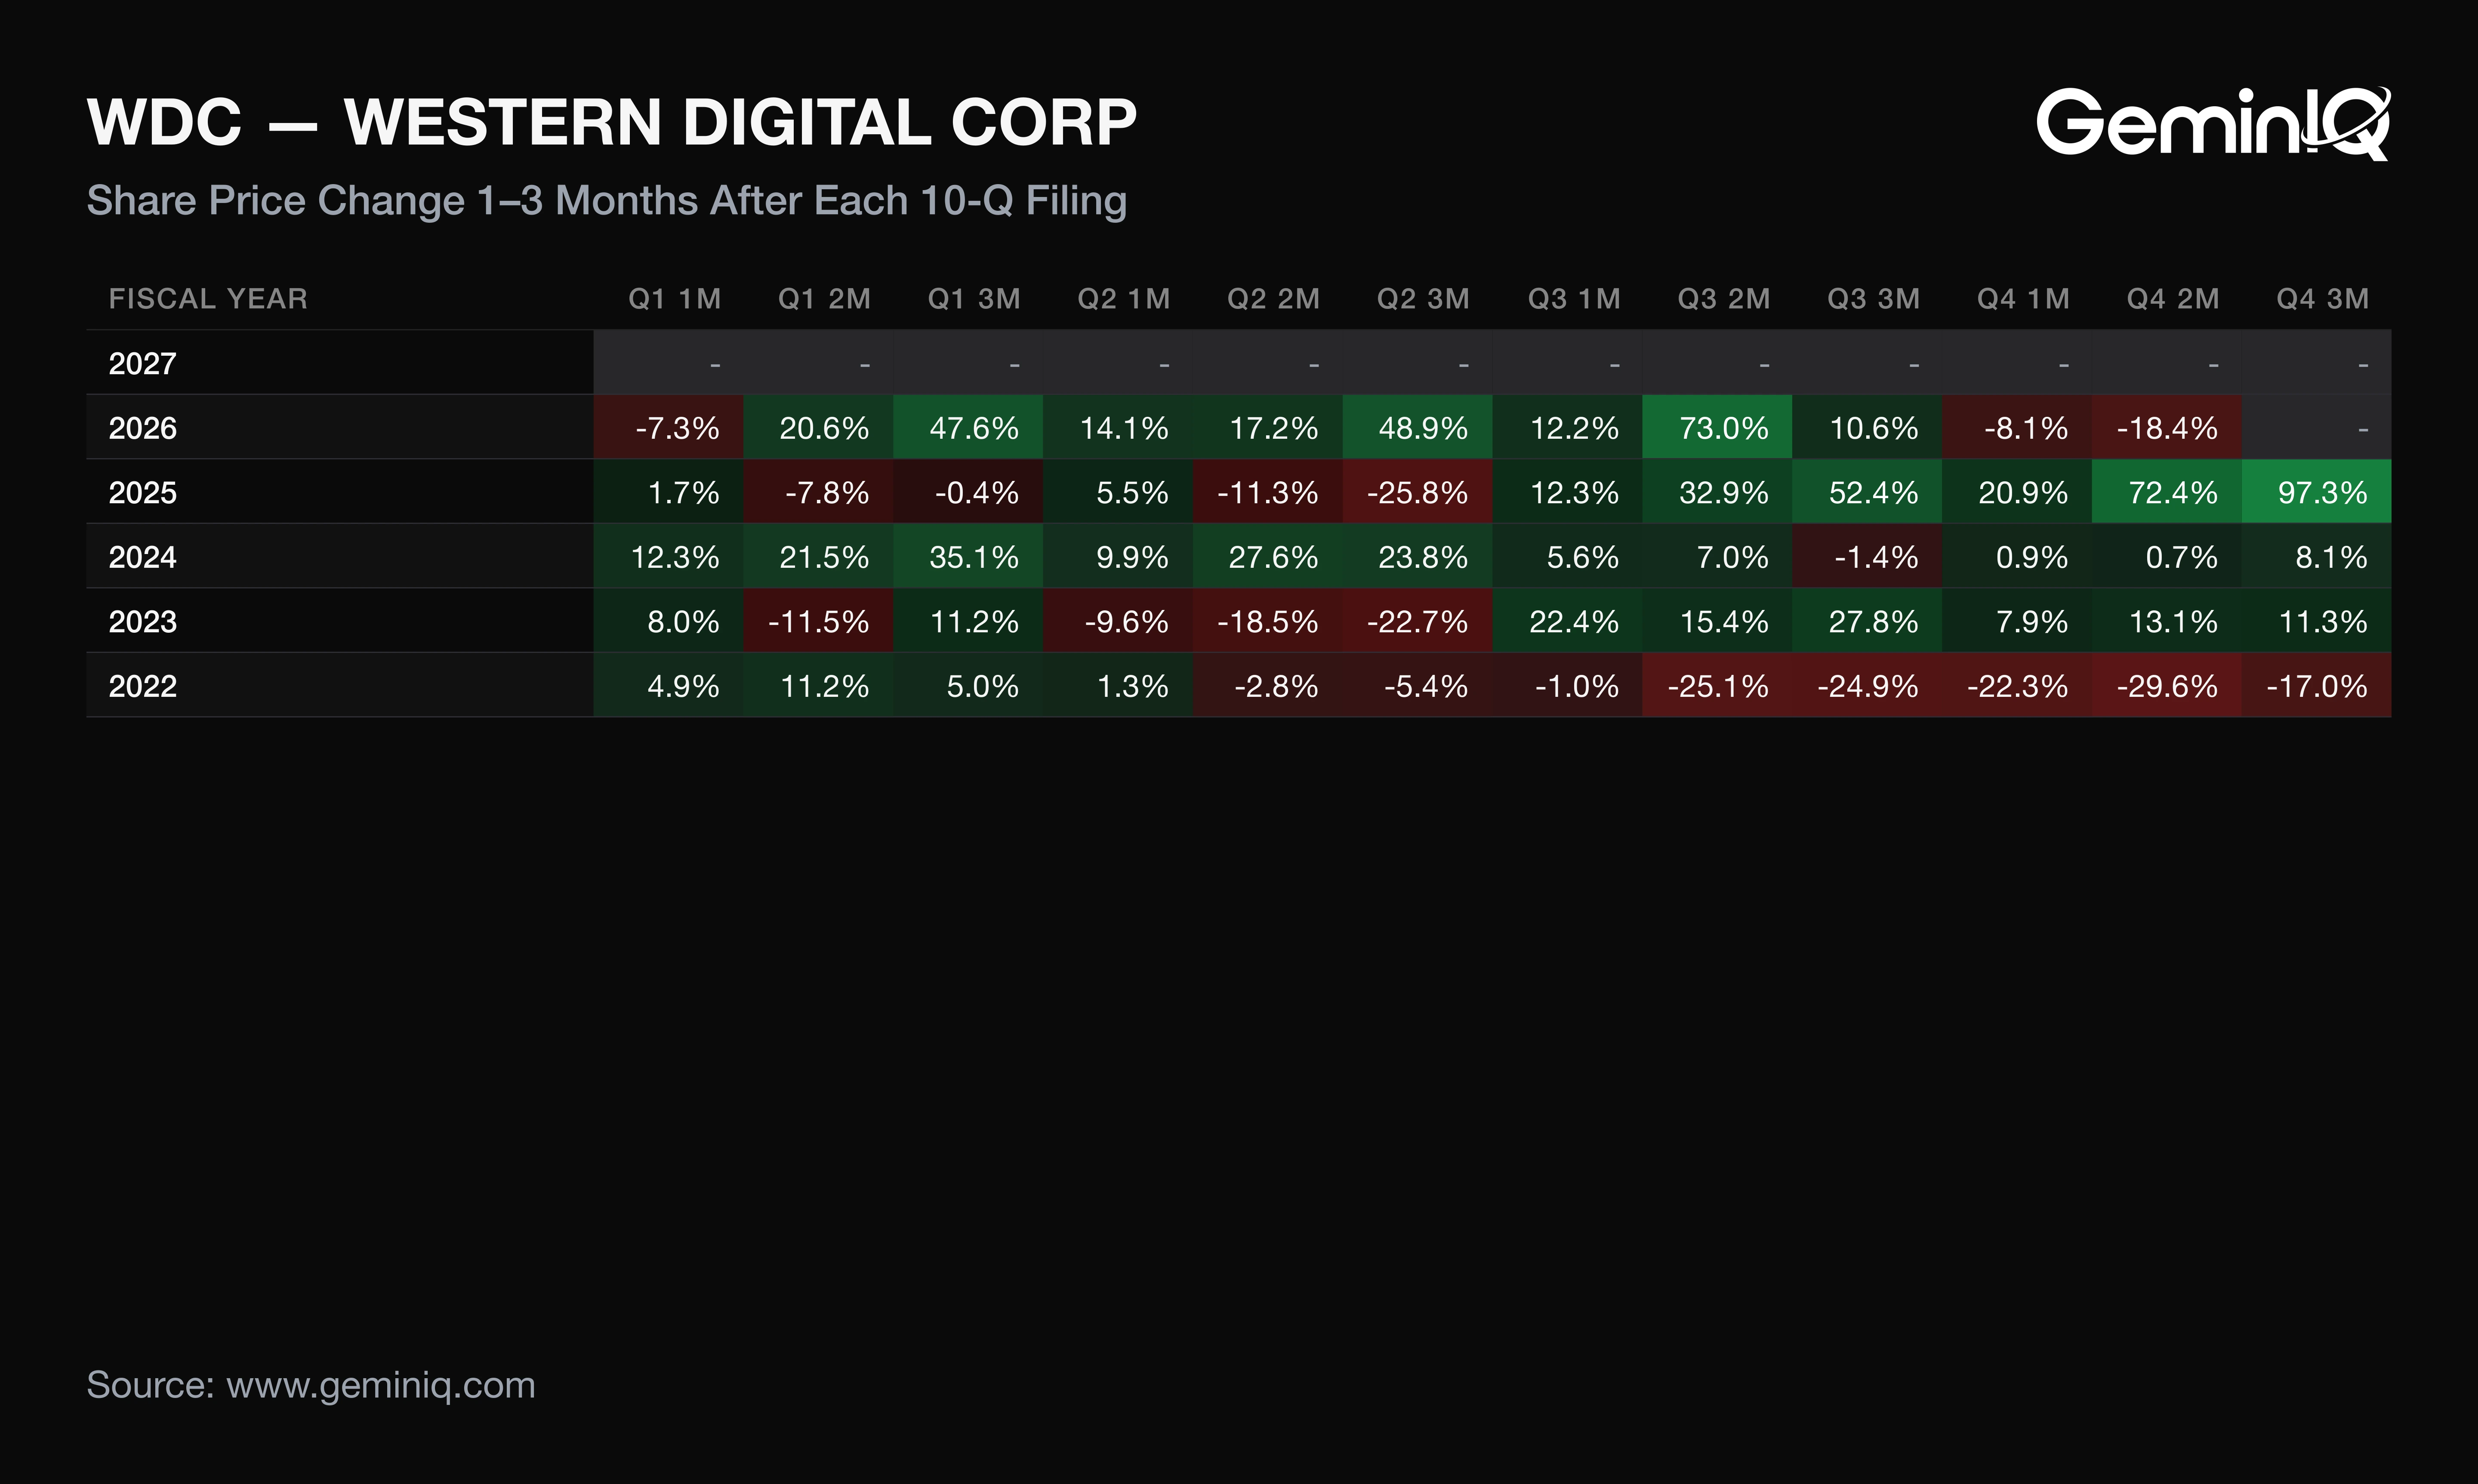
Over its last 12 10-Q filings, from November 2023 to August 2026, WDC's one-month post-filing return had a median of +7.8% and was positive after 10. The three-month median was +23.8%, positive after 8 of 11 completed windows. These figures describe how Western Digital's stock moved after its past filings; they are a historical association, not a forecast.
The Data: One-month returns ranged from -8.1% (filed August 14, 2026) to +20.9% (filed August 14, 2025); three-month returns ranged from -25.8% to +97.3%. After the last three Q1 filings the one-month returns were +12.3%, +1.7% and -7.3%. This filing's window has not elapsed. GeminIQ's Earnings Reaction Heat Map shows each window.
Why: The medians differ by 16 points, so in this record most of the typical gain accrued in months two and three, not in the first month after the filing.
Institutions held 87.9% of shares at the June 30, 2026 SEC Form 13F quarter end (317.32 million of 361.00 million), the seventh-highest of the last 16 quarters. In the 12 months of Form 4 filings through September 4, 2026, insiders reported 43 sales totaling $71.5 million and no purchases, against 21 sales totaling $17.7 million a year earlier; CEO Irving Tan accounted for $25.2 million, or 35%. That data ends before the earnings release. Any buyback deserves a check of the share count against the issuance line before it counts as shrinkage.
Frequently Asked Questions
When does Western Digital report earnings?
Western Digital reported Q1 FY2027 results on October 22, 2026 and filed its 10-Q on October 23. Last year it filed its fiscal Q2 results on January 30, 2026, a pattern from the filing record and not a forecast of the next date.
Does Western Digital pay a dividend?
Yes. Western Digital paid $56 million of common dividends in Q1 FY2027, or $0.15 per share, and $196 million over the trailing twelve months, against $78 million a year earlier. The board declared $0.175 per share on October 21, payable December 17, 2026 to holders of record on December 4.
Is Western Digital doing well financially?
Western Digital's trailing operating margin is 39.41%, operating cash flow is $4.86 billion, its current ratio is 1.43x, and GeminIQ's pre-calculated Return on Invested Capital (ROIC) is 60.46%, up from 21.33%. Trailing net margin of 69.20% is inflated by Sandisk gains recorded in earlier quarters, so operating margin is the cleaner measure.
Where can I verify Western Digital's Q1 FY2027 figures?
The figures come from the 10-Q filed October 23, 2026 and the 8-K earnings release filed October 22, 2026. Guidance and non-GAAP figures appear only in the 8-K.
Wall Street's data. Main Street's price.
Institutional terminals charge thousands a year for as-filed accuracy. GeminIQ gives you the same thing for a fraction of the cost: financials built directly from raw SEC EDGAR filings, not third-party APIs, with full XBRL traceability back to the original 10-K or 10-Q. No normalized guesswork, just calculated metrics, charts, screeners, and watchlists built on numbers exactly as the company reported them. Start researching now at GeminIQ.com.
All financial figures cited in this article reference WESTERN DIGITAL CORPORATION's Q1 FY2027 10-Q (filed October 23, 2026, period ending September 30, 2026), with guidance and management commentary drawn from the company's Form 8-K earnings release (filed October 22, 2026). All SEC filings are publicly available at SEC EDGAR and SEC EDGAR.
Disclaimer: The content in this blog is for educational and entertainment purposes only and does not constitute financial, legal, or tax advice. Investing involves risk, including the loss of principal. The views expressed are my own and not intended as financial advice or a guarantee of future performance.