
Alphabet Q2 2026 10-Q: The $99 Billion Line Item

By Chad Hartman
Published · Last updated
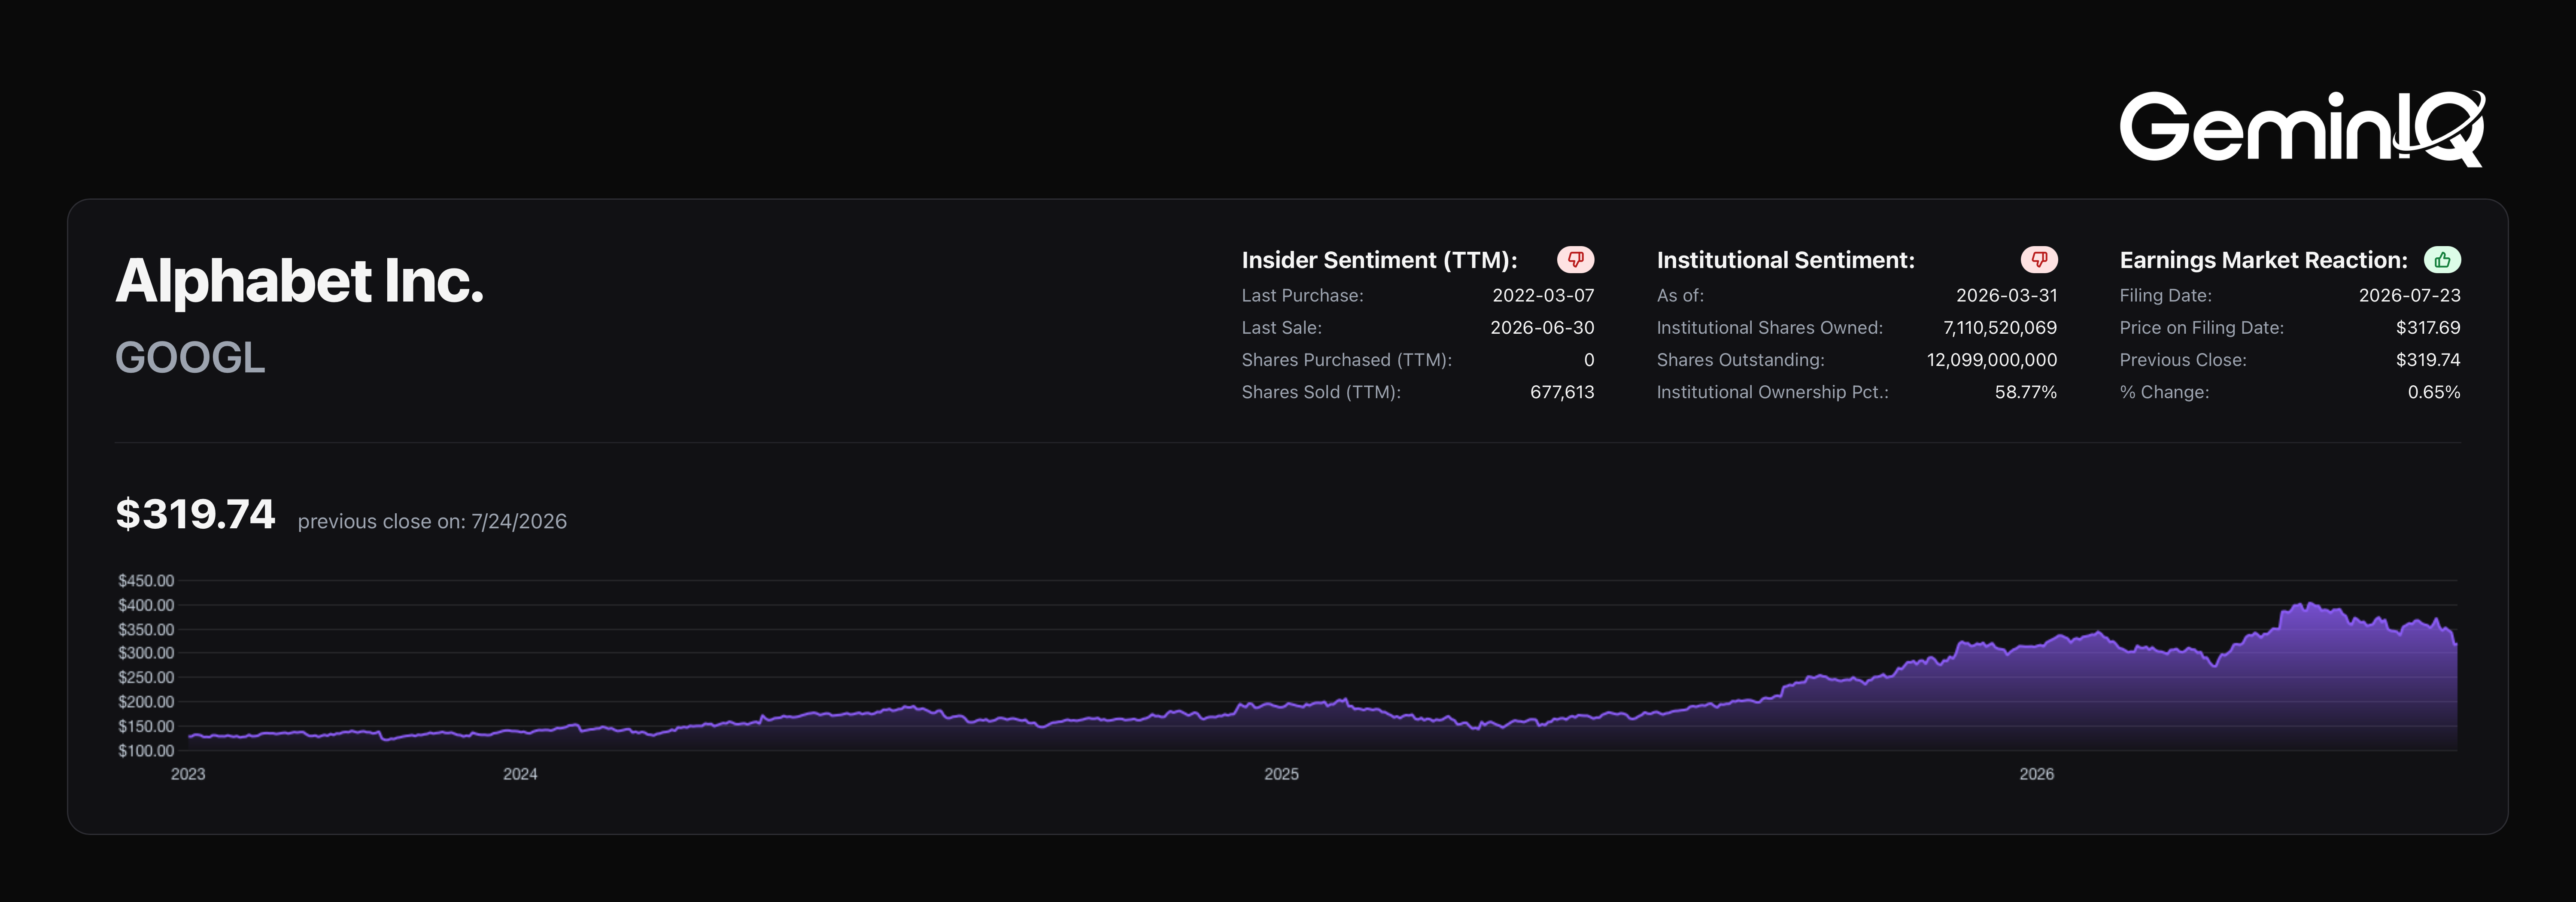
Alphabet ($GOOGL) just filed its Q2 FY2026 10-Q (filed July 23, 2026). The headline numbers look almost unbelievable: Net Income of $112.193 Billion for the quarter and Diluted EPS of $9.11, against $62.578 Billion and $5.11 just one quarter earlier. Trailing-twelve-month revenue grew 20.1%. Trailing-twelve-month net income grew 111.3%. Those two growth rates should never diverge this violently on the same income statement, and the raw filing shows exactly why: $98.999 Billion of this quarter's pretax income came from a single tagged line item, a non-cash mark-to-market gain on debt and equity securities, not from selling more ads or renting more cloud compute.
| Field | Value |
|---|---|
| Ticker | $GOOGL |
| Filing | Q2 FY2026 10-Q |
| Filed | July 23, 2026 |
| Period End | June 30, 2026 |
| Net Income (Q2 FY2026) | $112.193 Billion |
| Operating Income (Q2 FY2026) | $40.77 Billion |
The $99 Billion Line Item
Every quarter's cash flow statement carries a reconciliation section that backs non-cash items out of net income to arrive at actual cash generated. Most quarters, that section is a rounding exercise. This quarter, one line in it swamped everything else the company reported.
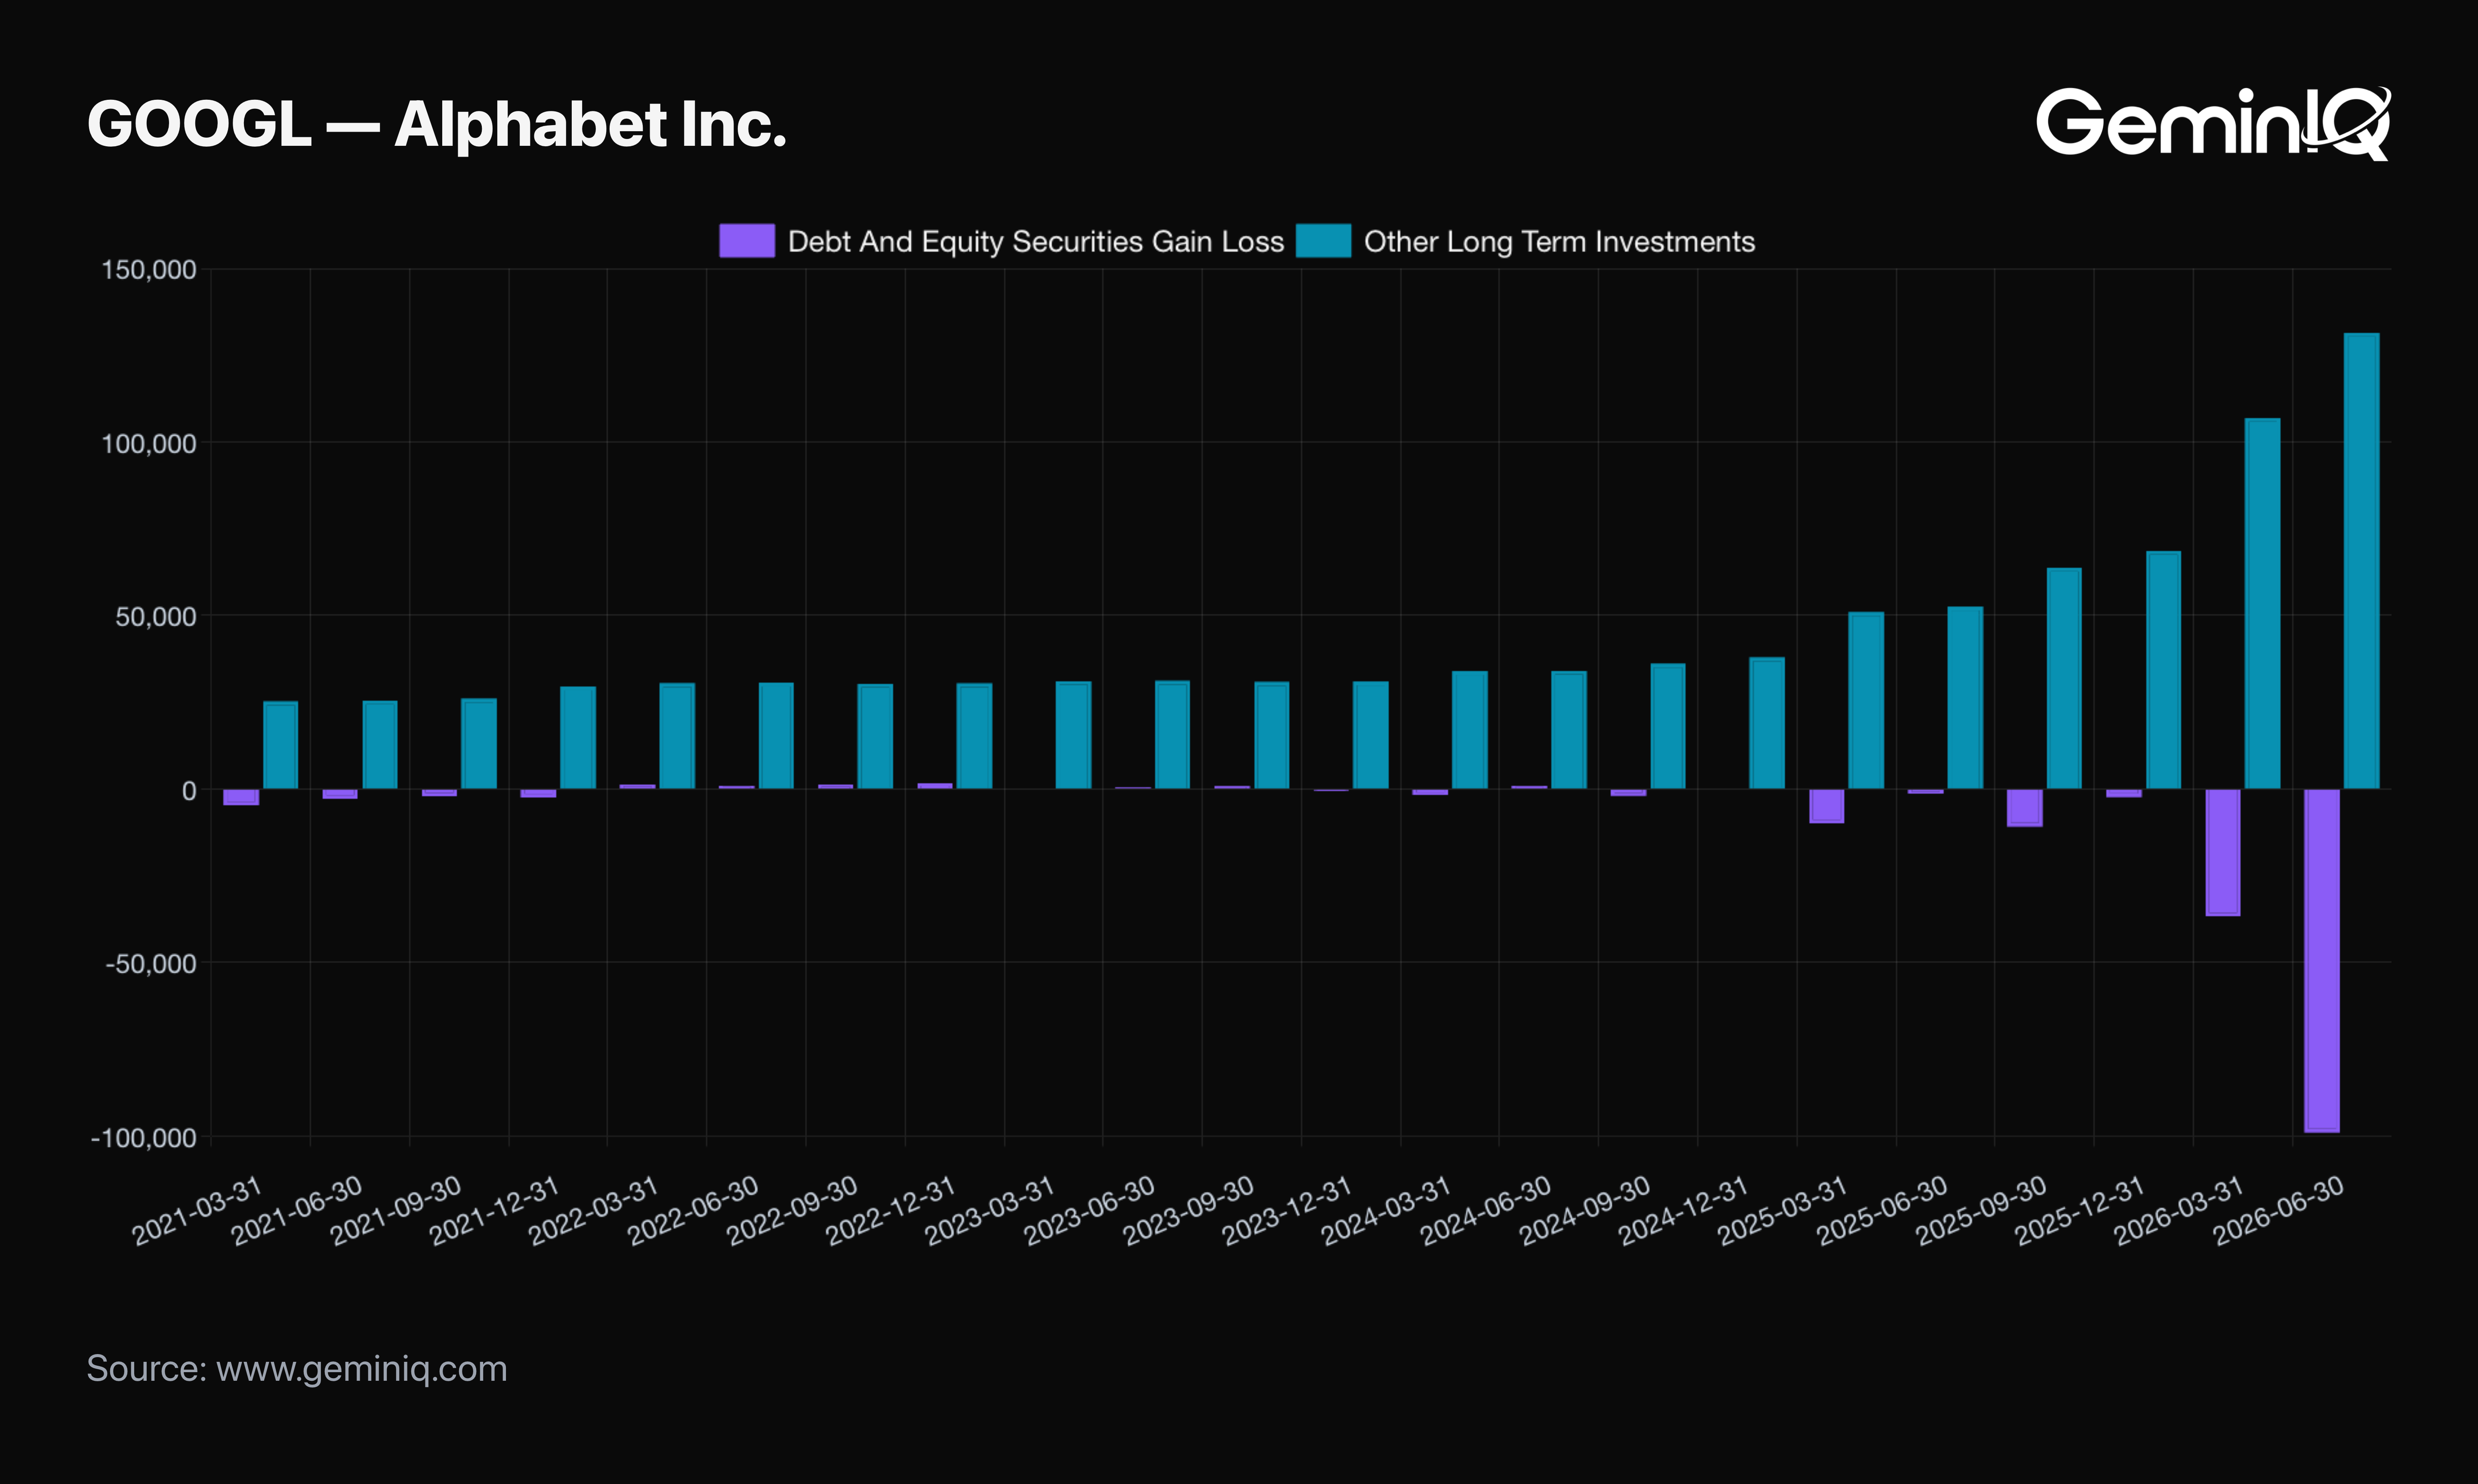
The Data: The raw filing tags this line item Debt And Equity Securities Gain Loss. It carried a value of $98.999 Billion this quarter — a gain, since the tag records losses as positive and gains as negative. That figure didn't appear from nowhere: the same line was $36.804 Billion in Q1 FY2026 and just $1.451 Billion in the same quarter a year ago. On the balance sheet, the line GeminIQ tags Other Long Term Investments — the category holding Alphabet's non-marketable and private-company equity stakes — grew from $106.946 Billion to $131.461 Billion in a single quarter, and from just $36.177 Billion in September 2024. That portfolio has more than tripled in under two years, and the mark-to-market swings in its value now move Alphabet's reported earnings more than the operating business does.
The GeminIQ Edge: Standard financial media strips this kind of item out to publish an "adjusted EPS" figure, but rarely shows you the line doing the stripping. Pulling Financial Statements directly from the as-filed 10-Q shows the exact tagged value causing the divergence, sourced to the same XBRL tag every quarter, so the reader can verify the number instead of trusting someone else's adjustment.
What the Core Business Actually Earned
None of this means the underlying advertising and cloud business is inventing numbers. It means the two lines on the income statement that matter for valuing a business — operating income and net income — just told two completely different stories in the same quarter.
The Data: Alphabet's Operating Income was $40.77 Billion, up 2.7% from $39.696 Billion the prior quarter and up 30.4% from $31.271 Billion a year earlier — real, healthy growth, just nothing like the net income headline. Income Before Income Taxes was $138.753 Billion. Subtract the $98.999 Billion Debt And Equity Securities Gain Loss from that figure directly — a calculation GeminIQ derives from the two filed lines rather than displaying as a platform metric. Pretax income falls to $39.754 Billion, within a rounding error of the $40.77 Billion of operating income alone. Virtually the entire gap between operating income and the reported pretax figure this quarter came from one non-operating item.
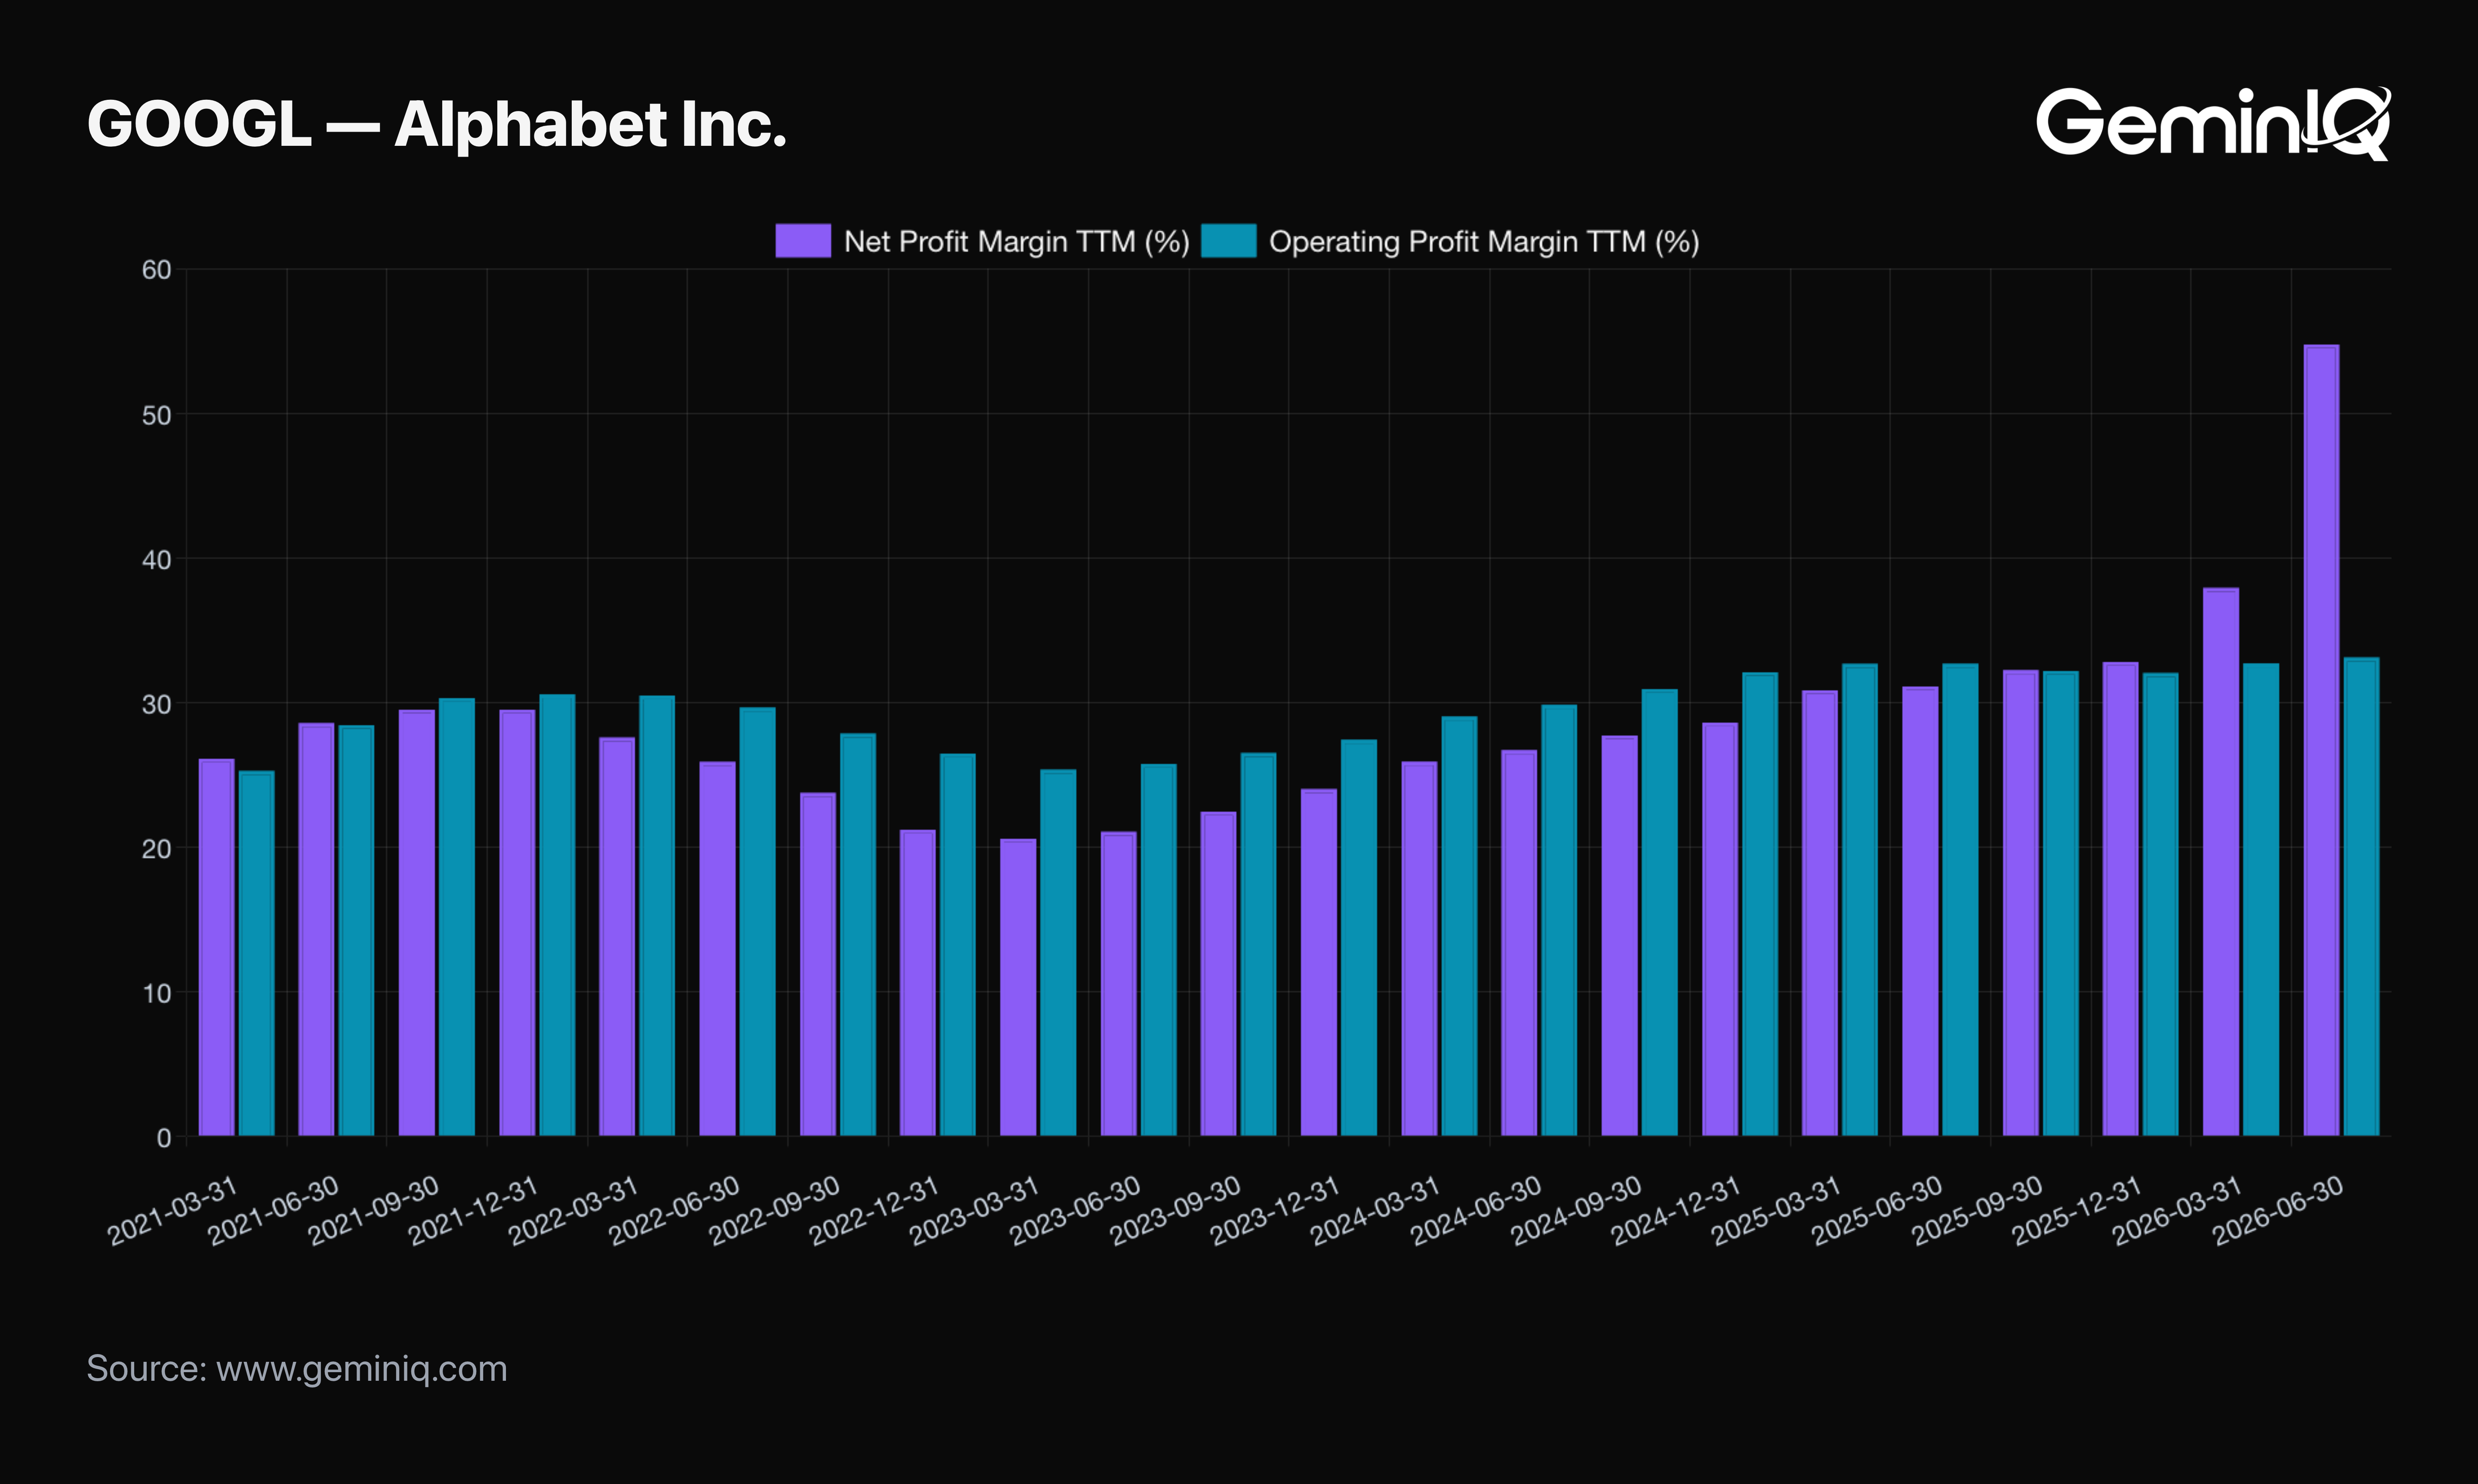
The margin data confirms it. GeminIQ's pre-calculated Net Profit Margin (TTM) jumped to 54.8% from 37.9% the prior quarter, a swing of nearly 17 percentage points in a single quarter. Over the same stretch, Operating Profit Margin (TTM) moved from 32.7% to 33.1% — a 0.4 percentage point shift. One margin exploded. The other barely moved.
The GeminIQ Edge: A screener that only surfaces net margin would show Alphabet's profitability doubling in a quarter. Pulling Calculated Metrics for both margins side by side shows the operating business is compounding steadily, not doubling — the explosion lives entirely in the non-operating line above.
Free Cash Flow Just Turned Negative
Net income is an accounting figure. Cash is not, and the cash story this quarter runs in the opposite direction of the headline.
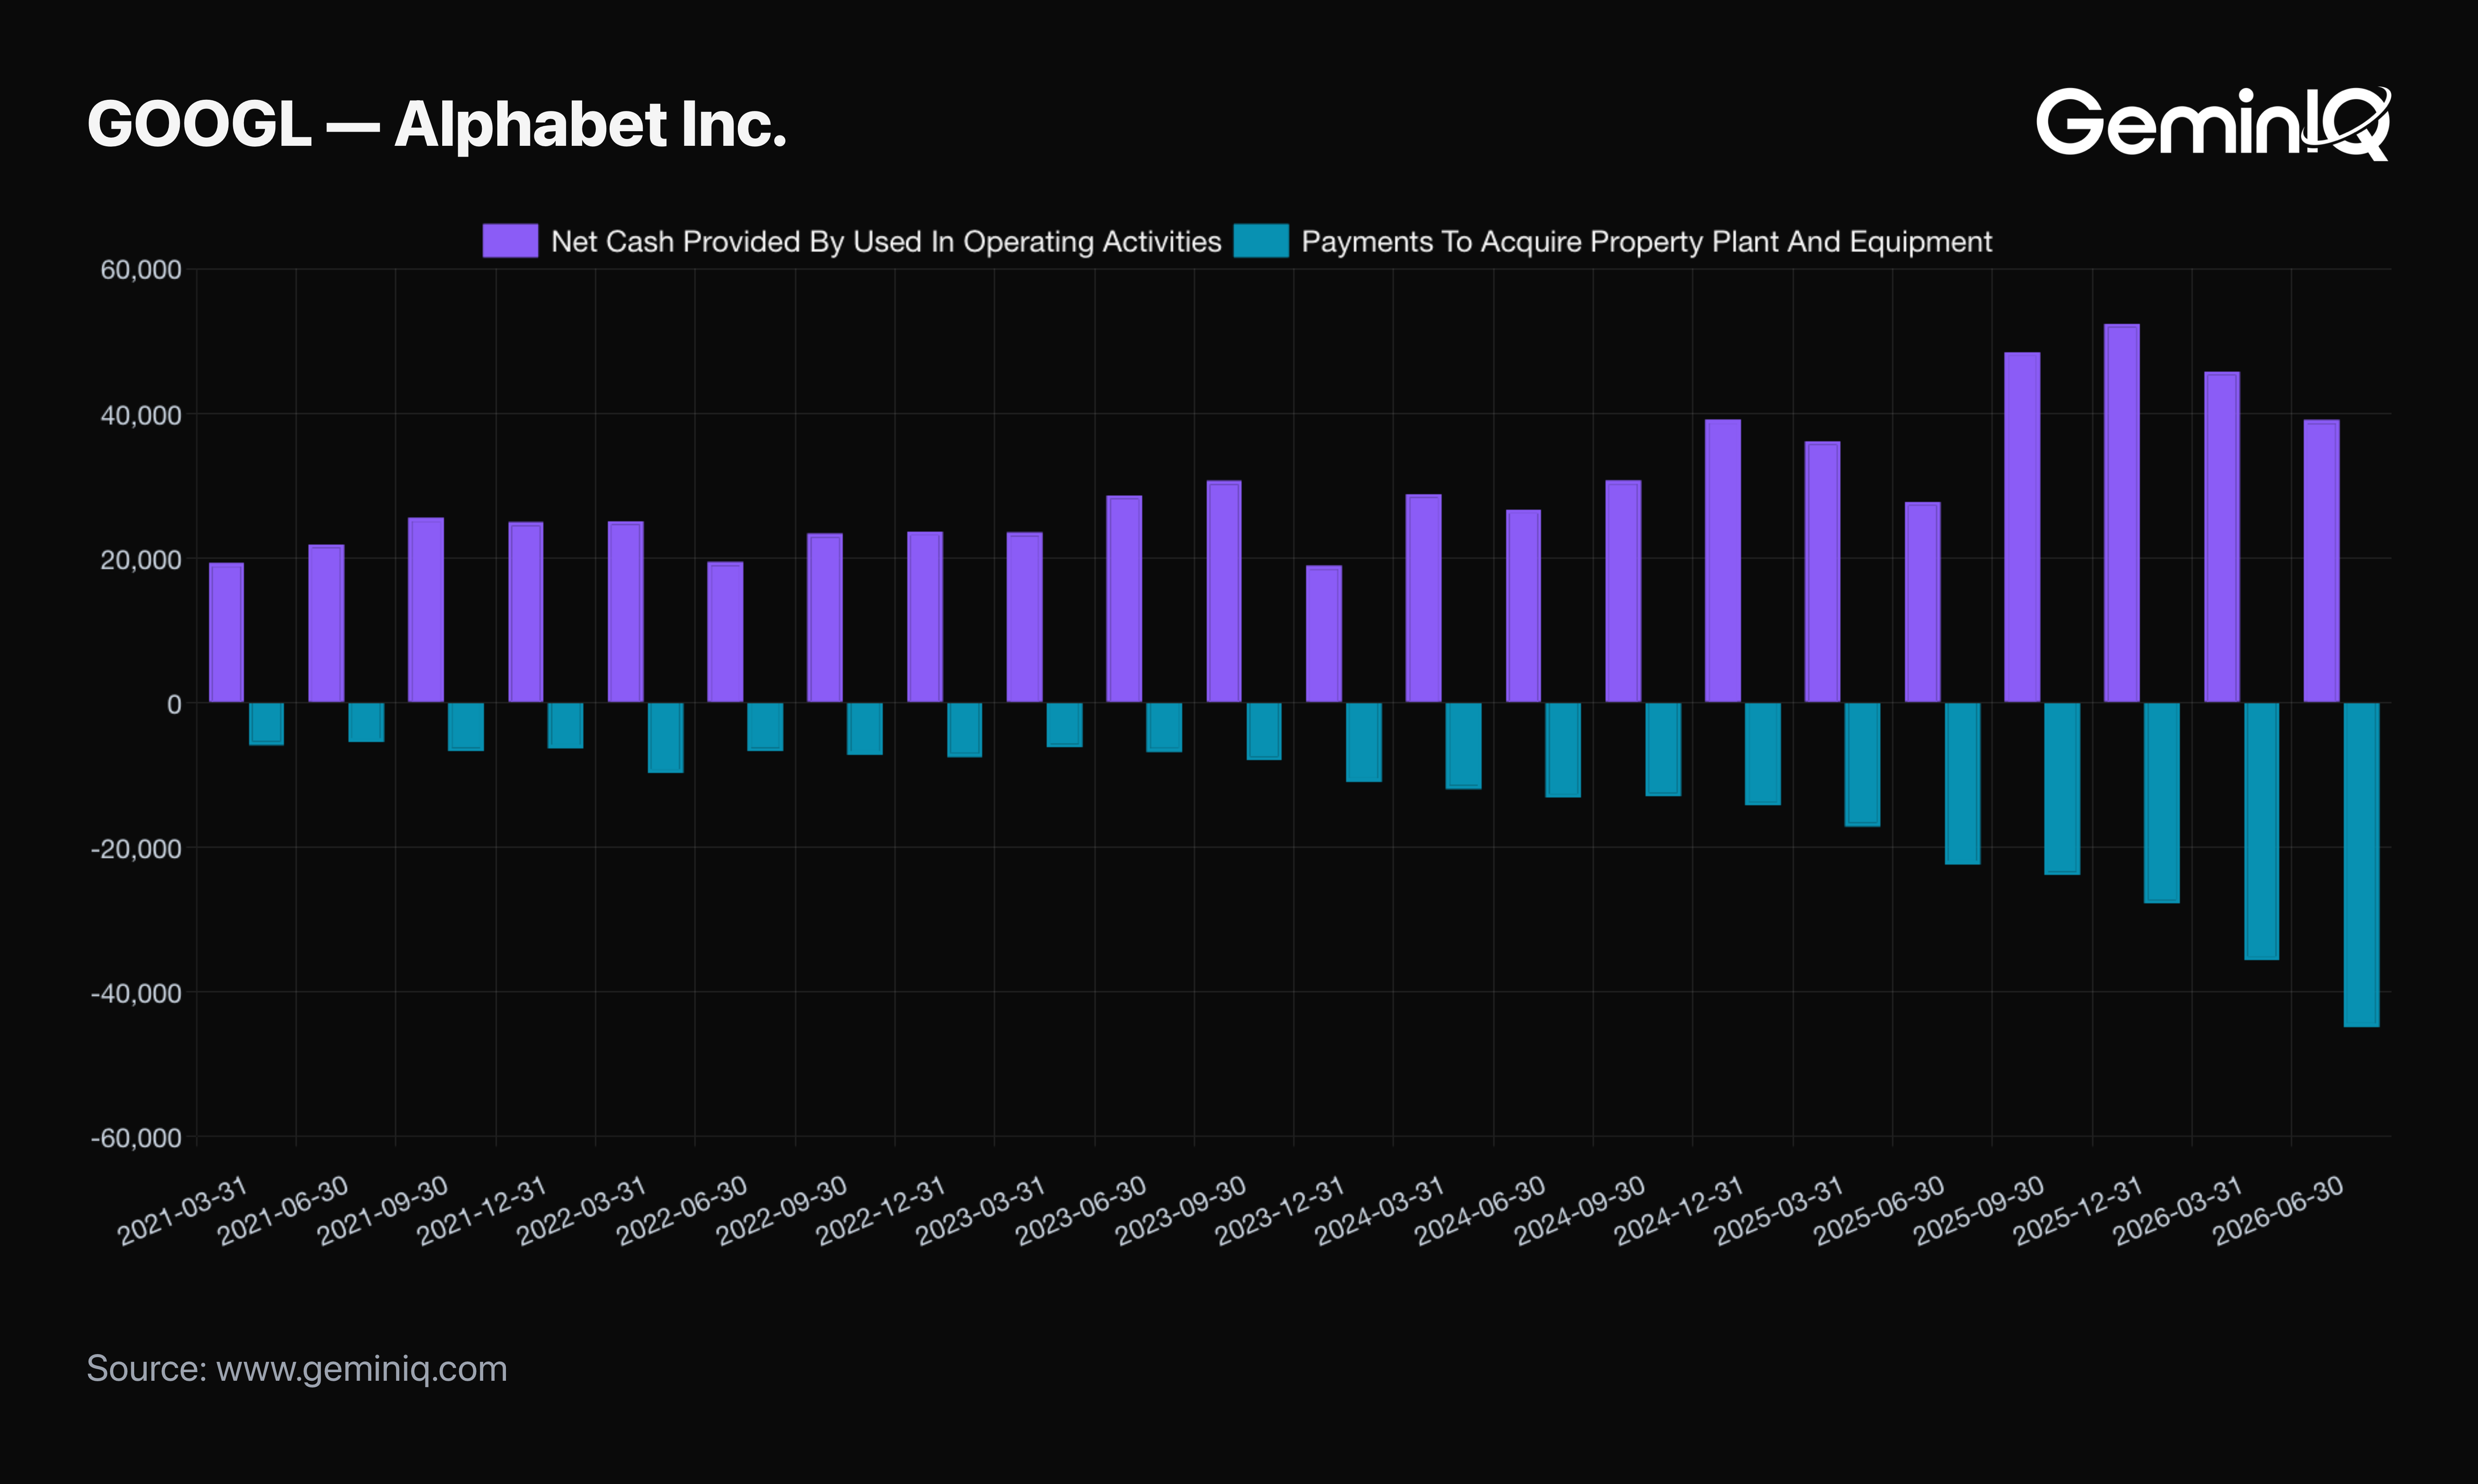
The Data: Net Cash Provided By Operating Activities for the quarter was $39.069 Billion. Payments To Acquire Property Plant And Equipment was $44.924 Billion. Subtracting the two — a calculation GeminIQ derives from the filed cash flow lines rather than a displayed metric — puts quarterly free cash flow at negative $5.855 Billion. That's the first negative quarter visible in this filing history, against a positive $10.116 Billion the prior quarter. GeminIQ's pre-calculated Free Cash Flow (TTM) is still positive at $53.273 Billion, but it's down from $64.429 Billion a quarter earlier as the trailing figure absorbs this one negative quarter. Alphabet's Long Term Debt Noncurrent grew to $98.165 Billion from $77.501 Billion, a 26.7% jump, and the balance sheet's Common Stocks Including Additional Paid In Capital line grew from $96.902 Billion to $131.371 Billion, an increase of $34.469 Billion in a single quarter — consistent with fresh capital being raised alongside the debt.
The GeminIQ Edge: Pulling Financial Statements cash flow data quarter by quarter shows the capex ramp has now outrun operating cash generation entirely, something the still-positive TTM Free Cash Flow figure alone would mask for another two quarters.
Why GeminIQ's ROIC Fell While Net Income Tripled
The debt and equity growth above didn't stop at the balance sheet — it flows straight into the one metric investors actually use to judge capital efficiency, and it explains a number a headline P/E ratio hides entirely. Alphabet's trailing Price-to-Earnings Ratio (P/E) actually fell this quarter, from 21.70 to 17.78, purely because trailing net income grew faster than the stock price did. A falling P/E usually reads as a stock getting cheaper. Here it's an artifact of the same non-cash gain inflating the denominator.
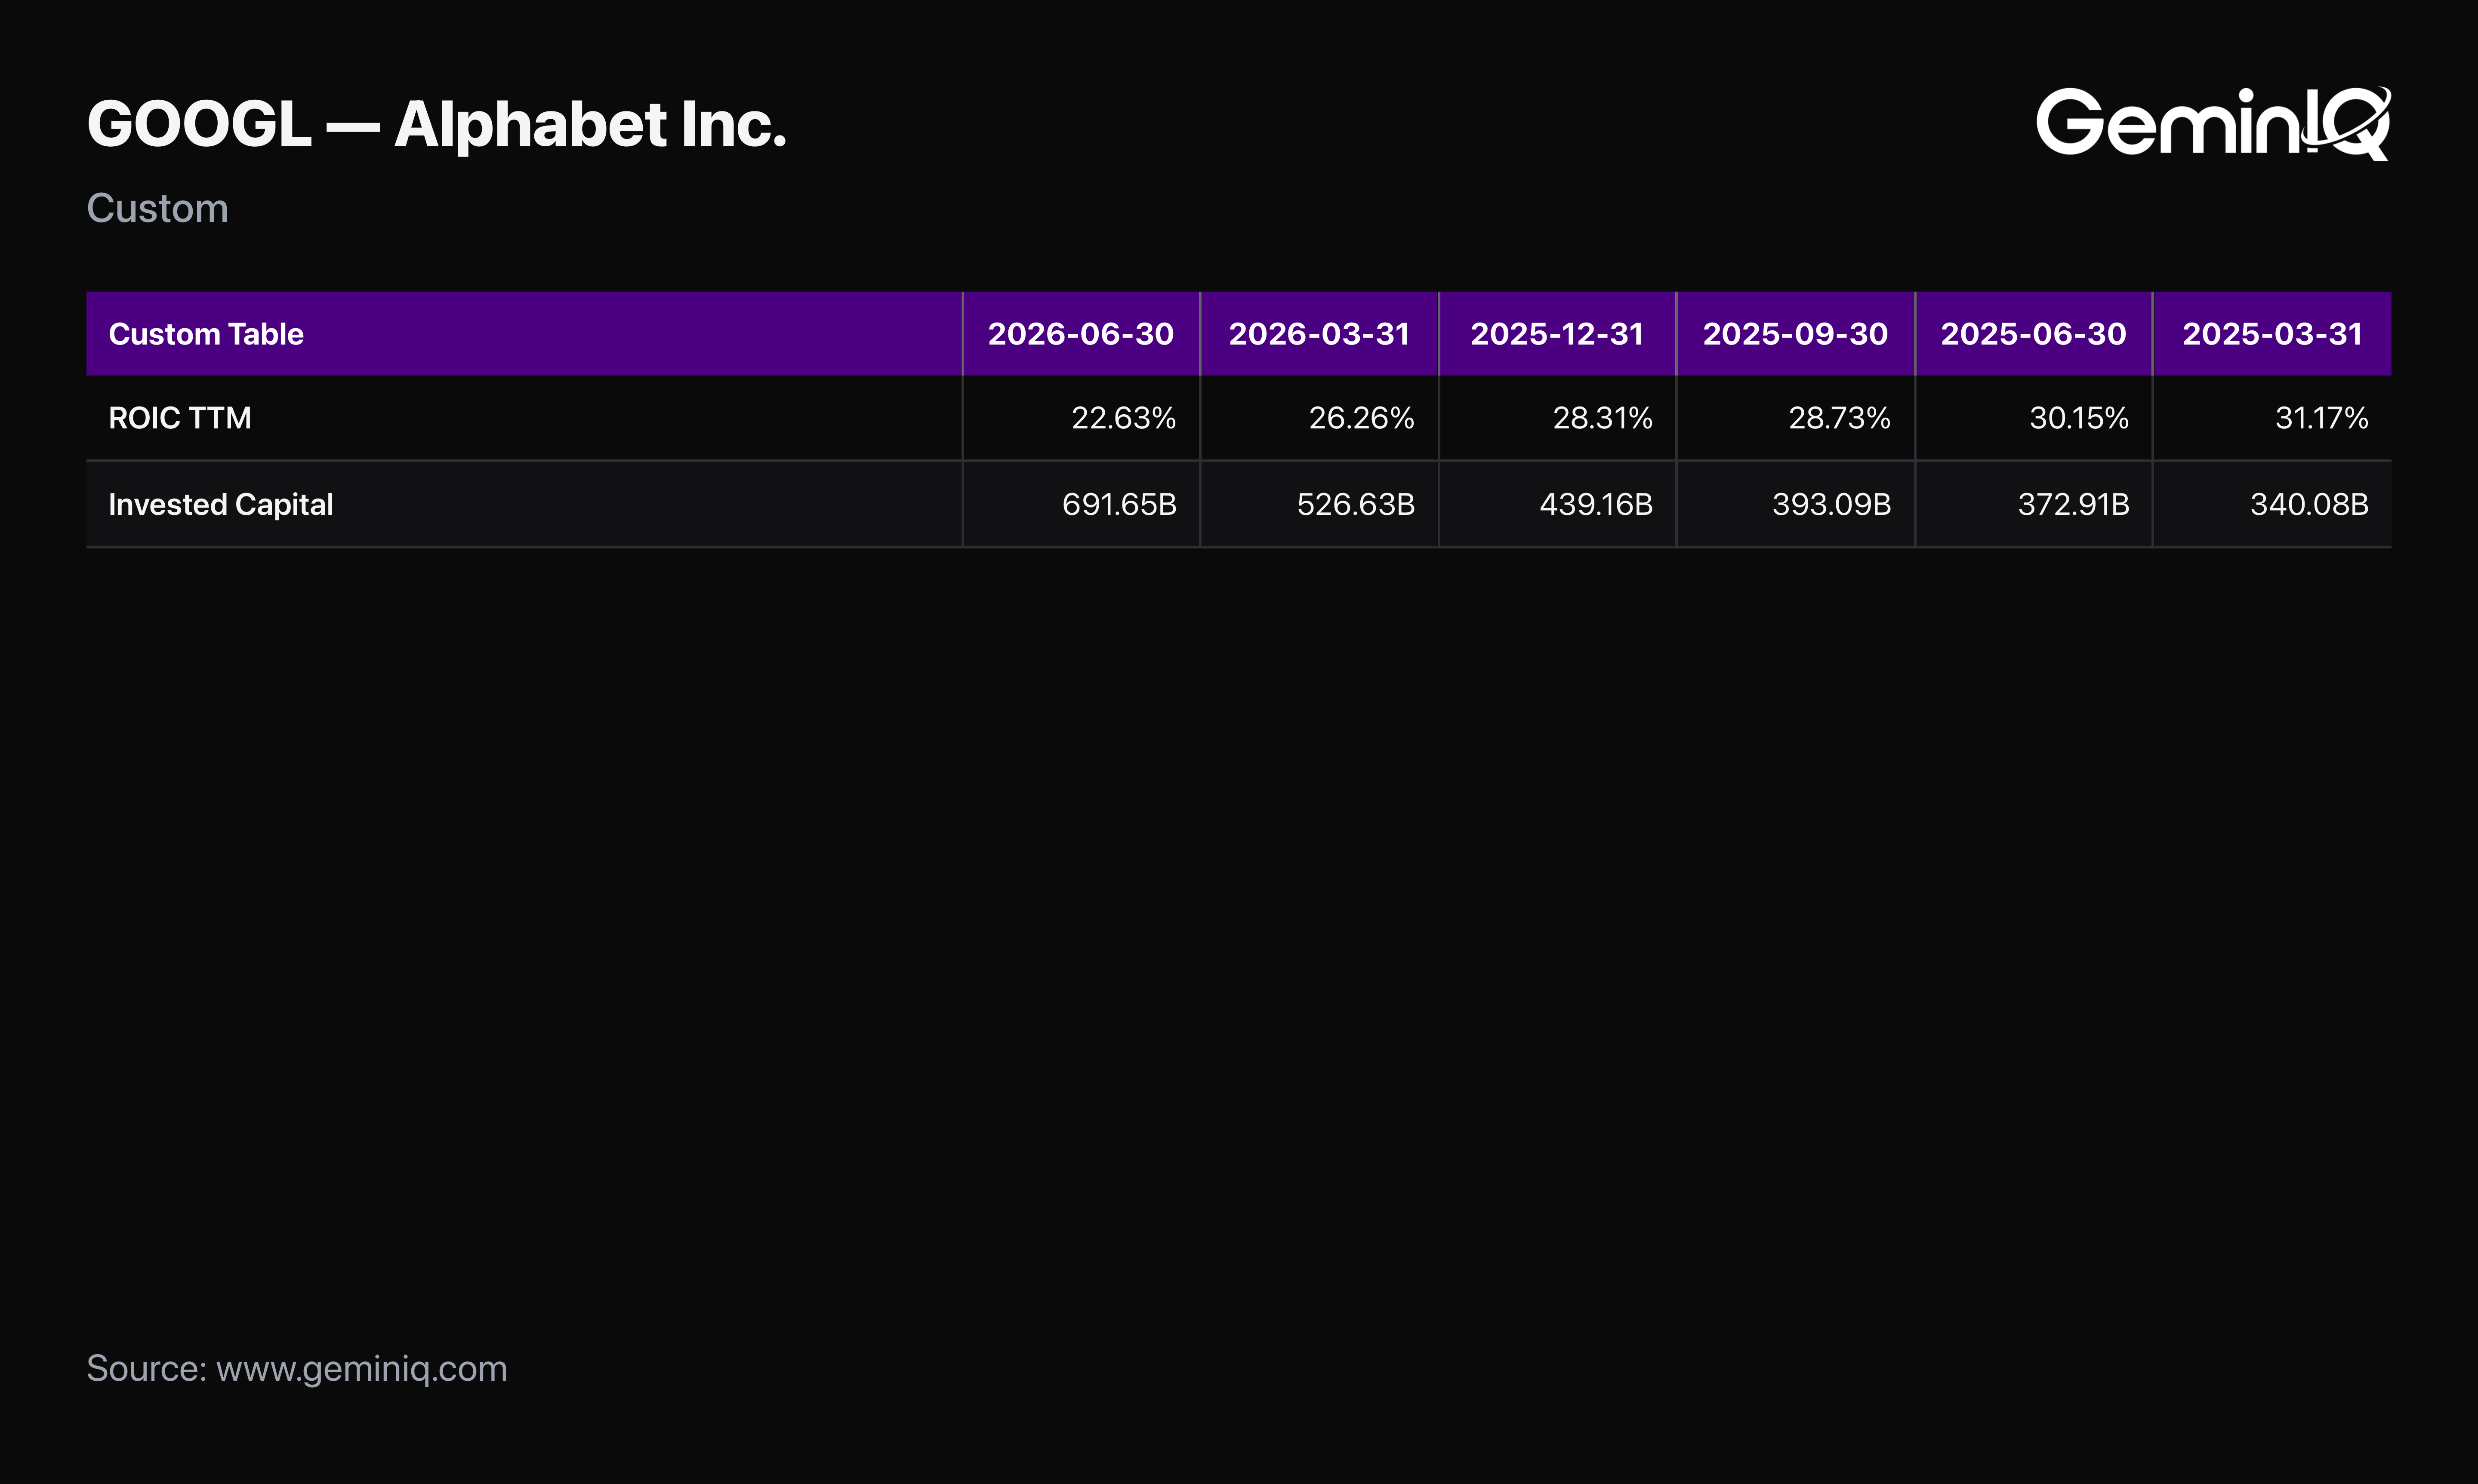
The Data: GeminIQ's pre-calculated Return on Invested Capital (ROIC) (TTM) fell to 22.6% from 26.3% the prior quarter — a 3.6 percentage point decline in the same quarter net income more than doubled. The reason lives in the formula's two halves. GeminIQ's NOPAT (TTM), built from operating income rather than net income, grew a modest 5.9%, from $113.806 Billion to $120.465 Billion. But GeminIQ's pre-calculated Invested Capital jumped 31.3%, from $526.634 Billion to $691.651 Billion, as Total Equity grew $161.734 Billion in a single quarter — largely the same paper gain flowing through net income into retained earnings, then into the capital base ROIC is measured against.
The GeminIQ Edge: Because ROIC's numerator is built from operating income and excludes the securities gain, while its denominator absorbs that same gain the moment it lands in equity, the metric captures a real compression in returns on capital that a net-income-based screen would completely miss. Net Debt also grew to $42.254 Billion from $39.438 Billion, a second, smaller drag on the same ratio.
Smart Money and the Insider Record
What are the people actually running the company doing with their own money, and who is still holding the stock at the institutional level?
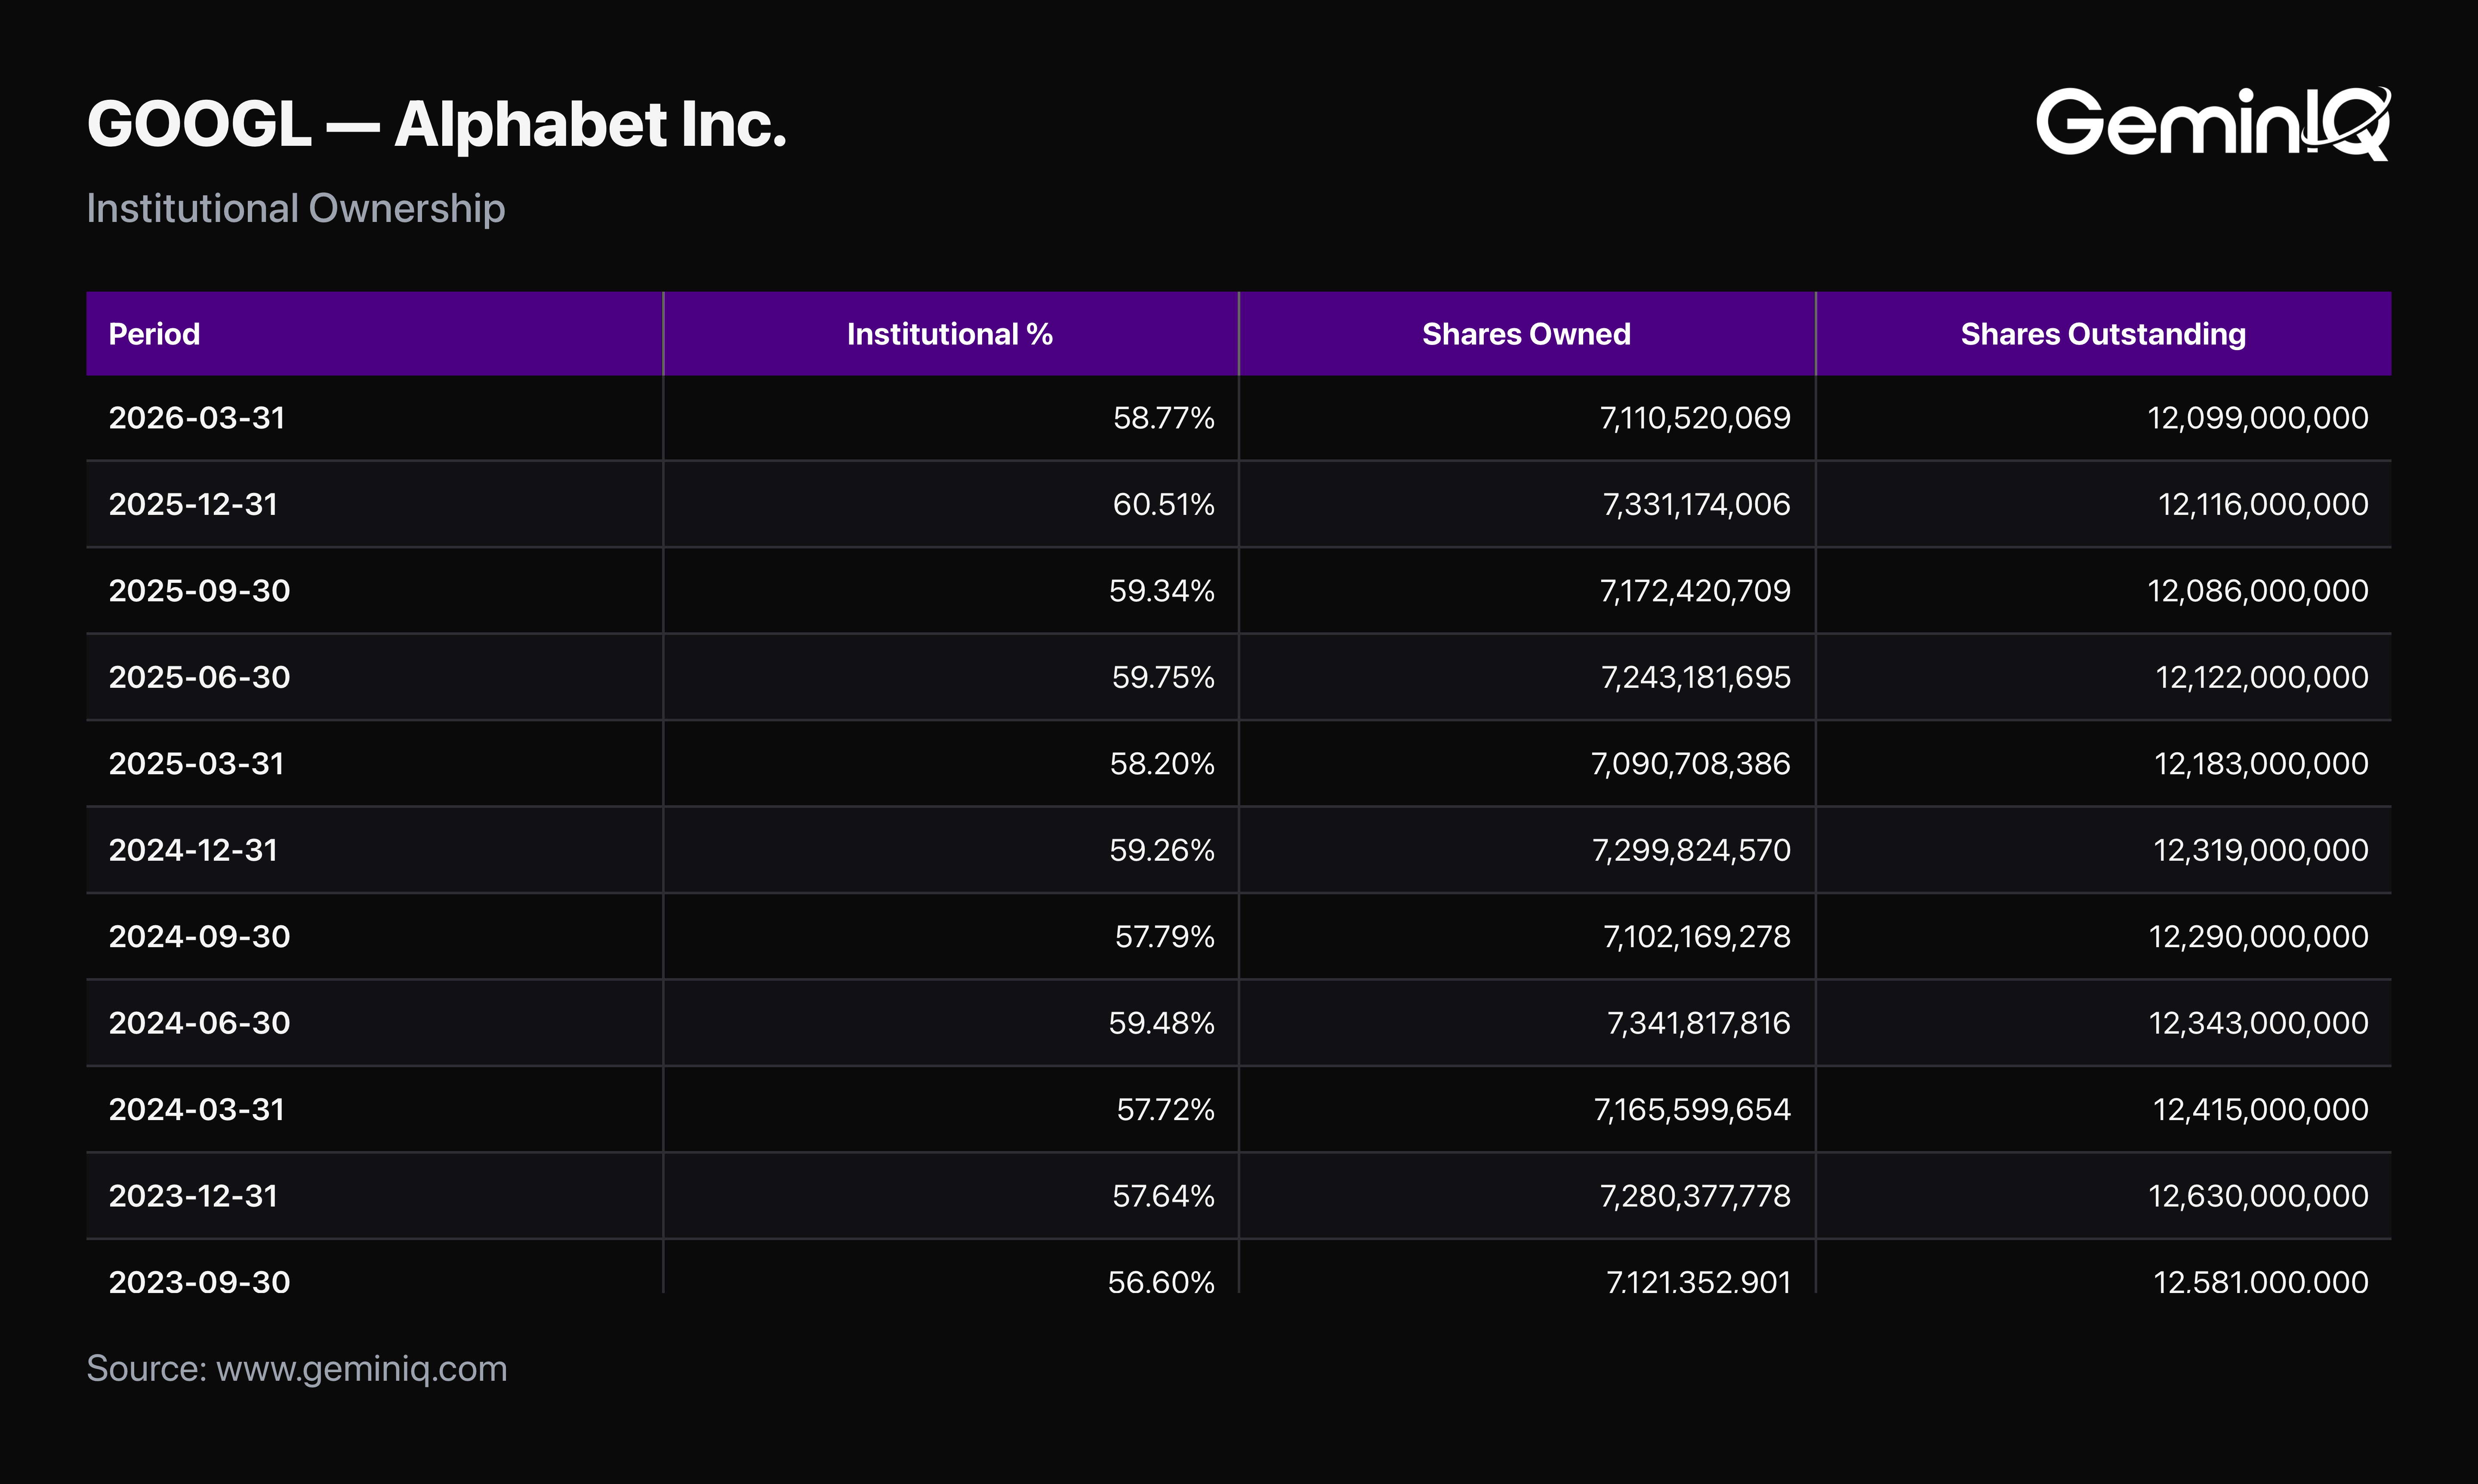
The Data: Institutional Ownership stood at 58.77% as of the most recent 13F (quarter ending March 31, 2026, filed with the standard lag), down modestly from 60.51% the prior quarter — not a dramatic shift either direction. Insider Transactions show a heavily sale-weighted record across the available filing history: 838 sales against just 3 purchases. The most recent activity is small and routine — a handful of sub-$500,000 sales by the VP, Chief Accounting Officer and other filers, consistent with scheduled equity compensation vesting rather than any reaction to this quarter's results.
The GeminIQ Edge: Neither figure is dramatic in isolation, and neither one is the number that actually moved this quarter. The operating business grew at a real, single-digit-to-low-thirties clip across every core line. The $99 billion that made headlines came from somewhere else entirely, and only the raw filing data shows you where.
Frequently Asked Questions
What caused Alphabet's Q2 2026 net income to jump so sharply?
A single non-operating, non-cash line item the filing tags as Debt And Equity Securities Gain Loss, valued at $98.999 Billion this quarter, a mark-to-market gain tied to Alphabet's growing portfolio of non-marketable and equity securities. It is not related to advertising or cloud revenue.
Is Alphabet's core operating business still growing?
Yes. Operating Income was $40.77 Billion, up 30.4% year-over-year, and revenue grew 24.2% year-over-year to $119.796 Billion. Both figures exclude the securities gain entirely.
Why did GeminIQ's ROIC for Alphabet fall this quarter if net income tripled?
Because ROIC's numerator (NOPAT) is built from operating income, which grew only 5.9%, while its denominator (Invested Capital) absorbed the same securities gain once it flowed into retained earnings, growing Invested Capital 31.3% in a single quarter.
When did Alphabet file its Q2 FY2026 10-Q, and what period does it cover?
Alphabet's most recent filing is a Form 10-Q filed July 23, 2026, covering the fiscal quarter ended June 30, 2026 (Q2 FY2026).
Wall Street's data. Main Street's price.
Institutional terminals charge thousands a year for as-filed accuracy. GeminIQ gives you the same thing for a fraction of the cost: financials built directly from raw SEC EDGAR filings, not third-party APIs, with full XBRL traceability back to the original 10-K or 10-Q. No normalized guesswork, just calculated metrics, charts, screeners, and watchlists built on numbers exactly as the company reported them. Start researching now at GeminIQ.com.
All financial figures cited in this article reference Alphabet Inc.'s Q2 FY2026 10-Q (filed July 23, 2026, period ending June 30, 2026). All SEC filings are publicly available at SEC EDGAR.
Disclaimer: The content in this blog is for educational and entertainment purposes only and does not constitute financial, legal, or tax advice. Investing involves risk, including the loss of principal. The views expressed are my own and not intended as financial advice or a guarantee of future performance.