
Amazon 10-K Analysis (2026): ROIC Fell as Margins Rose

By Chad Hartman
Published · Last updated
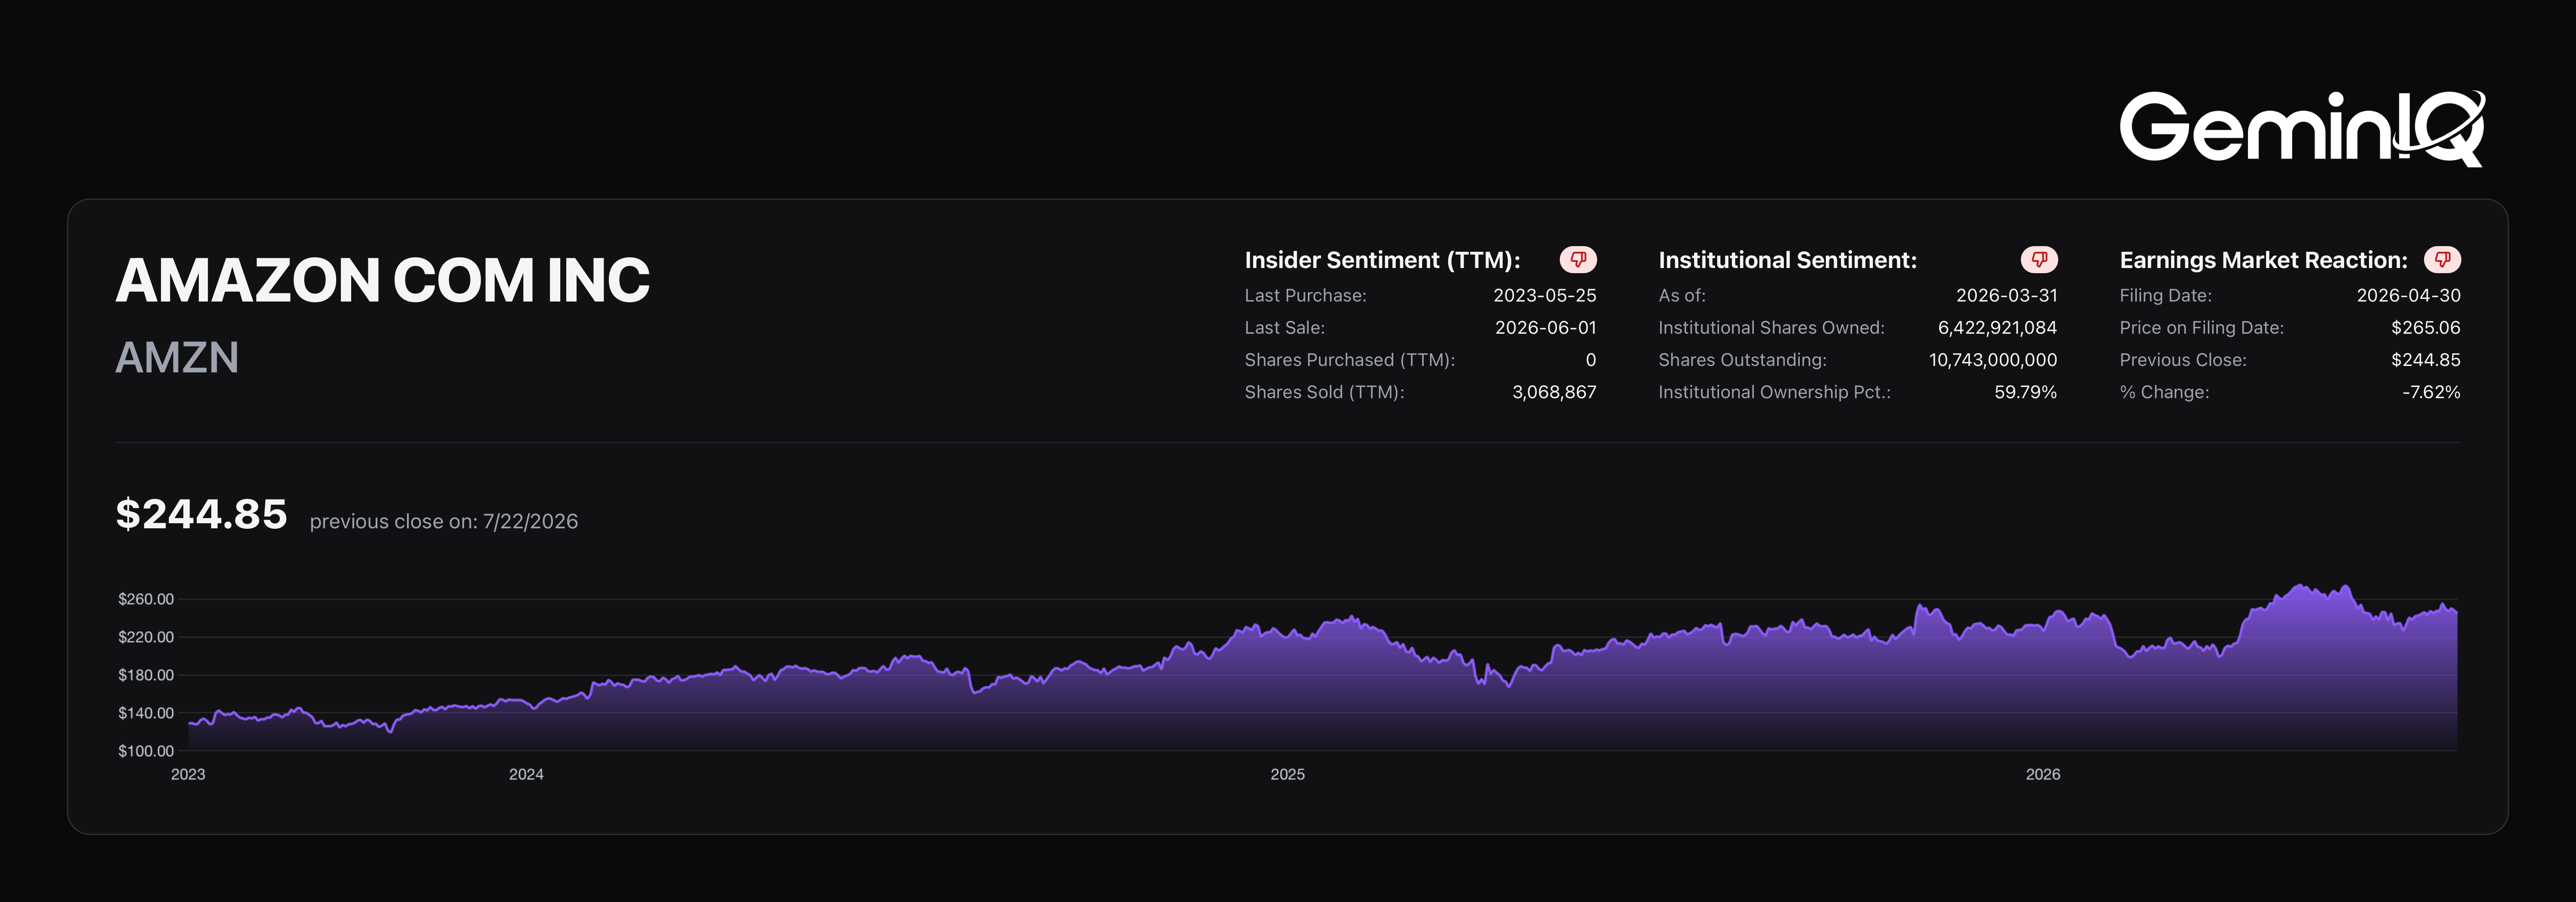
Amazon ($AMZN) filed its FY2025 10-K on February 6, 2026, and the headline numbers are the best in company history. Revenue of $716.92 Billion. Operating income of $79.98 Billion. Net income of $77.67 Billion. Every one a record. Underneath them, the number that measures how much profit Amazon earns per dollar of capital went the other way: Return on Invested Capital fell from 25.42% to 19.19% in a single year. Amazon is more profitable per dollar of sales than it has ever been and less profitable per dollar of capital than it was two years ago.
| Field | Value |
|---|---|
| Ticker | $AMZN |
| Filing | FY2025 10-K |
| Filed | February 6, 2026 |
| Period End | December 31, 2025 |
| Operating Margin (TTM) | 11.16% |
| Return on Invested Capital (TTM) | 19.19% |
| Invested Capital | $400.9 Billion |
The Record That Isn't What It Looks Like
Two measures of profitability moved in opposite directions in FY2025, and only one of them made the headlines.
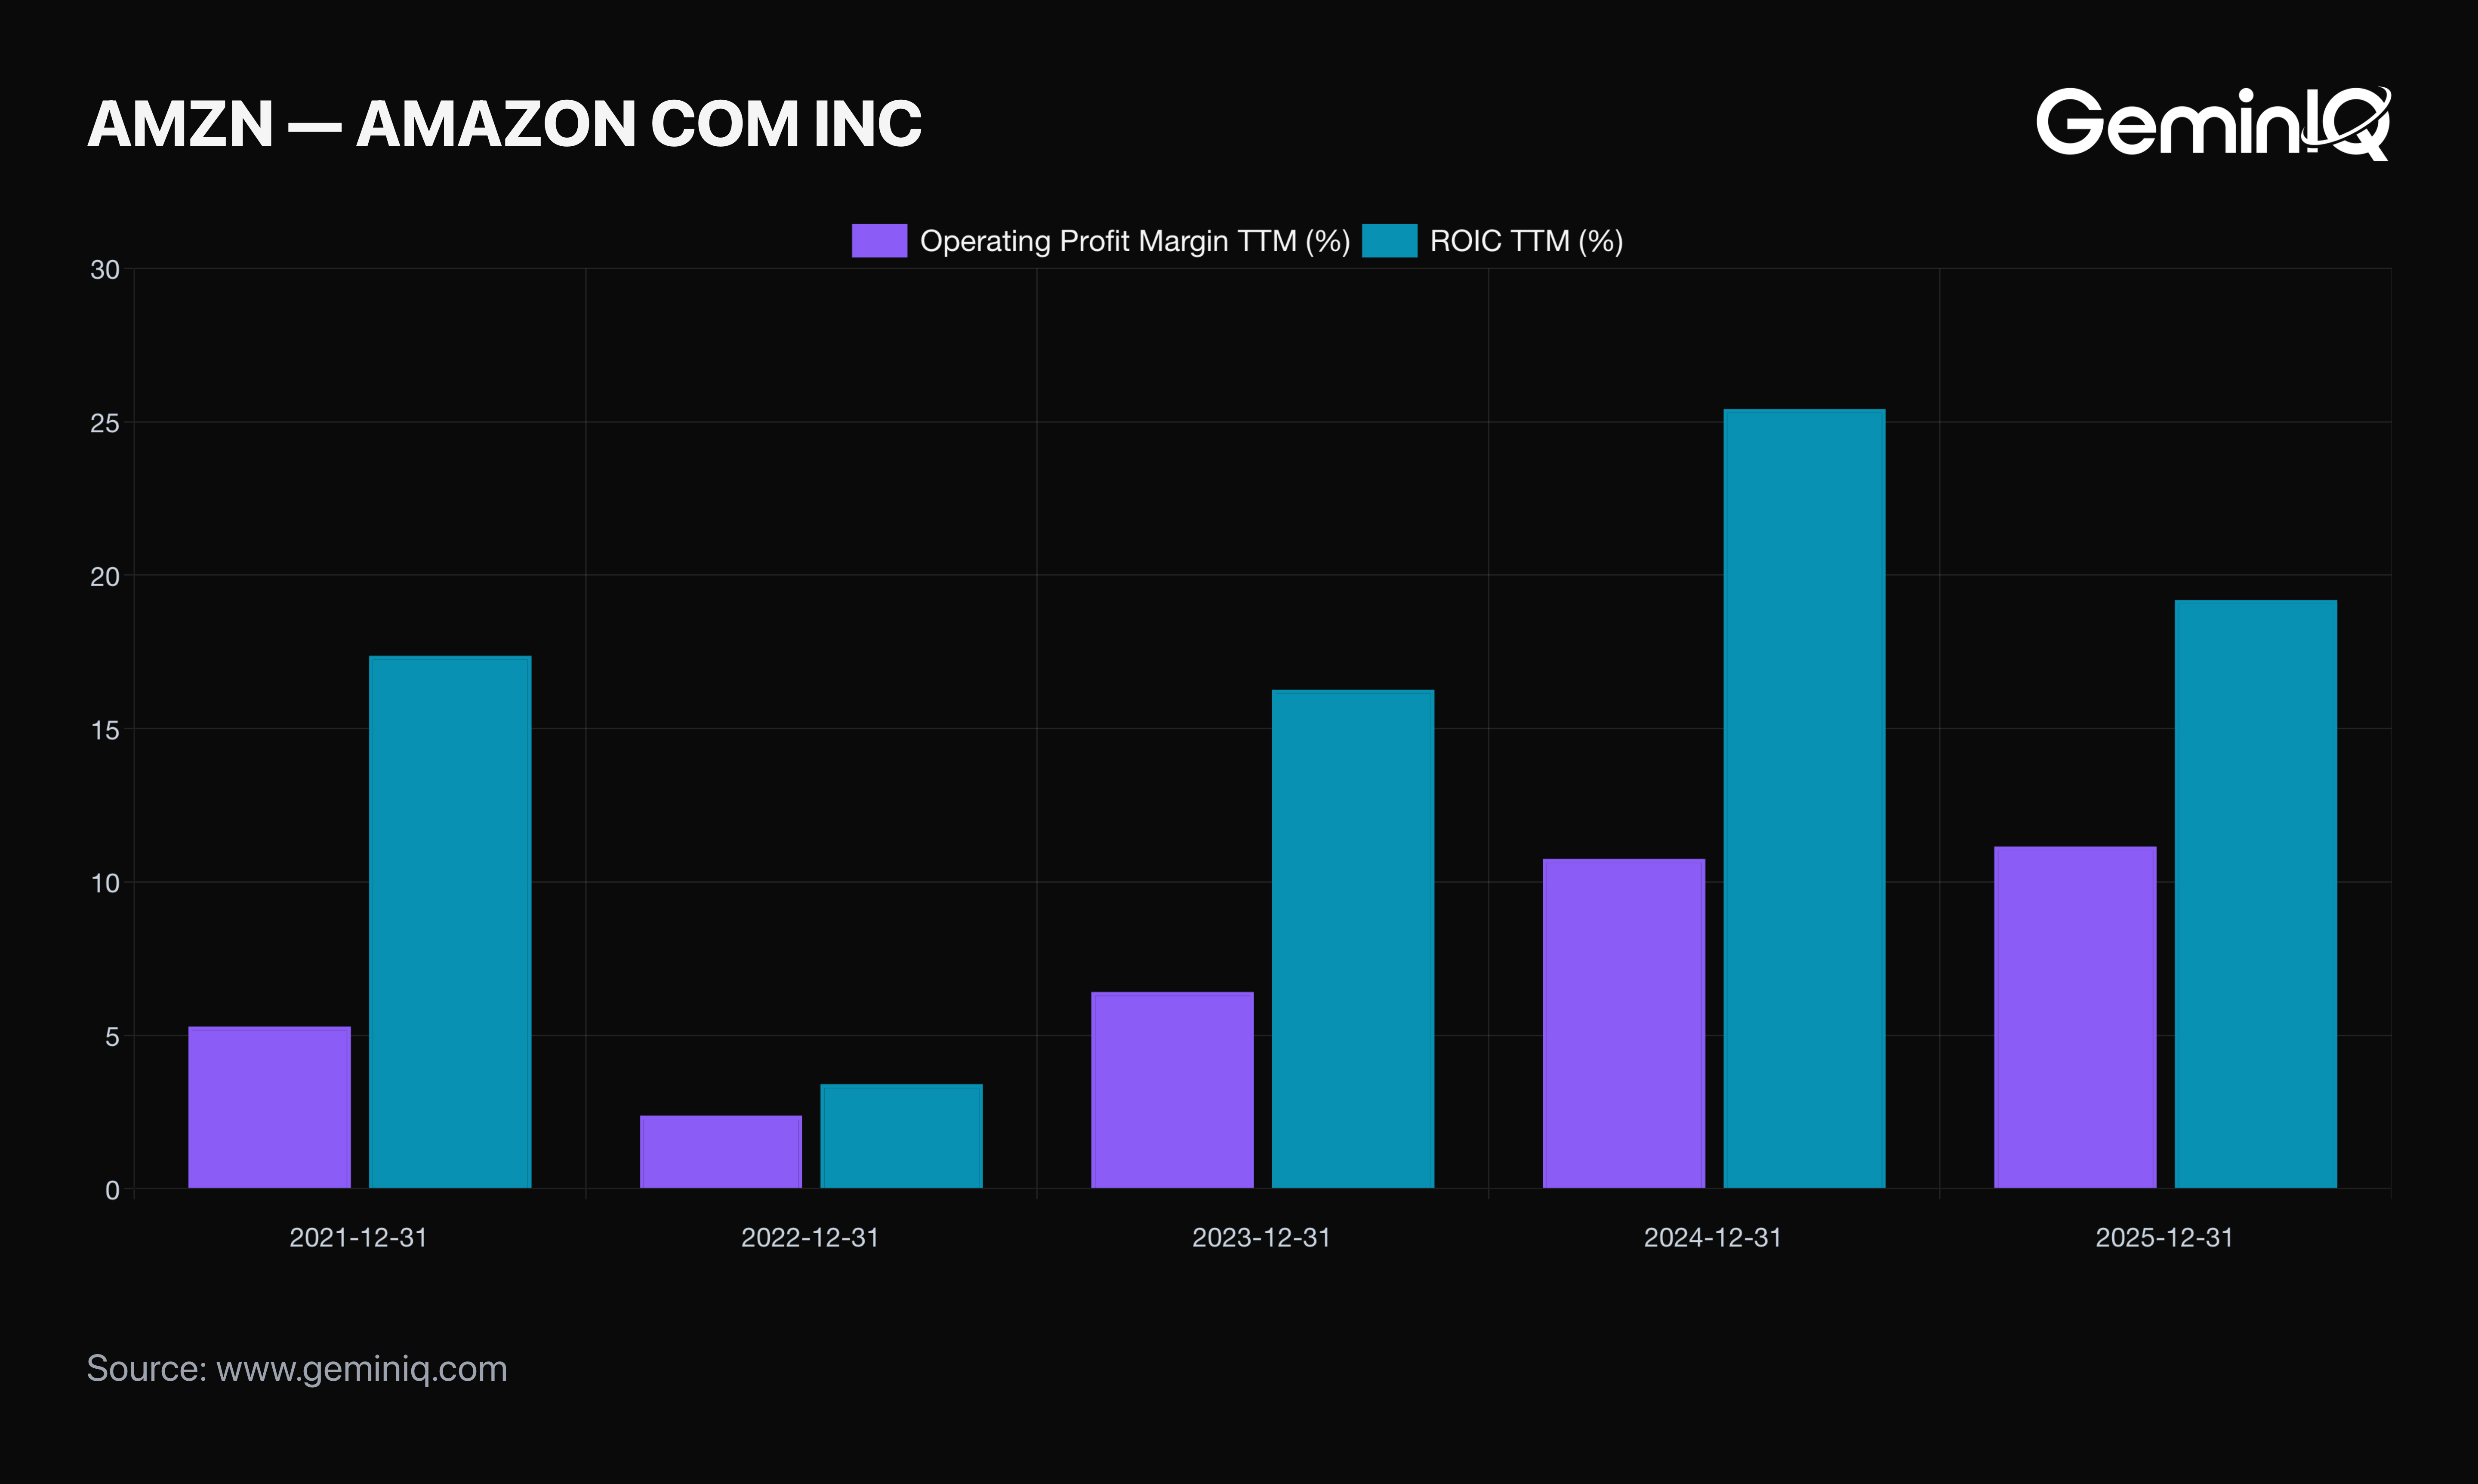
The Data: Amazon's Operating Income reached $79.98 Billion on Total Revenues of $716.92 Billion, lifting GeminIQ's Operating Profit Margin to 11.16% from 10.75% a year earlier. That is the highest operating margin in the company's filed history, and roughly double the 5.30% it posted in FY2021. Over the same year, Return on Invested Capital fell from 25.42% to 19.19%, a drop of more than six percentage points.
The arithmetic behind the divergence is not complicated. Net Operating Profit After Tax rose from $59.3 Billion to $64.3 Billion, an increase of about 8.4%. Average invested capital rose from $233.4 Billion to $335.0 Billion, an increase of 43.5%. Profit grew. The capital base grew five times faster.
The GeminIQ Edge: Margin and ROIC answer different questions, and a screener showing only the first will report FY2025 as an unambiguous record. Pulling both from Calculated Metrics against the same filing puts the two trends side by side, where the divergence is impossible to miss.
Where the Capital Went
A 43.5% increase in the capital base in twelve months is not a rounding difference. The balance sheet and the cash flow statement both show where it landed.
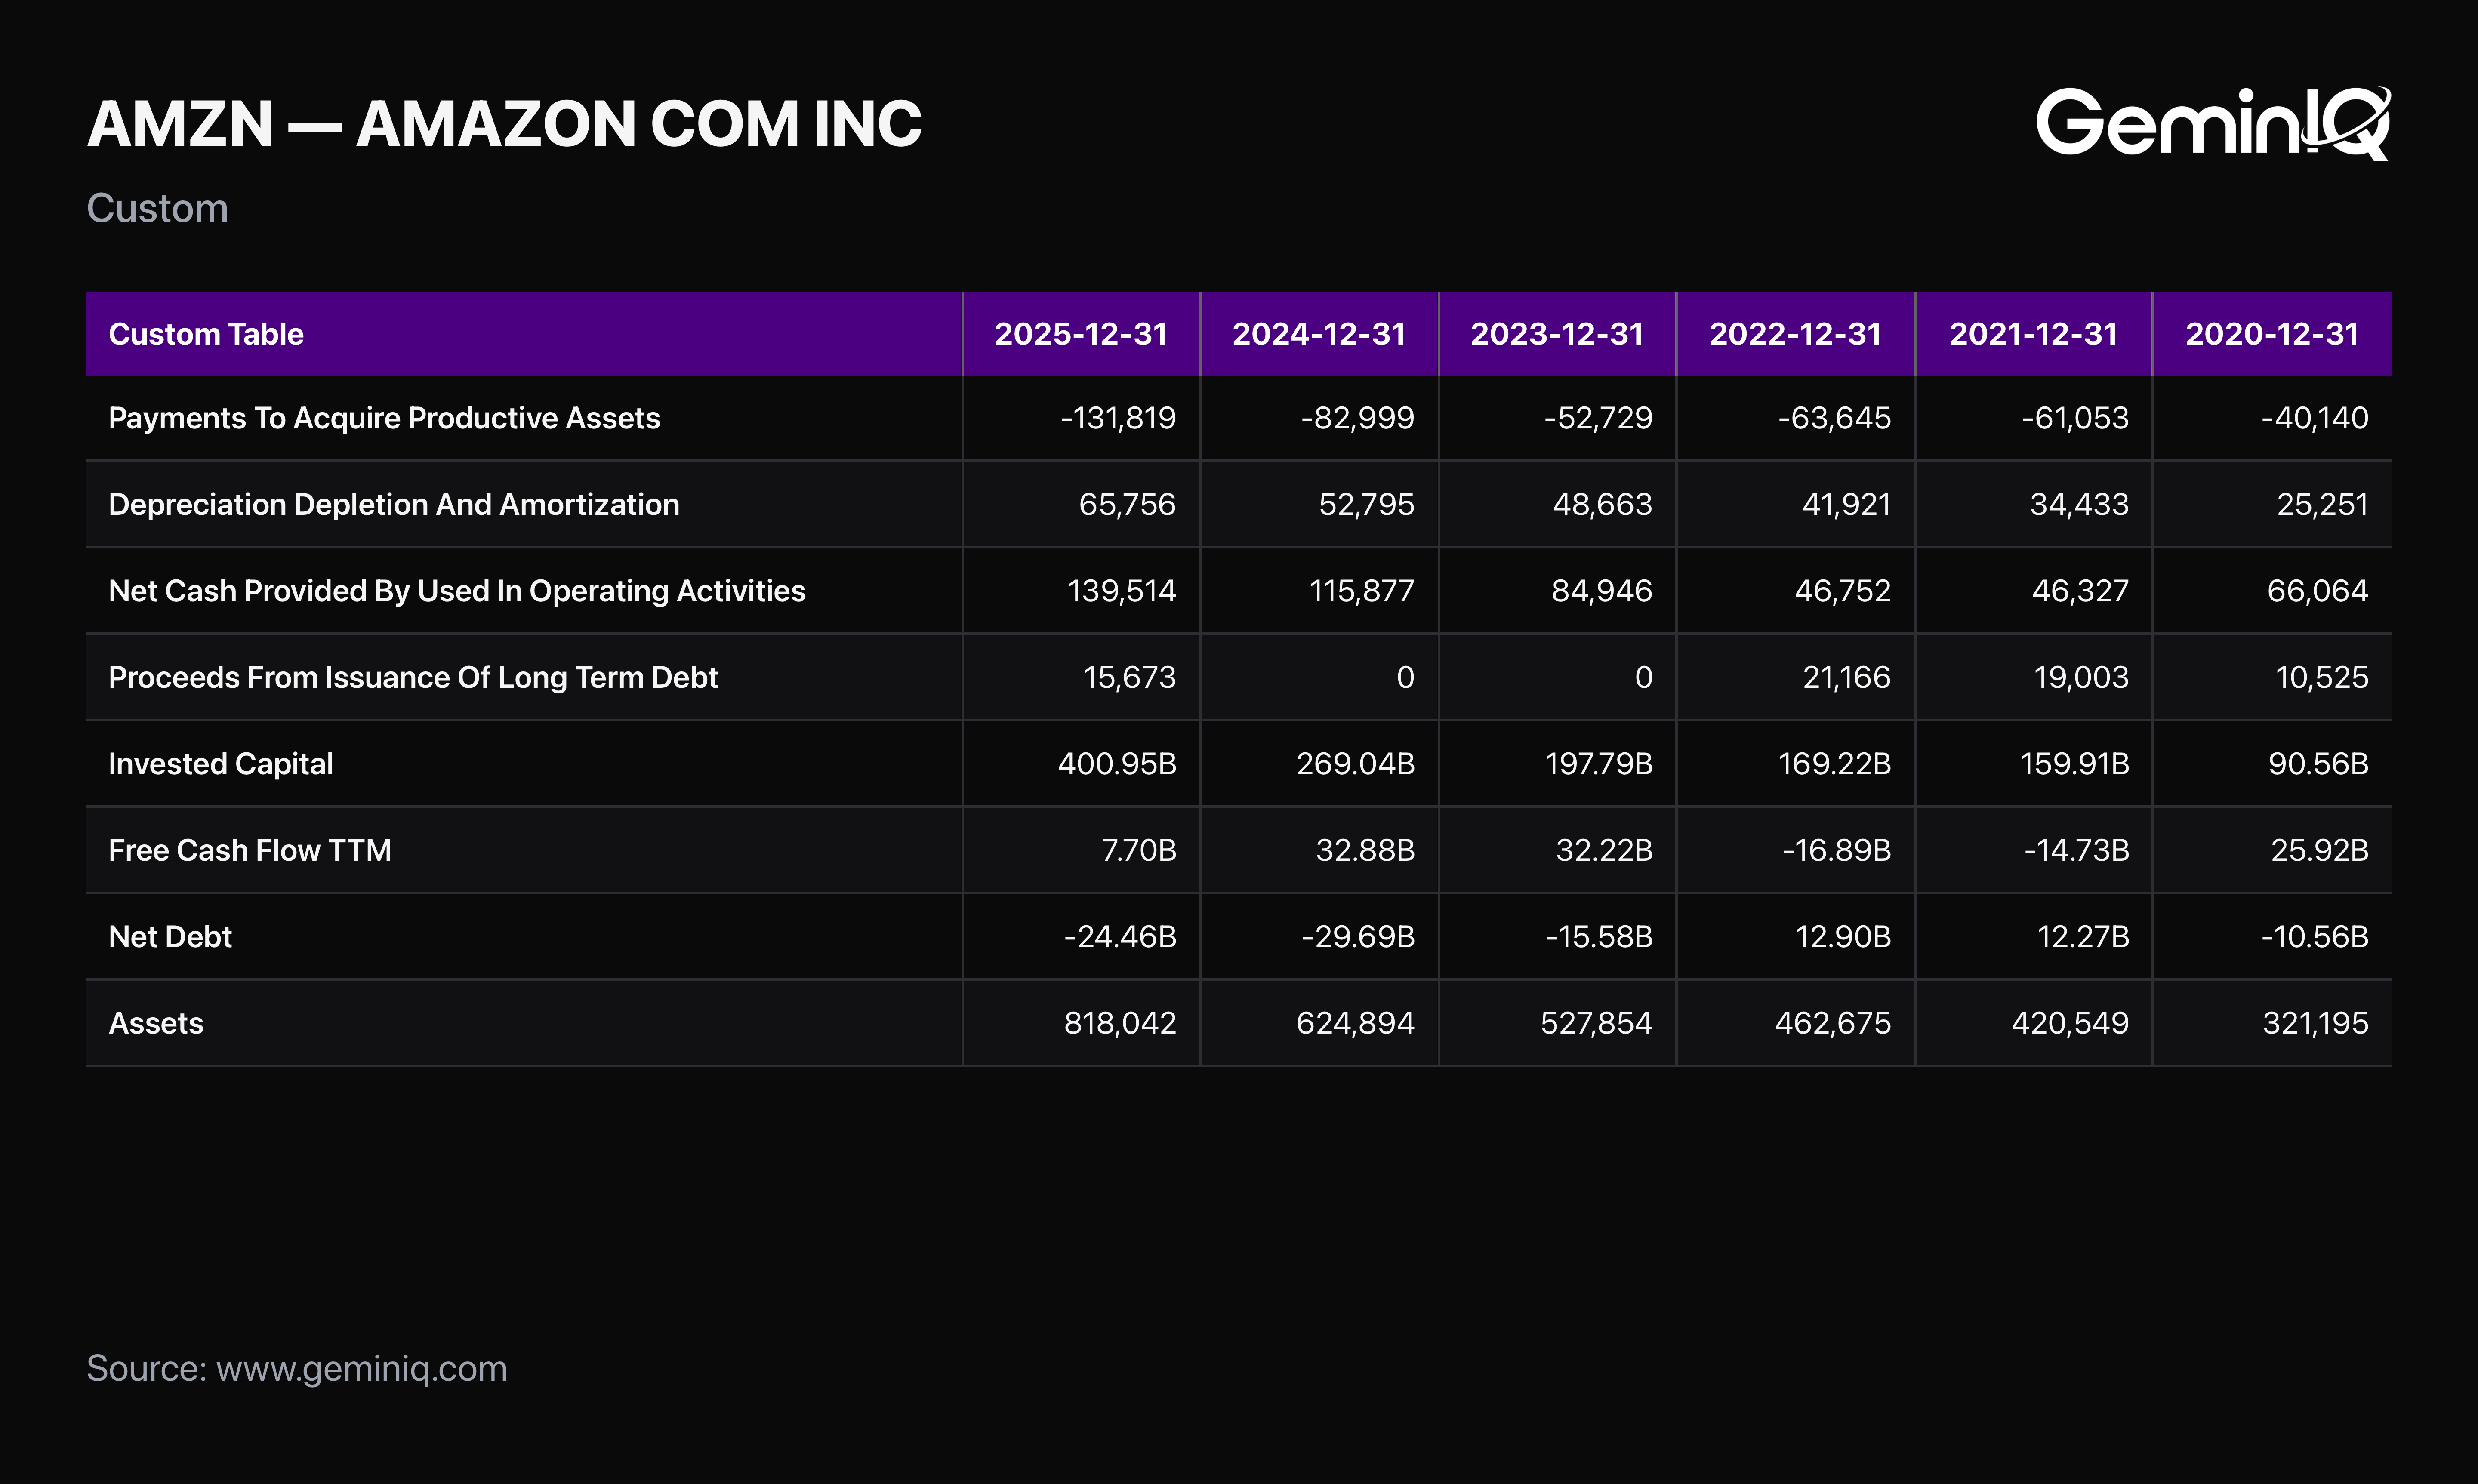
The Data: GeminIQ's Invested Capital for Amazon stood at $400.9 Billion at the end of FY2025, up from $269.0 Billion a year earlier, a 49.0% increase. Total Assets grew from $624.9 Billion to $818.0 Billion, a gain of 30.9%, against revenue growth of 12.4%. Assets expanded at roughly two and a half times the rate of sales.
The cash flow statement names the spending. Purchases Of Property And Equipment, filed as Payments To Acquire Productive Assets, totaled $131.82 Billion in FY2025 against $83.00 Billion the prior year. Depreciation And Amortization for the same year was $65.76 Billion. Amazon spent 2.00x its depreciation charge on new assets, the widest ratio in the filed window and up from 1.08x as recently as FY2023. Operating Cash Flow of $139.51 Billion was itself a record, but after that capital spending, Free Cash Flow came to $7.70 Billion.
Amazon also went back to the bond market. Proceeds From Issuance Of Long Term Debt were $15.67 Billion in FY2025 after zero the prior year, though with Net Debt still negative at -$24.46 Billion, the company remains in a net cash position.
The GeminIQ Edge: Spending twice your depreciation charge is a statement about the future, not a problem in the present. What it does mean is that the asset base carrying today's record margin is far younger than the depreciation running through today's income statement. The gap between $131.82 Billion of capital spending and $65.76 Billion of depreciation is the part of the story that shows up in later filings, not this one.
Sixty Percent of the Earnings Jump Came From Outside Operations
The net income record deserves its own look, because most of the increase did not come from selling anything.
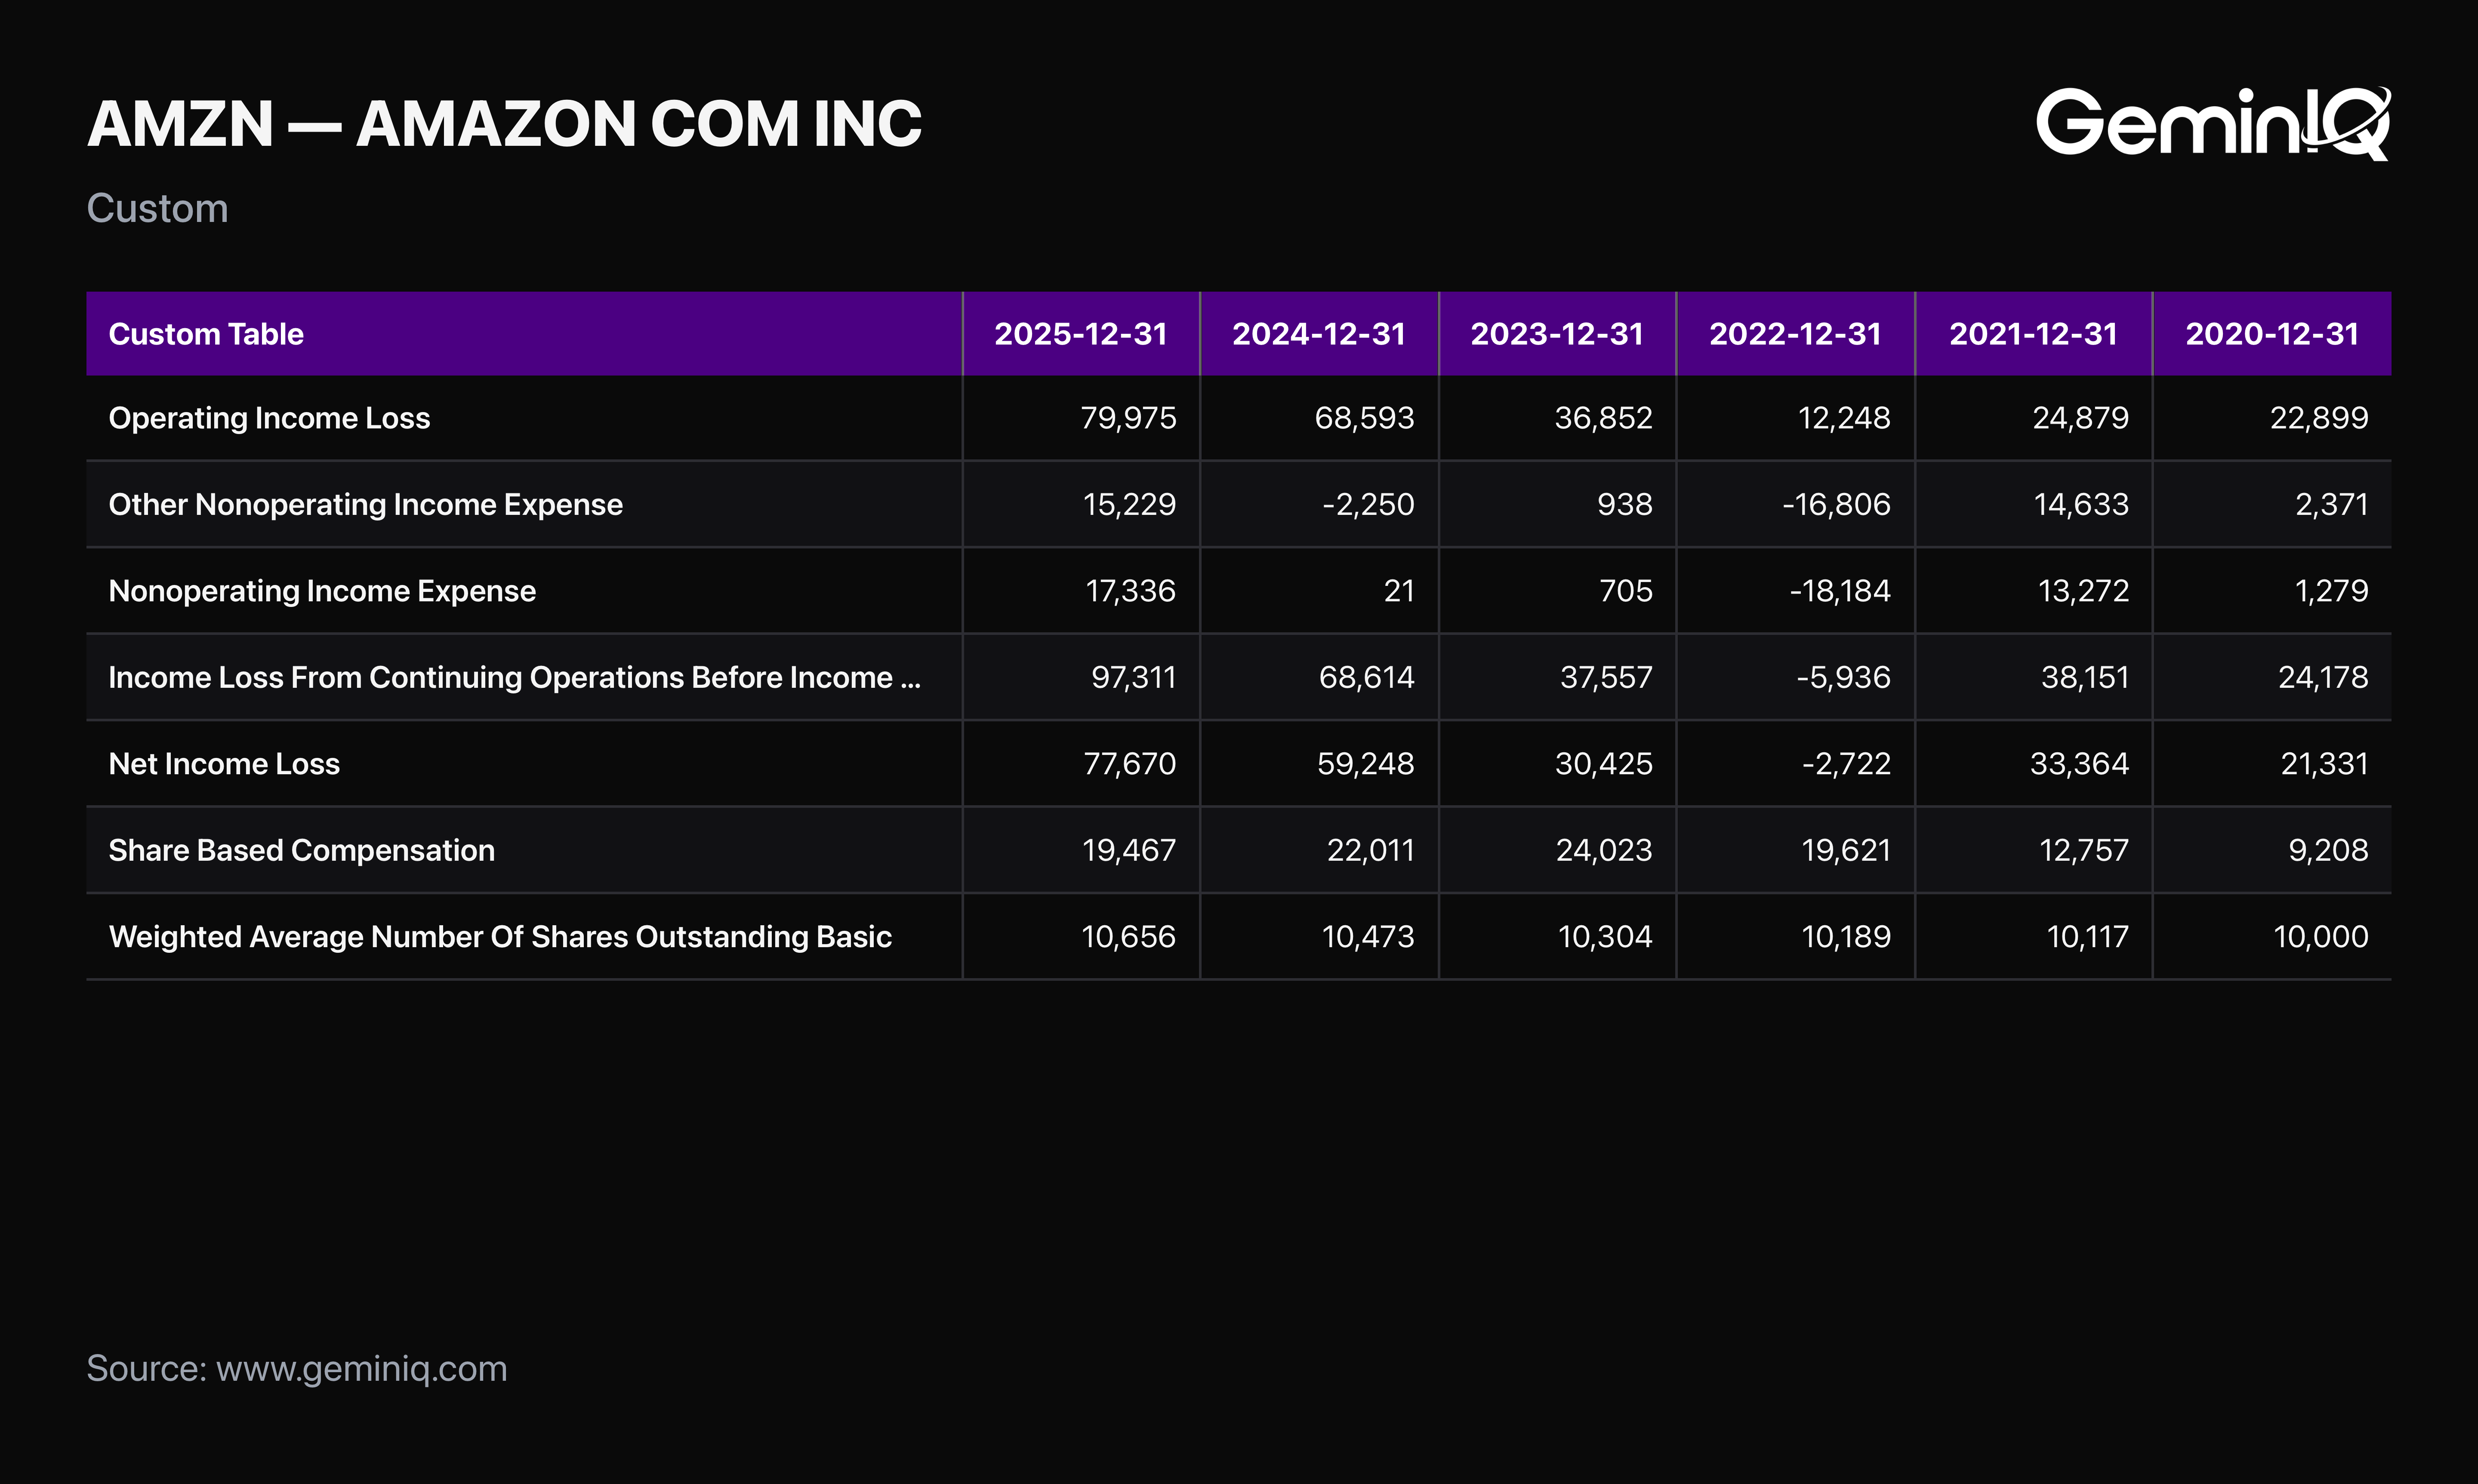
The Data: Amazon's Income Before Income Taxes rose from $68.61 Billion to $97.31 Billion, an increase of $28.70 Billion. Operating Income accounted for $11.38 Billion of that. Total Non-Operating Income accounted for $17.32 Billion, swinging from essentially nothing ($0.02 Billion in FY2024) to $17.34 Billion in FY2025. That single swing represents roughly 60% of the entire pretax increase. The line driving it is Other Income (Expense), Net, filed as Other Nonoperating Income Expense, which moved from -$2.25 Billion to $15.23 Billion.
Net Income landed at $77.67 Billion after a tax provision of $19.09 Billion, up from $9.27 Billion. Share Based Compensation was $19.47 Billion, down from $22.01 Billion, though basic shares outstanding still rose from 10.473 Billion to 10.656 Billion.
The GeminIQ Edge: Non-operating income is real income and it belongs on the income statement. It is also the least repeatable line on it. Reading Operating Income and Total Non-Operating Income as separate series rather than collapsing both into a single net income figure is what separates an operating record from an accounting one.
Smart Money and the Insider Record
What are the people actually running the company doing with their own money?
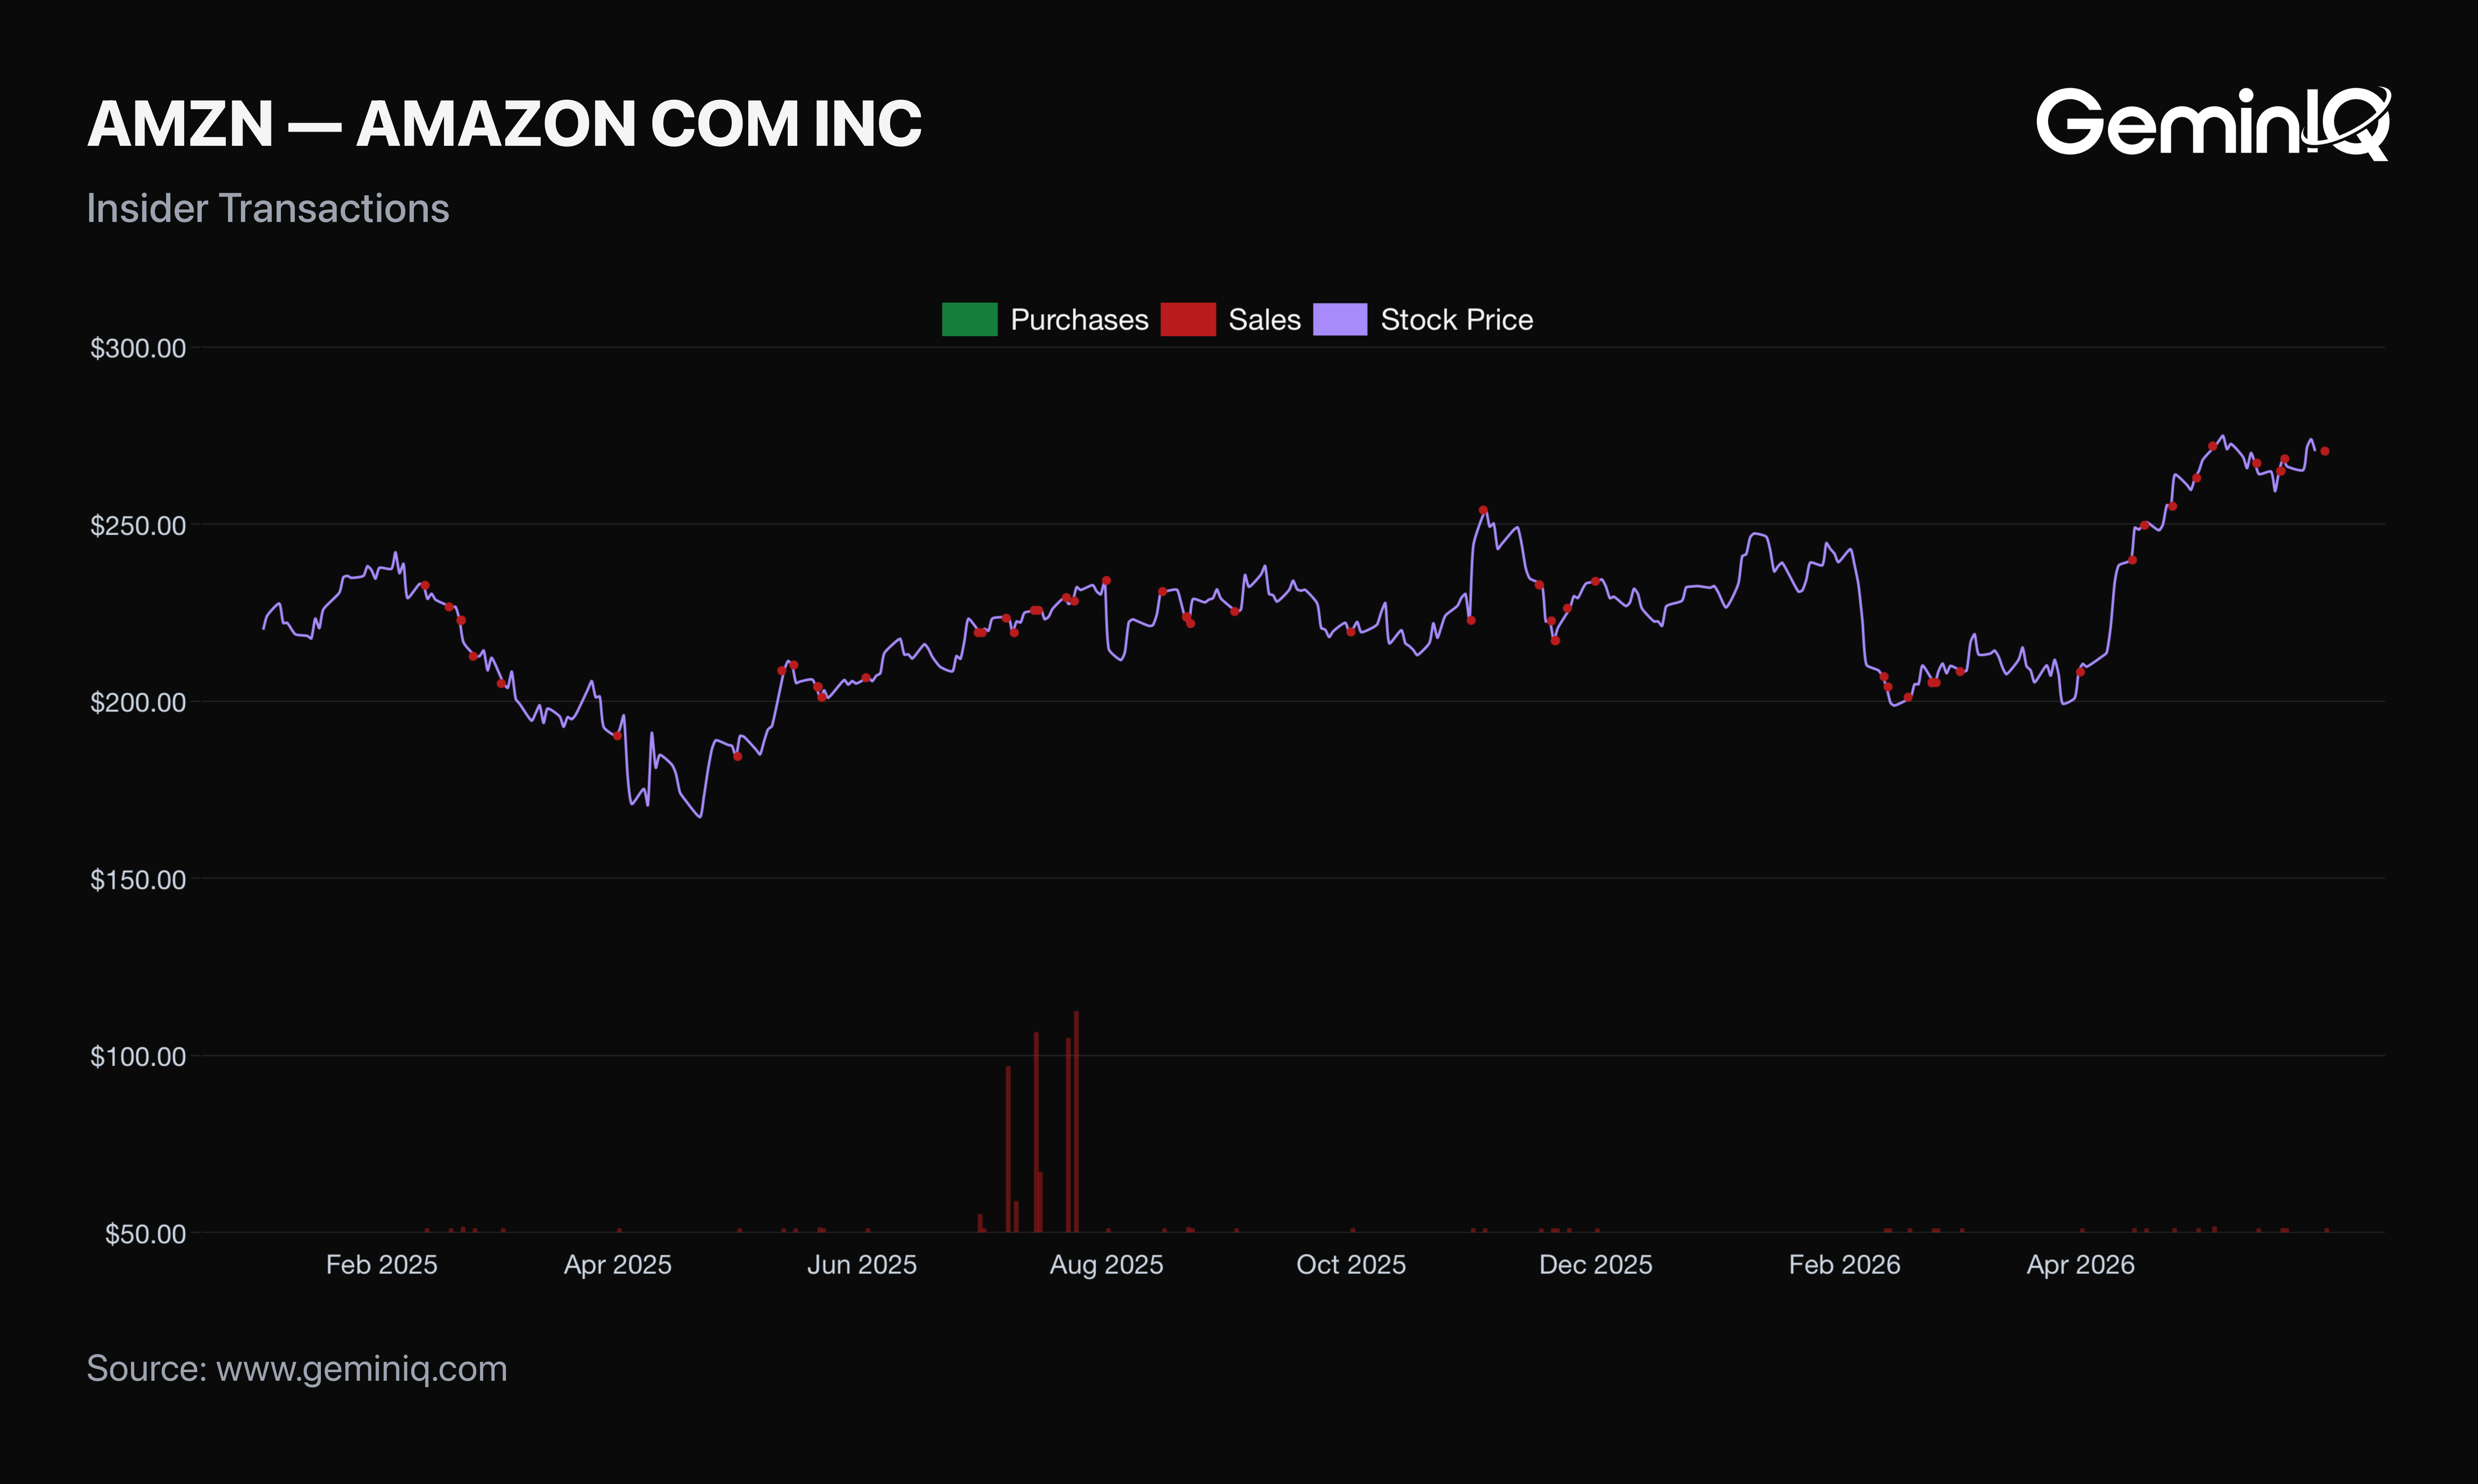
The Data: Since January 1, 2025, GeminIQ's Insider Transactions records 87 sale filings by Amazon insiders totaling $5.82 Billion, and zero purchases. The four largest are all by the Executive Chair, including 4,273,237 shares at $227.83 on July 21, 2025, for $973.57 Million, and 4,273,237 shares at $224.98 on July 11, 2025, for $961.39 Million.
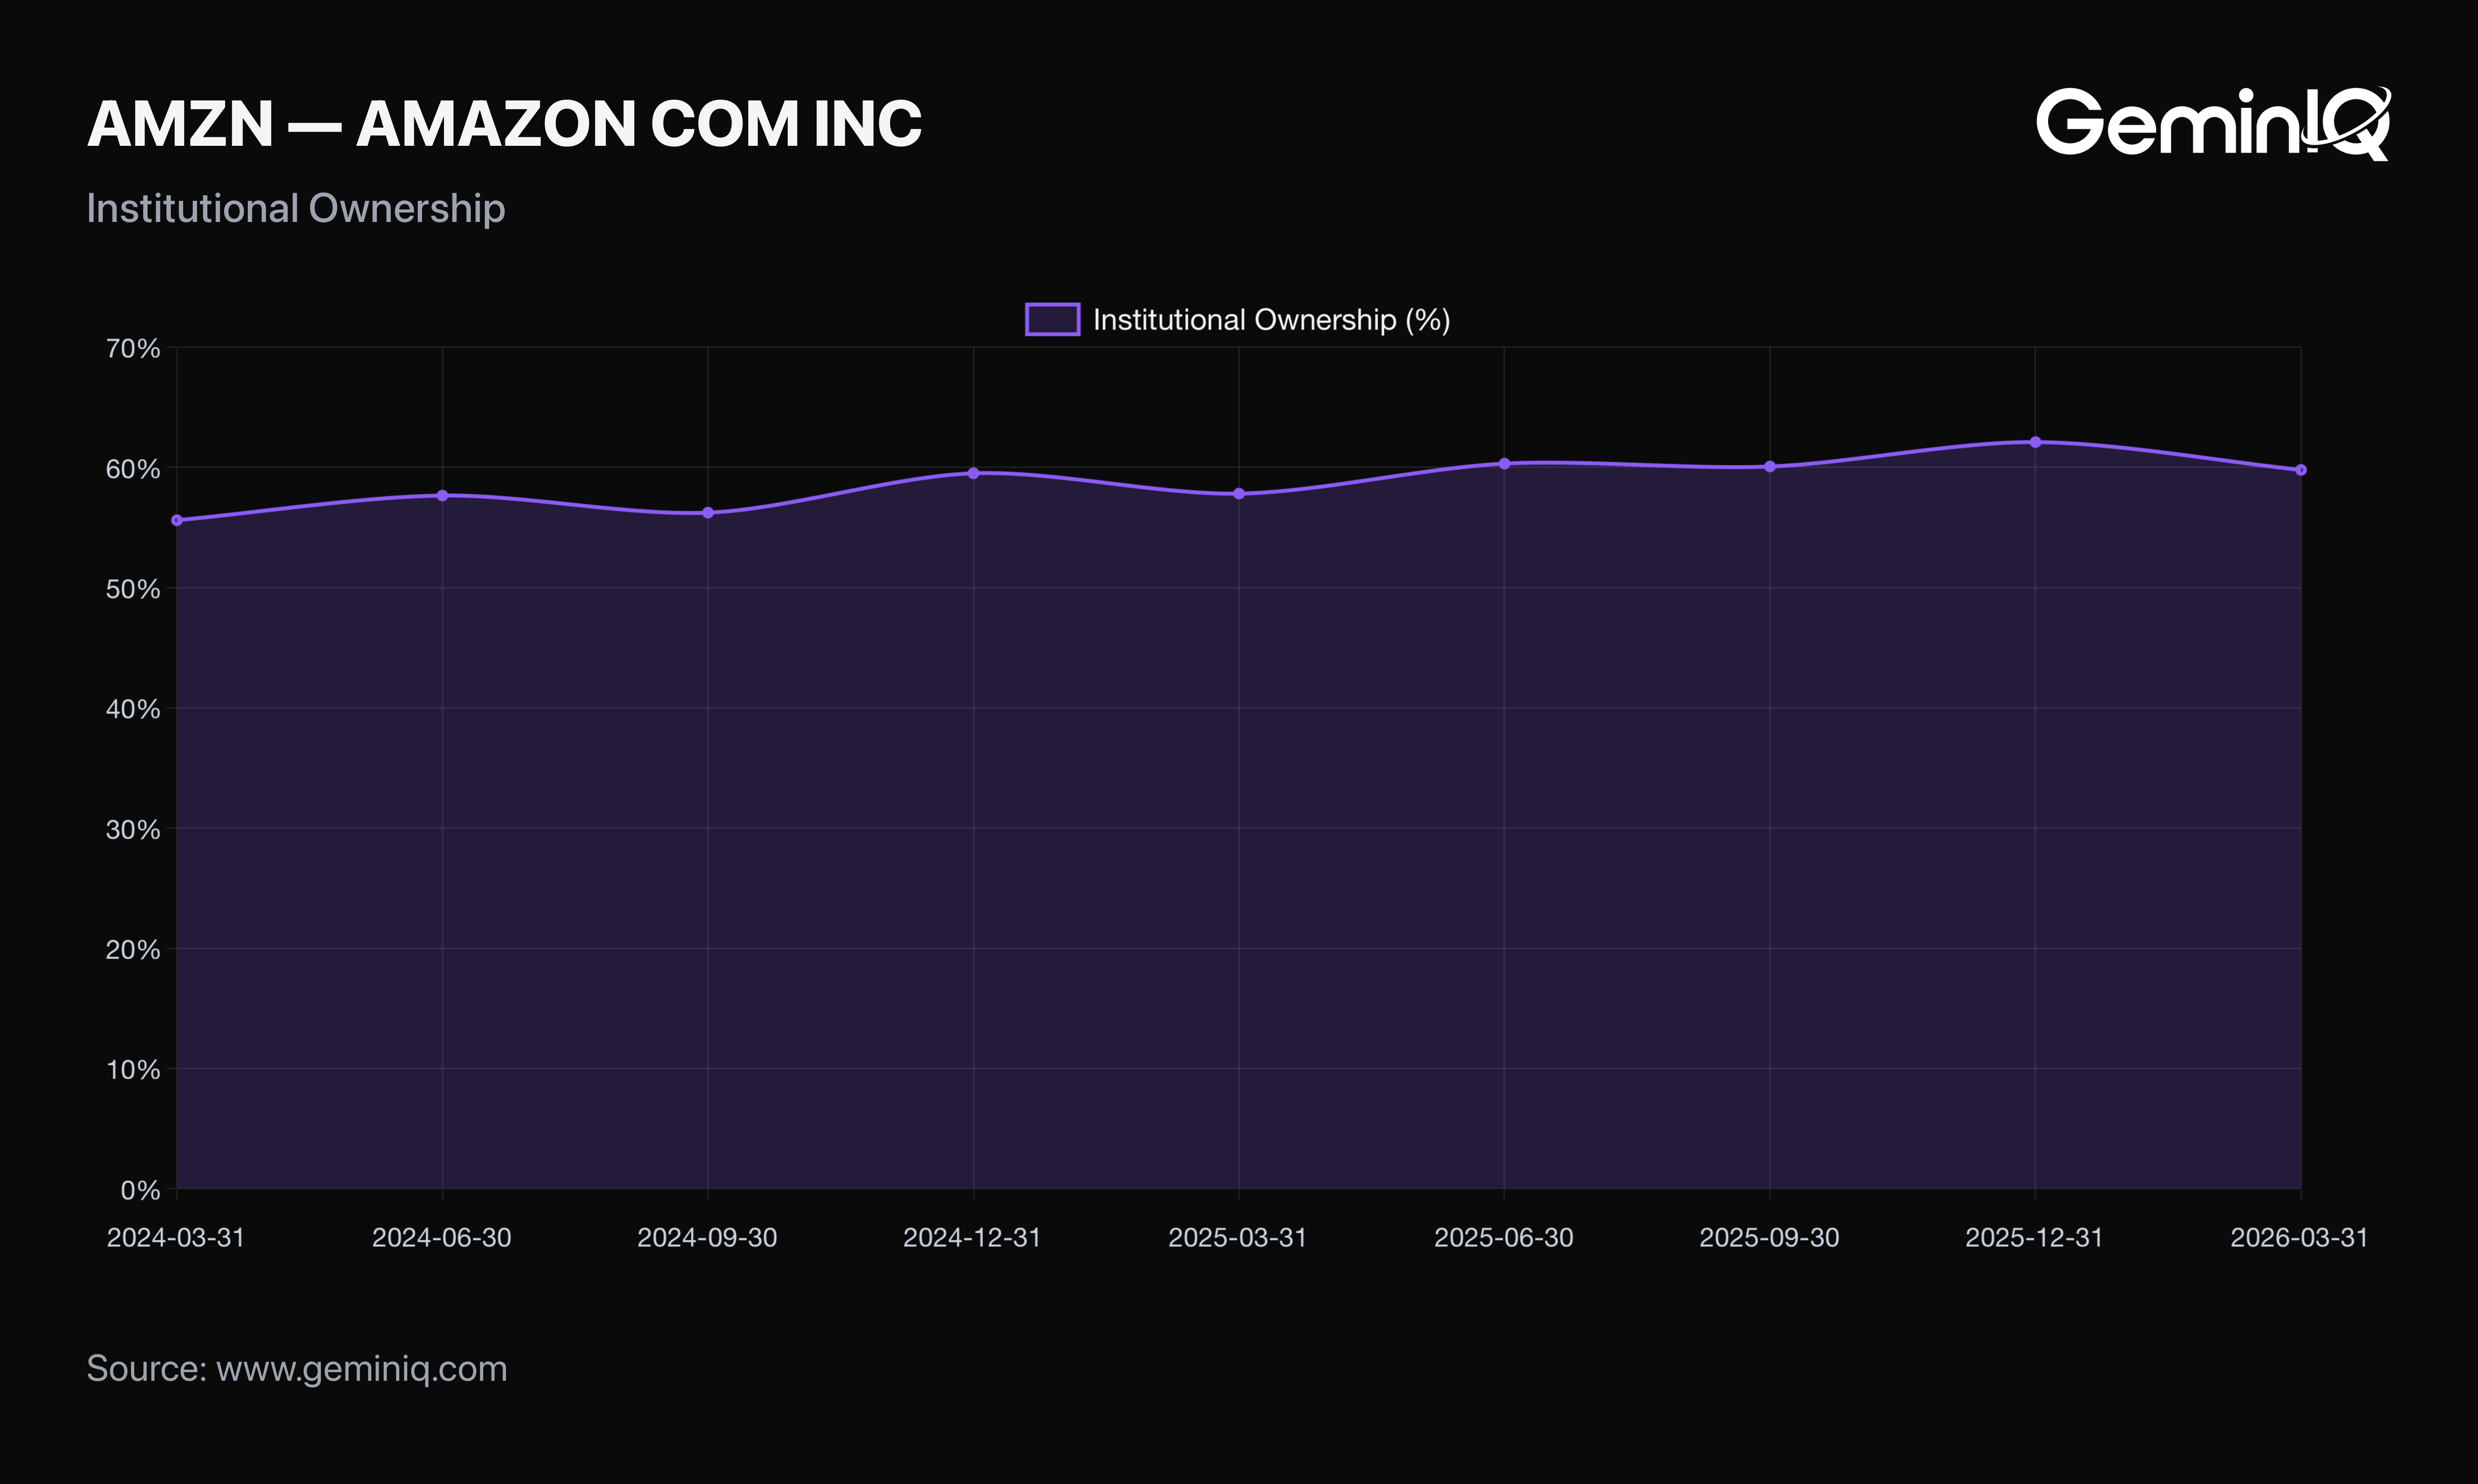
Institutional Ownership reached 62.10% of shares outstanding as of the quarter ending December 31, 2025, then eased to 59.79% as of March 31, 2026. Both readings come from quarterly 13F filings and describe positioning as of those quarter-ends rather than current holdings.
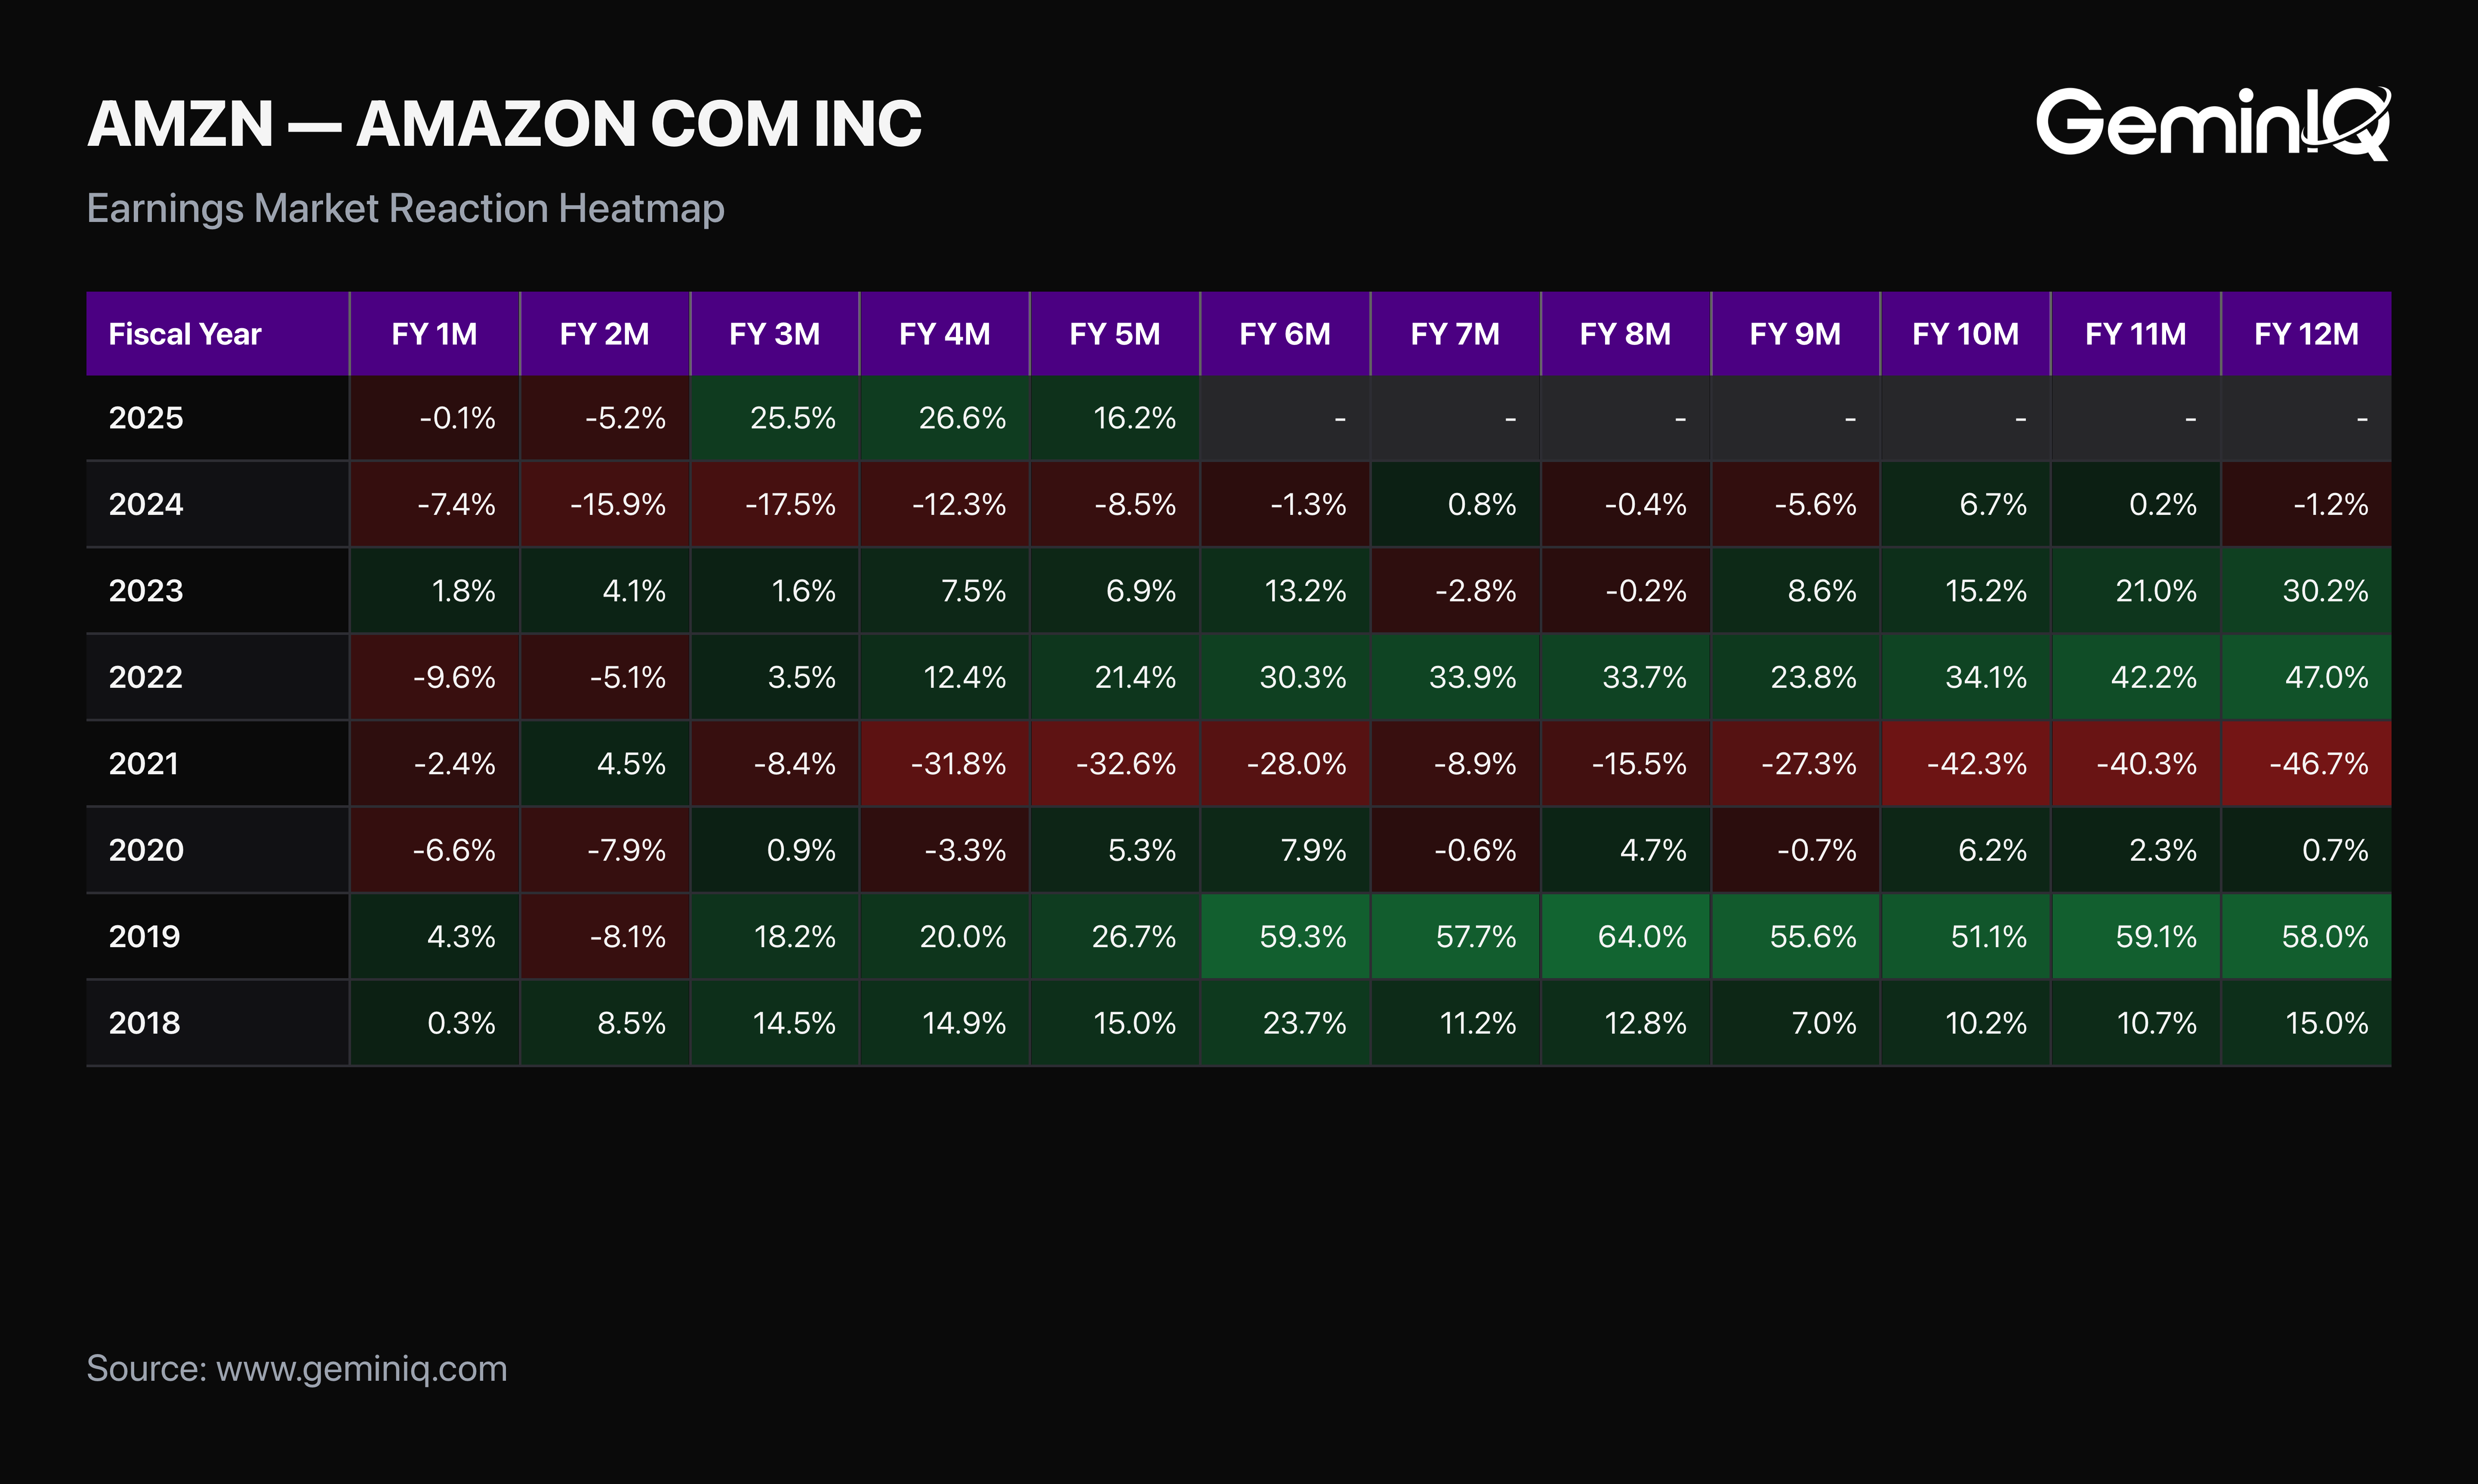
The GeminIQ Edge: Executive Chair selling at Amazon runs on long-scheduled plans and reads as noise on its own. The more informative record is what followed the filing. GeminIQ's Earnings Market Reaction Heatmap shows the stock roughly flat one month after this 10-K was filed, down 5.22% at two months, then up 25.52% at three months and 16.20% at five. The full twelve-month window has not yet elapsed.
Frequently Asked Questions
Why did Amazon's ROIC fall in FY2025?
Because invested capital grew far faster than profit. NOPAT rose about 8.4%, from $59.3 Billion to $64.3 Billion, while average invested capital rose 43.5%, from $233.4 Billion to $335.0 Billion. Return on Invested Capital fell from 25.42% to 19.19% as a result, even though operating margin hit a record 11.16%.
How much did Amazon spend on capital expenditure in FY2025?
Payments To Acquire Productive Assets totaled $131.82 Billion, up from $83.00 Billion in FY2024. That is 2.00x the year's Depreciation And Amortization charge of $65.76 Billion, the widest ratio in the filed window.
Was Amazon's record FY2025 net income driven by operations?
Only partly. Pretax income rose $28.70 Billion, of which Operating Income contributed $11.38 Billion and Total Non-Operating Income contributed $17.32 Billion, roughly 60% of the increase.
Is Amazon still free cash flow positive?
Yes, at the annual level. FY2025 Free Cash Flow was $7.70 Billion, operating cash flow of $139.51 Billion less capital expenditure of $131.82 Billion. That is down from $32.88 Billion in FY2024.
How do I track capital efficiency on my own holdings?
Set Return on Invested Capital beside operating margin across five or more years for the same company. When margin rises while ROIC falls, the capital base is growing faster than the profit it produces, and the reason will be sitting in capital expenditure or acquisitions on the cash flow statement.
Amazon's most recent annual filing is a Form 10-K filed February 6, 2026, covering the fiscal year ended December 31, 2025 (FY2025).
Wall Street's data. Main Street's price.
Institutional terminals charge thousands a year for as-filed accuracy. GeminIQ gives you the same thing for a fraction of the cost: financials built directly from raw SEC EDGAR filings, not third-party APIs, with full XBRL traceability back to the original 10-K or 10-Q. No normalized guesswork, just calculated metrics, charts, screeners, and watchlists built on numbers exactly as the company reported them. Start researching now at GeminIQ.com.
All financial figures cited in this article reference Amazon.com, Inc.'s FY2025 10-K (filed February 6, 2026, period ending December 31, 2025). All SEC filings are publicly available at SEC EDGAR.
Disclaimer: The content in this blog is for educational and entertainment purposes only and does not constitute financial, legal, or tax advice. Investing involves risk, including the loss of principal. The views expressed are my own and not intended as financial advice or a guarantee of future performance.