How to Read a 13F Filing: Institutional Holdings Explained
By Chad Hartman
Published June 21, 2026 · Last updated June 21, 2026
A Form 13F filing tells you what an institutional investment manager held in U.S. equities as of the last day of a calendar quarter — nothing more, nothing less. Financial media treats every 13F season like a live leak from inside a hedge fund, but the filing itself is a structured document with eight specific columns, three required components, and several disclosure gaps that most "13F tracker" headlines never mention. This guide walks through the form field by field: who has to file it, what each column in the Information Table actually means, where the data's blind spots are, and how to separate a real conviction signal from a reporting artifact.
Table of Contents
- What Form 13F Is and Who Has to File It
- The Three Parts of a 13F Filing
- The Information Table: Reading Each Column
- Investment Discretion and the Other Managers Field
- 13F vs. Schedule 13D and 13G: A Common Point of Confusion
- What a 13F Filing Doesn't Tell You
- How to Track Institutional Ownership Without Reading Every 13F Manually
What Form 13F Is and Who Has to File It
Form 13F-HR is a quarterly report required under Section 13(f) of the Securities Exchange Act of 1934. Any institutional investment manager who exercises investment discretion over $100 million or more in Section 13(f) securities — the SEC's official list of roughly 17,500 qualifying stocks, ETFs, and certain equity options — must file. The SEC tests the threshold as of the last trading day of any month during the calendar year, not just the quarter-end. Cross it once, and the filing obligation continues for that quarter plus the following three, even if the manager's assets drop back below $100 million in the meantime.
The population of filers is broader than "hedge funds." It includes registered investment advisers, mutual fund companies, bank trust departments, insurance company investment divisions, pension fund managers, and broker-dealers exercising discretion. The SEC estimates more than 5,000 institutions file a 13F every quarter, ranging from managers with a handful of positions to those reporting tens of thousands of line items.
The filing is due within 45 days after each calendar quarter ends. For 2026, that puts the deadlines at February 17 (Q4 2025 positions), May 15 (Q1), August 14 (Q2), and November 16 (Q3). There are no extensions — the SEC does not grant them. A manager that fails to file, or files late, faces possible enforcement action and penalties that can reach $750,000.
Not every 13F is a Holdings Report. A manager whose positions are entirely managed by another filer submits a Form 13F-NT — a notice filing confirming it has no holdings of its own to report because another manager is reporting on its behalf. A manager that both holds its own positions and reports on behalf of others files a Combination Report. Knowing which variant you're looking at before reading the data matters: an NT filing with a ticker search will return nothing, by design.
The Three Parts of a 13F Filing
Every Form 13F-HR has three required components, and most of the analytical confusion around 13F data comes from treating the filing as a single document rather than three.
The Cover Page establishes who is filing, for which reporting period, and whether the submission is an original or an amended filing (13F-HR/A). It also discloses whether the manager has requested confidential treatment for any positions — a detail that matters more than it sounds like it should, covered below.
The Summary Page condenses the entire filing into two numbers: the total count of Information Table entries and the aggregate market value of everything reported. If the manager is filing jointly with other managers, the Summary Page also lists every "Other Included Manager" covered by the same submission.
The Information Table is where the actual position-level data lives, and it's the part every 13F tracker is really built around. Each row represents one security held at quarter-end, broken into eight required columns.
The Information Table: Reading Each Column
Column 1 (Name of Issuer) and Column 2 (Title of Class) identify the security and the specific class — common stock, a preferred series, an ETF unit. Reasonable abbreviations are permitted, which is why the same company can appear with slightly different naming across different managers' filings.
Column 3 (CUSIP Number) is the nine-digit identifier for the security. Managers may optionally add a twelve-character Financial Instrument Global Identifier (FIGI) alongside it, though CUSIP remains the primary lookup field.
More readers misread Column 4 (Value) than any other field in the table. It reports the market value of the position in thousands of dollars — a row showing "275" means $275,000, not $275. Aggregators that fail to apply this scaling, or that round it inconsistently across filers, produce position-size comparisons that are off by three orders of magnitude. This is a basic data-hygiene check worth running on any 13F source before trusting its totals.
Column 5 (Amount and Type of Security) reports the total share count or principal amount, tagged "SH" for shares or "PRN" for principal amount. If the holding is an option, the column also carries a "PUT" or "CALL" designation — one of the only places in the form where directional positioning shows up explicitly.
Column 6 (Investment Discretion) and Column 7 (Other Managers) establish who actually controls the decision behind the position — covered in detail in the next section, since this is where the signal quality of a 13F filing is decided.
Column 8 (Voting Authority) splits the share count into Sole, Shared, and None — how much control the manager has over how those shares are voted, independent of who made the investment decision. A large "None" figure typically indicates the shares are held through a structure — a sub-advisory mandate, a model portfolio — where voting rights sit with someone else entirely.
Investment Discretion and the Other Managers Field
Column 6 only accepts three values: SOLE, DFND, or OTR. The distinction between them determines whether a position represents one manager's independent conviction or a shared decision spread across a reporting structure.
SOLE means the filing manager alone made the investment decision — no other entity shares discretion over that position. This is the cleanest signal in the entire form. When a manager reports a large SOLE position, the conviction behind it belongs entirely to that manager.
DFND applies when discretion over a position is shared with another manager who is also a filer included in the same Form 13F submission — typically a parent firm and a subsidiary, or multiple entities under common control filing jointly. OTR applies when discretion is shared with a manager or person outside the current filing group entirely. Both codes require the filer to identify the other party in Column 7 (Other Managers), cross-referenced by a number tied to the Summary Page's list of Other Included Managers.
The practical implication: a position marked DFND or OTR is not solely attributable to the headline filer. A position tagged "BlackRock — DFND" might represent a single index fund's mechanical allocation, not an active portfolio manager's bet. Standard 13F aggregators report the headline manager and the share count and stop there. Pulling the raw Information Table is the only way to see whether a position is a SOLE conviction call or a shared mandate spread across a reporting group — a distinction that changes what the filing actually tells you about institutional sentiment.
13F vs. Schedule 13D and 13G: A Common Point of Confusion
Financial media reports "a fund just disclosed a stake" the same way regardless of which filing triggered it, but Form 13F and Schedules 13D/13G are answering completely different questions. Crossing 5% beneficial ownership in a single company triggers Schedule 13D or 13G — filed by any investor, institutional or individual, the moment that specific threshold is crossed for that specific issuer. A 13D signals the investor may seek to influence the company; a 13G signals a passive stake.
Form 13F has nothing to do with the 5% threshold. It's an aggregate quarterly snapshot of every qualifying equity position a manager holds, regardless of whether any single position represents 5% of that company's shares or 0.005%. A manager with $50 billion spread across 4,000 small positions files a 13F. A manager with one concentrated 6% stake in a single small-cap files a 13D — and may also separately need to file a 13F if its total assets clear the $100 million threshold. For the full breakdown of how 13D, 13G, and the rest of the SEC's disclosure regime fit together, see Complete Guide to SEC Filing Types for Investors. The two filings can overlap for the same manager, but they answer entirely different questions and exist for entirely different reasons.
What a 13F Filing Doesn't Tell You
The gap between what a 13F shows and what financial media implies it shows is where most of the misreading happens. Form 13F never discloses short positions, and it never nets them against the long positions a manager reports. A manager showing a large long stake in a name could simultaneously be running an offsetting short elsewhere in the same portfolio — invisible, by design, in every 13F that manager files.
The 45-day reporting lag means every 13F is a snapshot of a position that's already six-plus weeks old by the time it's public. A manager could have closed the entire position the day after quarter-end, and the filing reporting it as a large holding would still be technically accurate the day it's released.
Confidential treatment requests let a manager petition the SEC to temporarily withhold specific positions from public disclosure — typically while the manager is still accumulating a stake and doesn't want to signal its own buying pressure into the market. Those positions appear later, once treatment is denied or expires, often well after the rest of that quarter's filing is public.
The Information Table only contains what's on the official Section 13(f) securities list. Non-convertible bonds, cash, real estate, private placements, and most over-the-counter derivatives never appear — a manager's full balance sheet exposure is always larger than what its 13F shows. And the form reports shares and market value at quarter-end only. No cost basis, no entry price, no realized gain. A 13F tells you what a manager holds. It does not tell you whether that manager is up or down on the position, or by how much.
How to Track Institutional Ownership Without Reading Every 13F Manually
None of that diminishes the value of tracking 13F data systematically — it just means systematic tracking has to account for the lag and the gaps rather than treating any single filing as gospel. More than 5,000 managers file every quarter, and a single large fund's Information Table alone can run to thousands of rows. Reconstructing a single stock's institutional ownership trend — who's accumulating, who's trimming, how the aggregate percentage held by institutions has moved over the last two years — means cross-referencing the Information Table of every manager that holds the stock, every quarter, by hand.
The analytical value compounds the same way it does with insider transaction data. A single quarter's 13F tells you almost nothing on its own — it can't distinguish a manager that's been steadily building a position for two years from one that opened it last week. Only the trend across multiple quarters separates genuine accumulation from a data point that happens to look interesting in isolation, and assembling that trend manually from individual filings is impractical at any meaningful scale.
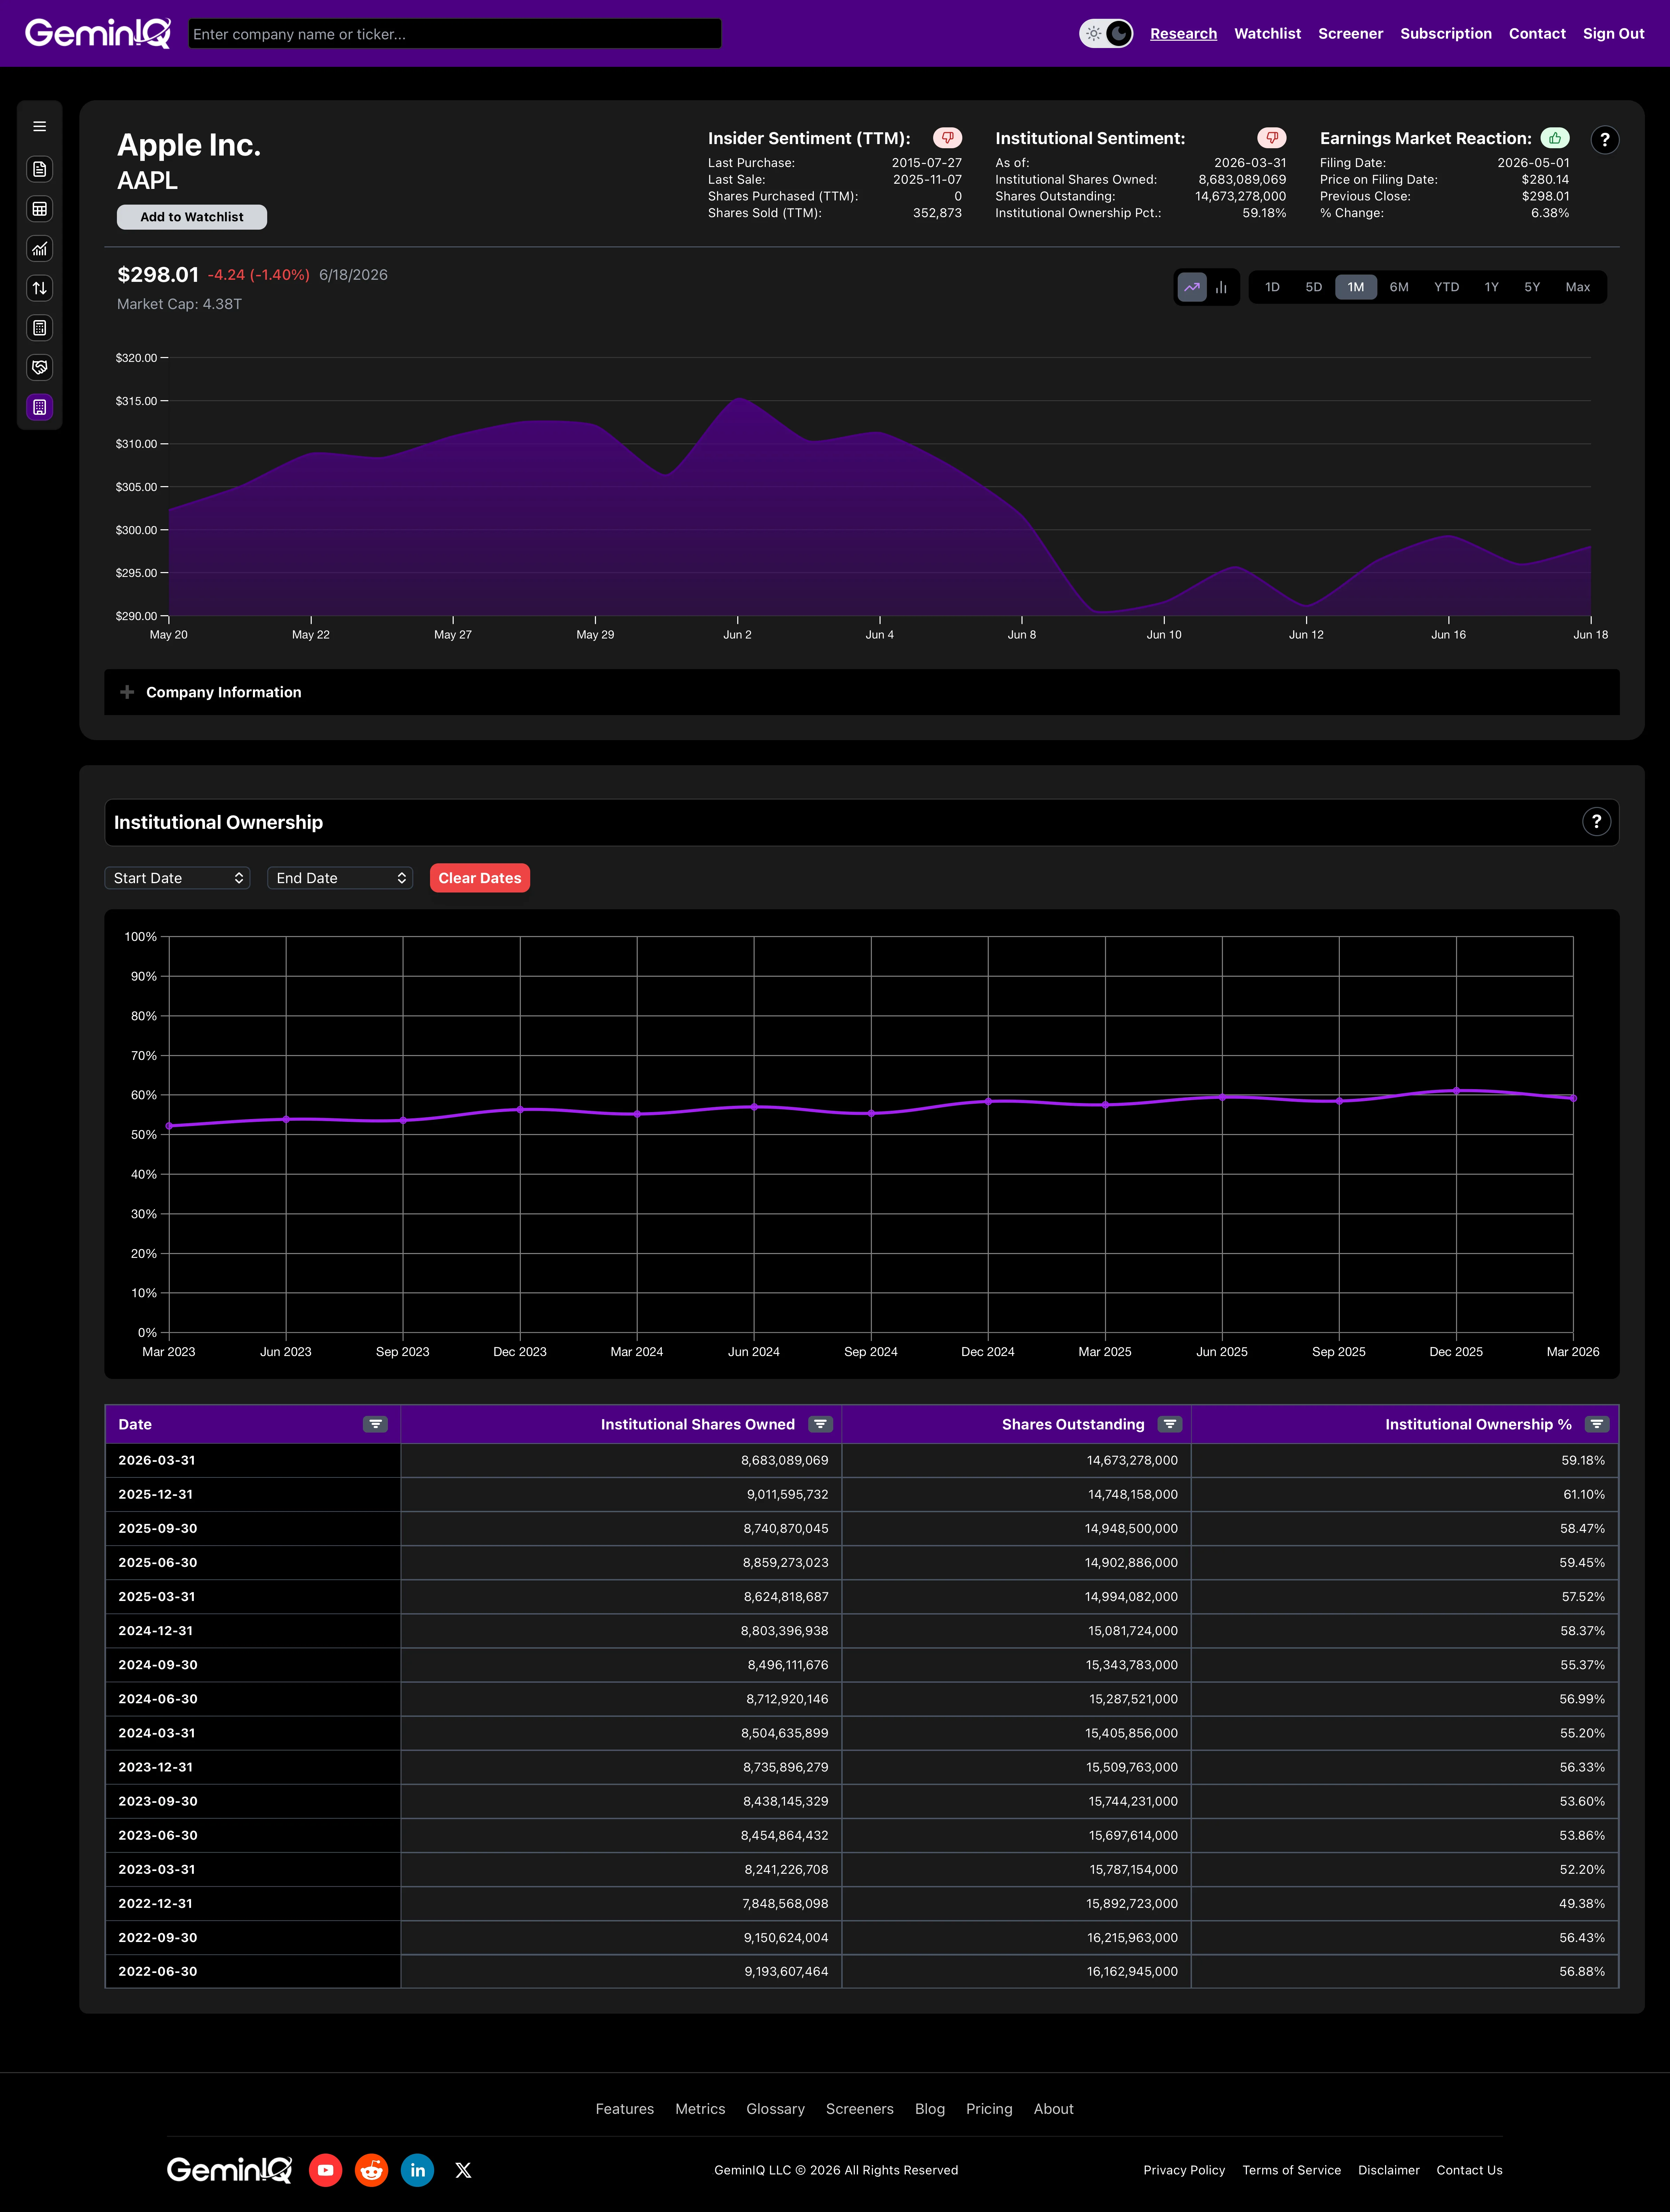
GeminIQ's Institutional Ownership feature aggregates the raw Form 13F data across every quarter automatically, tracking institutional ownership as a percentage of shares outstanding over time — so a multi-year accumulation or distribution trend that would otherwise require manually compiling thousands of individual filings becomes visible immediately. Because the data is sourced directly from the SEC filings rather than a third-party aggregator, the underlying percentage reflects the actual reported positions, not a smoothed or estimated figure. The trend is only as trustworthy as the filings it's built from. For a closer look at how institutional ownership trends interact with other filing signals — insider transactions, balance sheet shifts, post-filing price reactions — see Hidden Information in SEC Filings: What Most Investors Overlook.
Related Reading
Form 13F is one piece of a broader disclosure system. For the rest of the picture:
- Complete Guide to SEC Filing Types for Investors — covers 10-K, 10-Q, 8-K, DEF 14A, S-1, Form 4, and 13D/13G in a single reference.
- How to Read SEC Form 4: Insider Buying and Selling Explained — the companion filing that shows what insiders, rather than institutions, are doing with their own capital.
- Hidden Information in SEC Filings: What Most Investors Overlook — how institutional ownership trends combine with insider activity and balance sheet shifts for a complete picture.
Research Faster. Invest Smarter.
Most financial websites rely on third-party aggregators that simplify or process data before you ever see it. We built GeminIQ because we believe you deserve a better fundamental analysis tool—one that goes beyond basic price charts and processed numbers. We extract our data directly from SEC 10-K and 10-Q filings to ensure that when you look at a balance sheet or a cash flow statement, you are seeing the numbers exactly how the company reported them. Our goal is to give you the tools to verify the narrative for yourself using clean, traceable data. Start researching now at GeminIQ.com.
Disclaimer: The content in this blog is for educational and entertainment purposes only and does not constitute financial, legal, or tax advice. Investing involves risk, including the loss of principal. The views expressed are my own and not intended as financial advice or a guarantee of future performance.