
Amazon Q1 2026 10-Q: Free Cash Flow Just Went Negative

By Chad Hartman
Published · Last updated
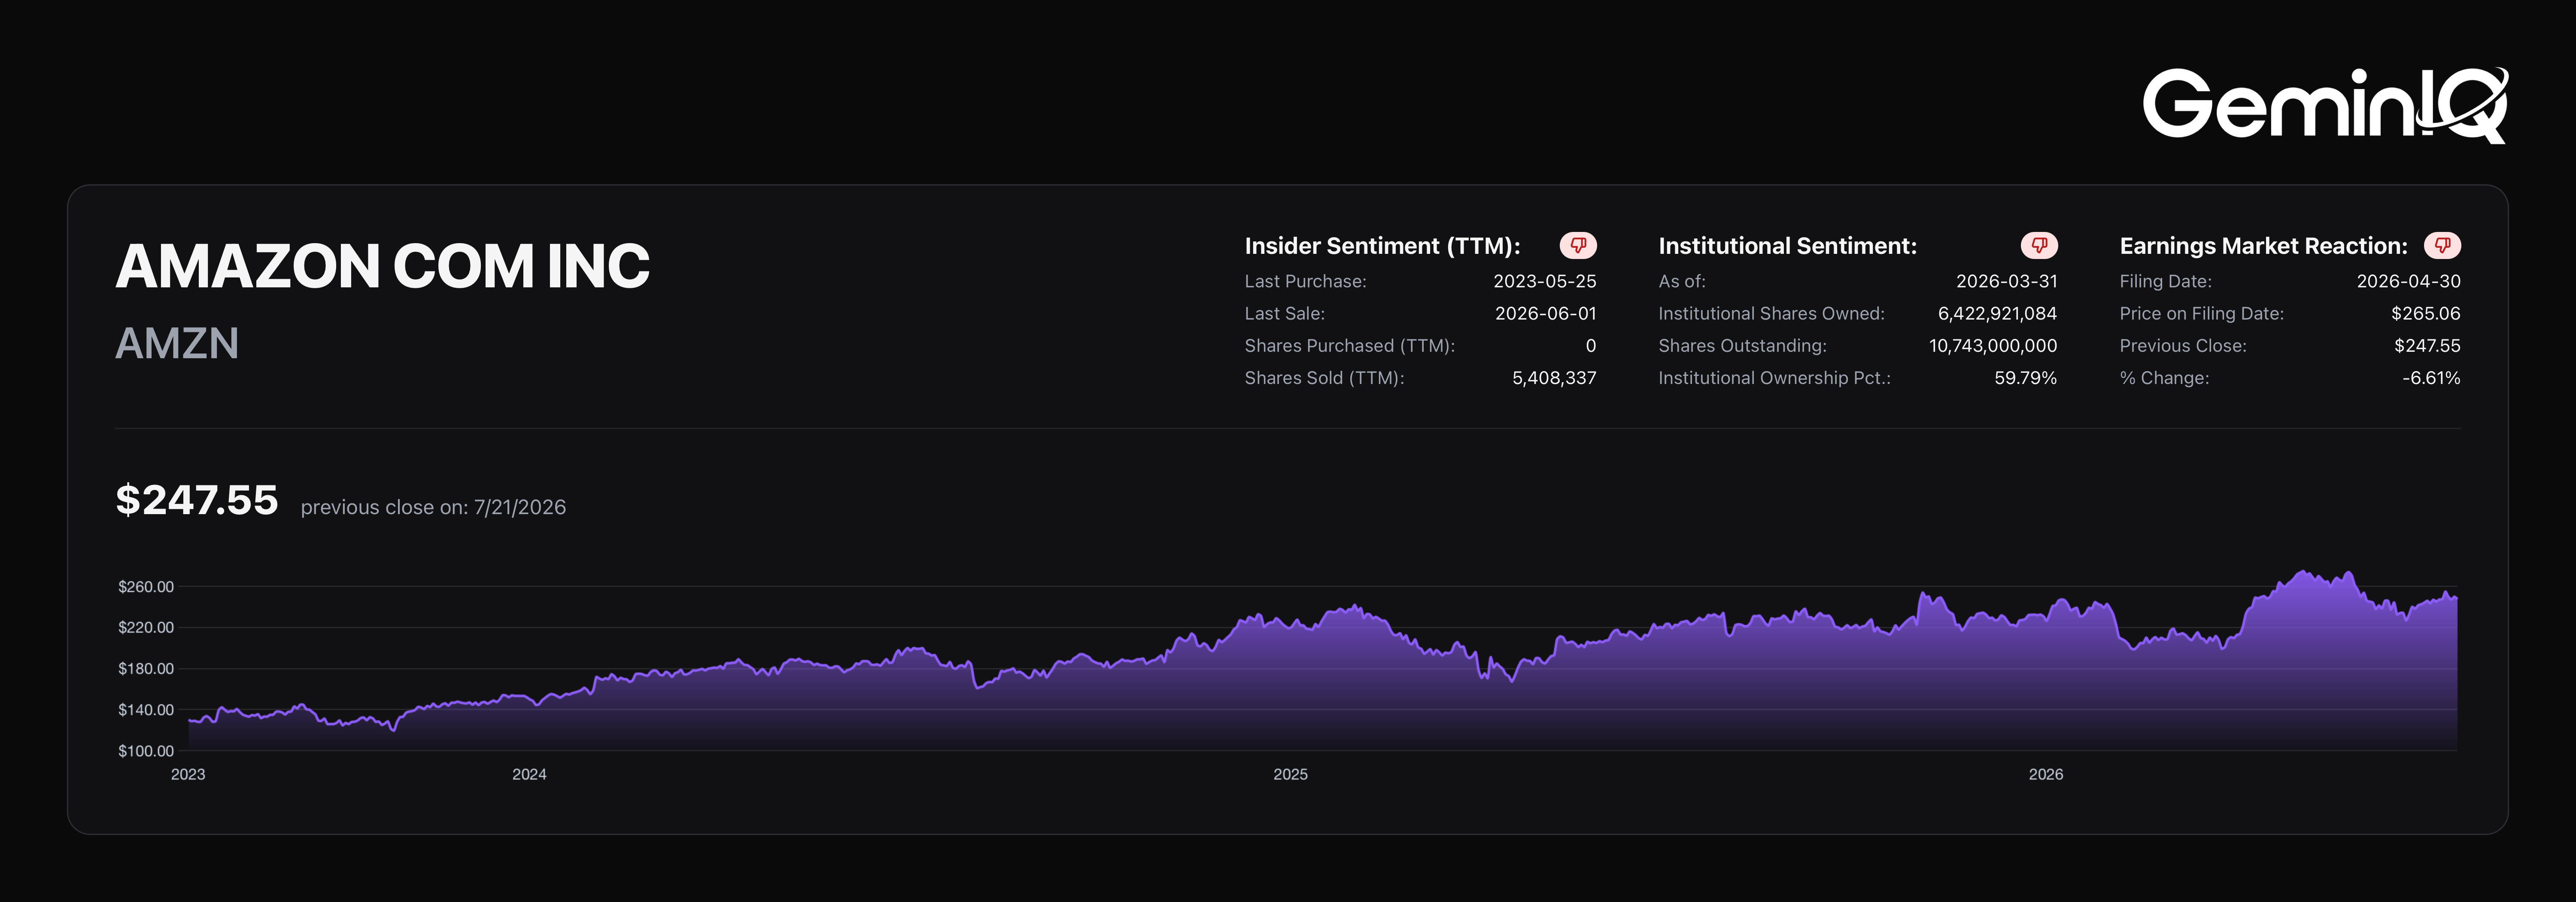
Amazon ($AMZN) just dropped its Q1 FY2026 10-Q (filed April 30, 2026). Most coverage is still fixated on whether AWS growth justifies the multiple. The raw cash flow statement shows something more dramatic happening beneath that debate: trailing twelve-month free cash flow just went negative, for a company famous for generating enormous cash. It isn't a warning sign. It's the clearest evidence yet of how much Amazon is spending to build AI infrastructure.
| Field | Value |
|---|---|
| Ticker | $AMZN |
| Filing | Q1 FY2026 10-Q |
| Filed | April 30, 2026 |
| Period End | March 31, 2026 |
| Free Cash Flow (TTM) | -$2.47 Billion |
| CapEx (TTM) | $151.0 Billion |
The CapEx Supercycle
Free cash flow going negative sounds like distress. For Amazon right now, it's the opposite — it's the cost of building capacity fast enough to meet AI and cloud demand.
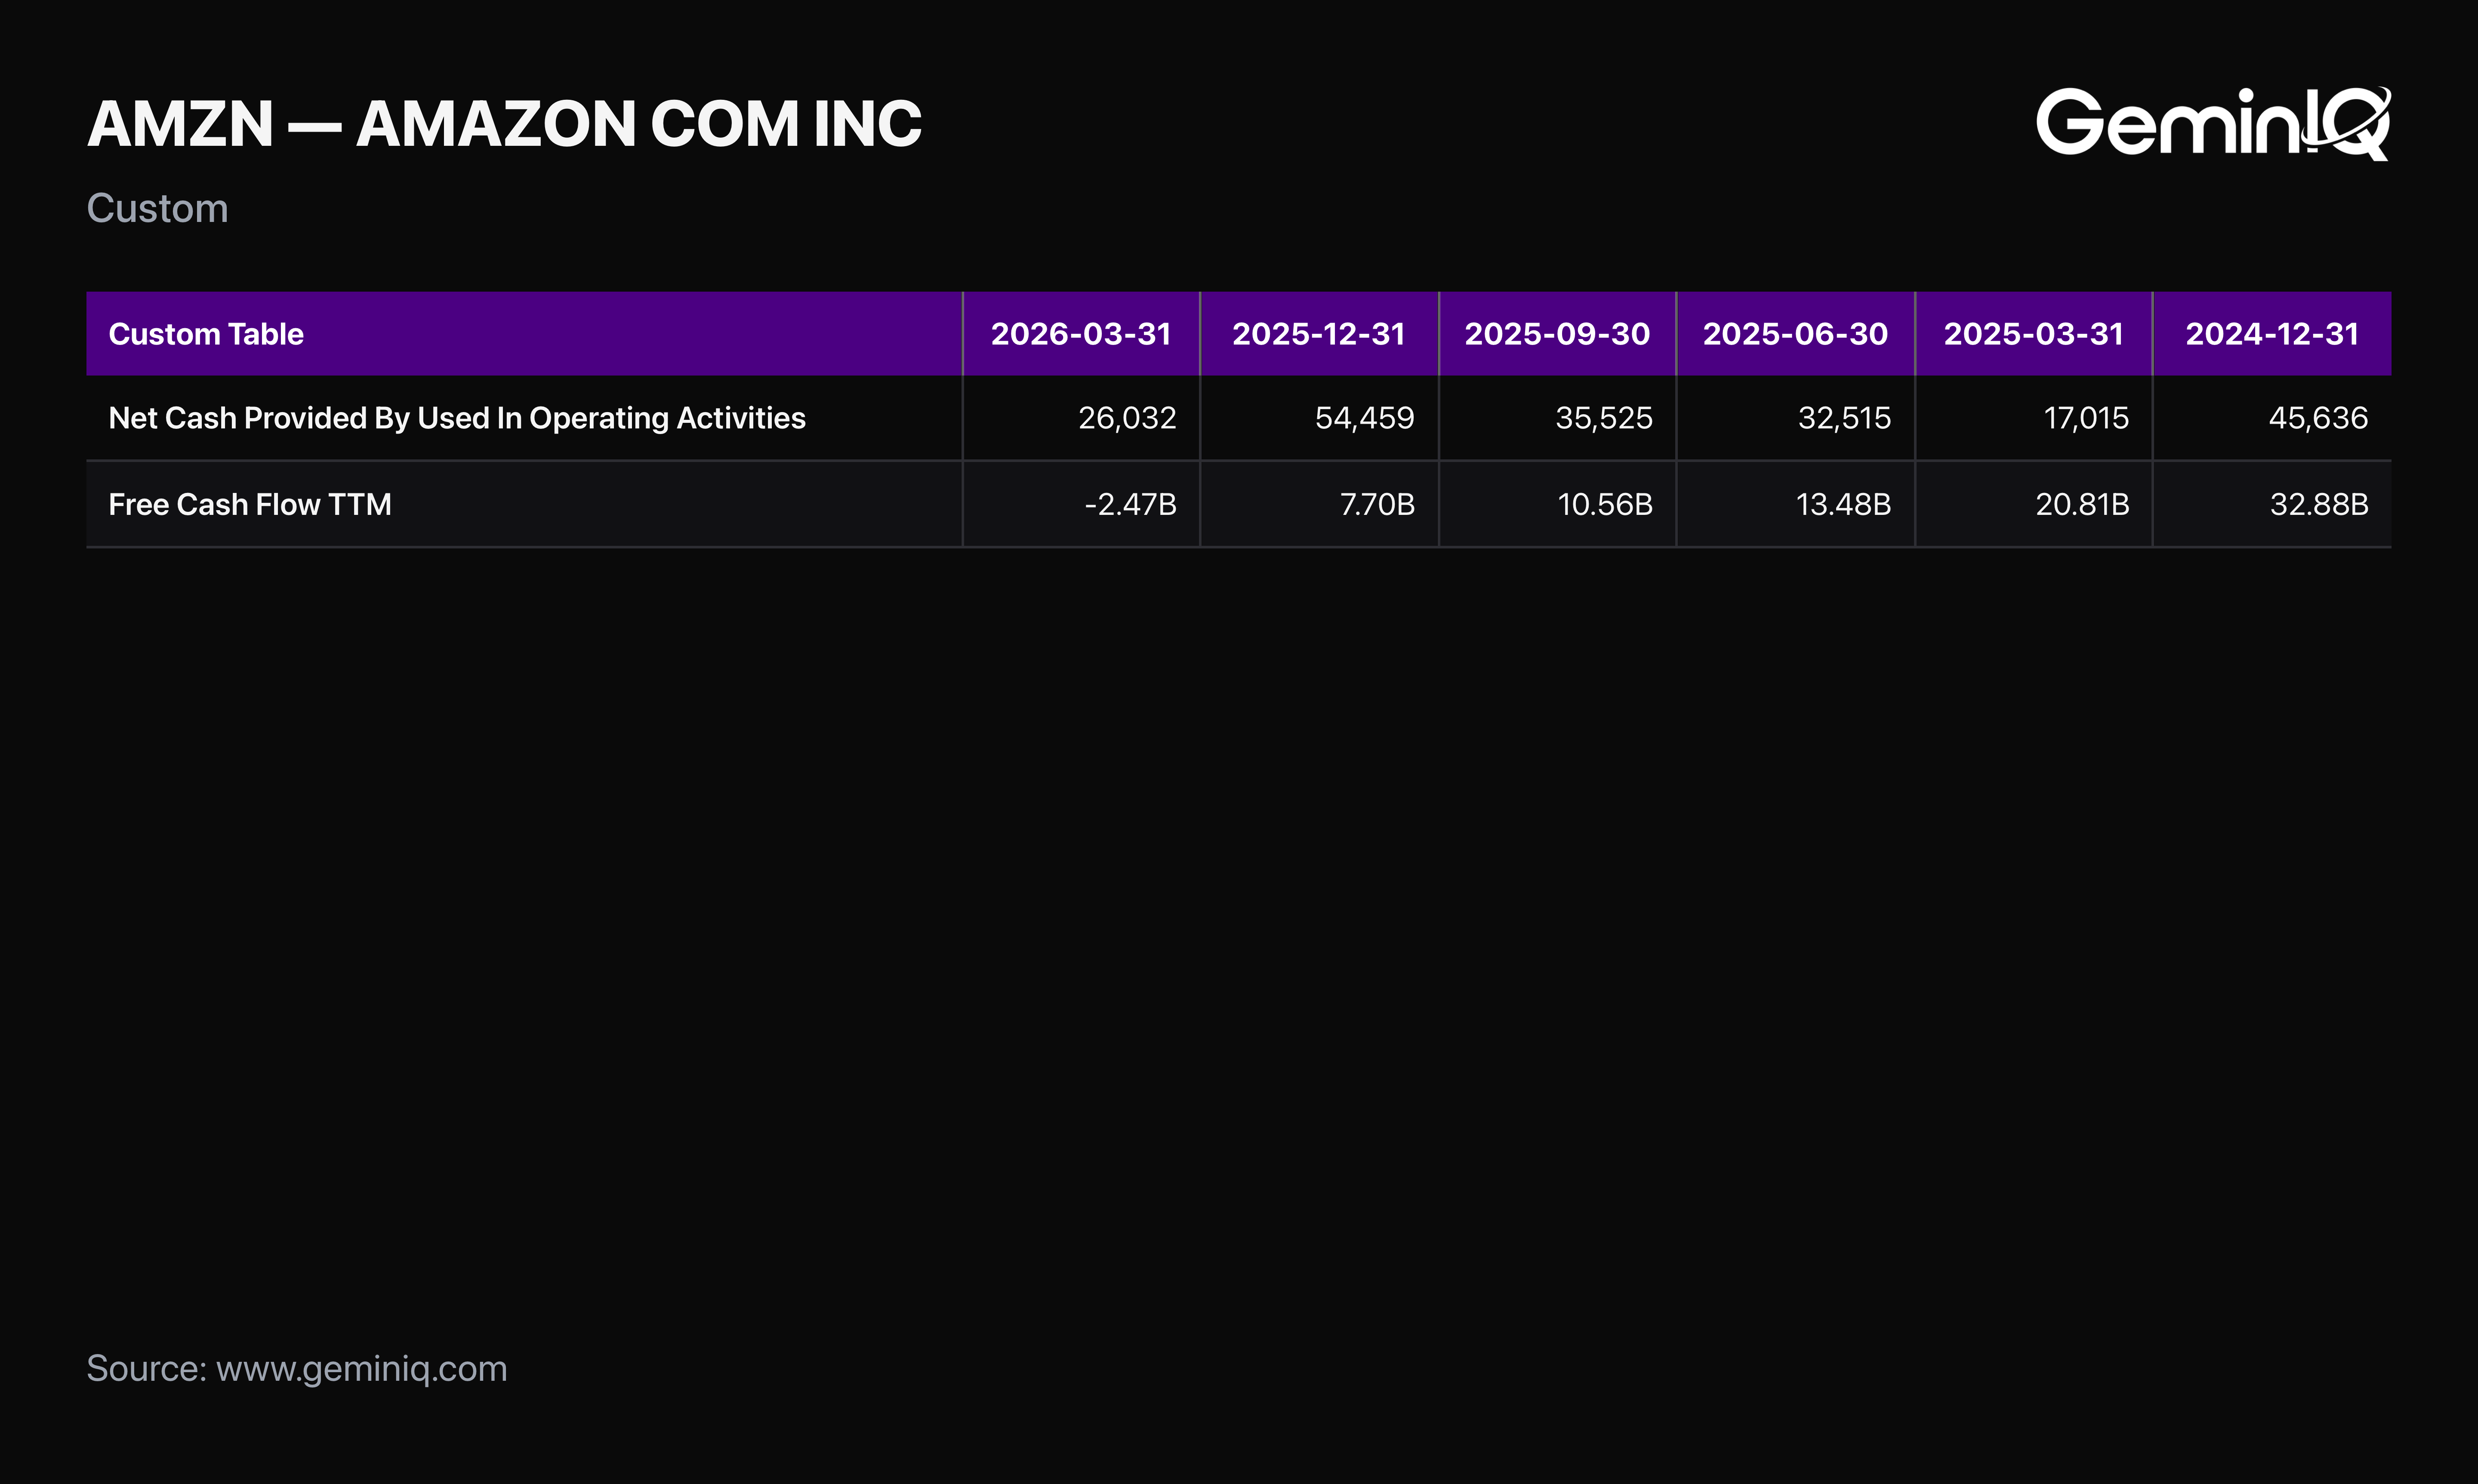
The Data: Amazon's TTM Operating Cash Flow is a robust $148.5 Billion. Against that, TTM CapEx (Purchases of Property and Equipment) hit $151.0 Billion — enough to flip Free Cash Flow to -$2.47 Billion. Quarterly CapEx has nearly tripled in two years, from $14.9 Billion in Q1 2024 to $44.2 Billion this quarter.
The GeminIQ Edge: A headline "operating cash flow" figure from a standard aggregator would still show a healthy $148.5 Billion and stop there. Pulling the raw Financial Statements and netting CapEx against it shows the actual free cash flow story — and confirms the number wasn't manufactured by a one-time write-off or a working-capital swing. It's a straight, multi-quarter capital spending ramp.
The Stock-Based Compensation Reality
The dilution story here isn't new, but it still holds up under a fresh look.
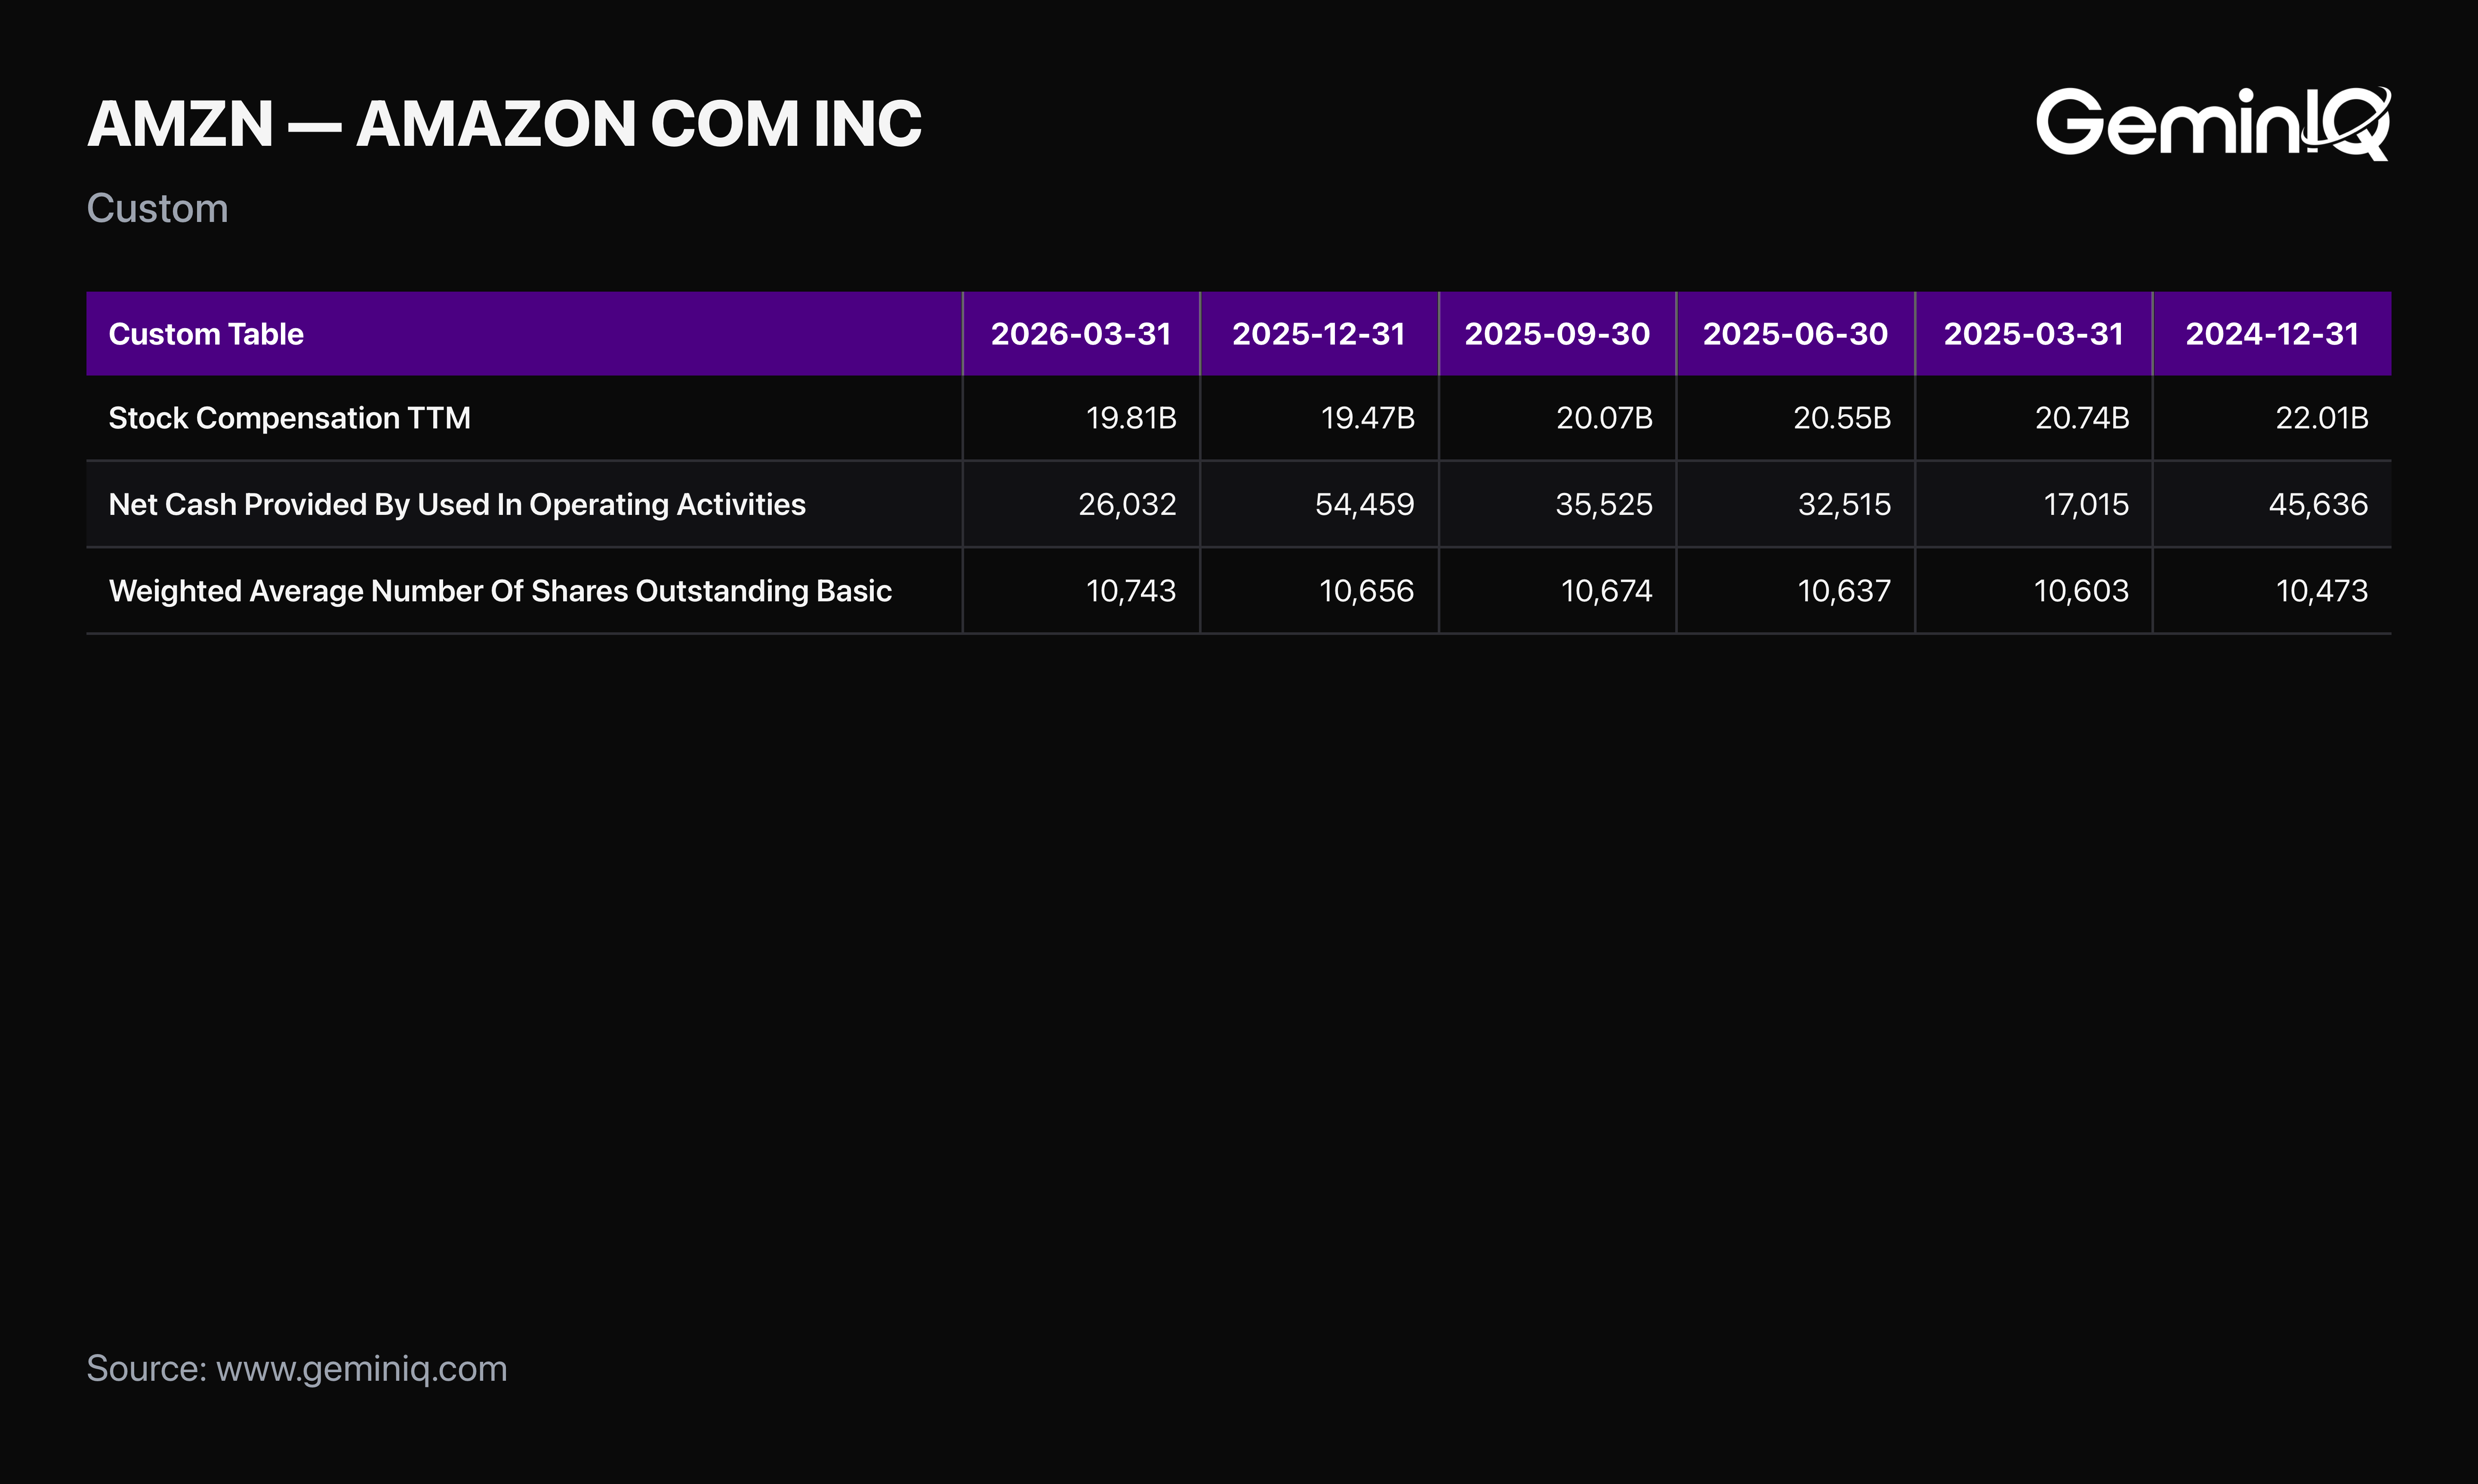
The Data: Amazon's TTM Stock-Based Compensation is $19.81 Billion, roughly 13% of TTM Operating Cash Flow. Basic shares outstanding have grown to 10.74 Billion, continuing a steady climb.
The GeminIQ Edge: GeminIQ's Financial Statements isolates the SBC line directly from the Cash Flow Statement rather than blending it into a single "adjusted" earnings figure, so the actual scale of equity-funded compensation stays visible rather than buried in a non-GAAP add-back.
Verifying the Moat Underneath the Spending
None of the capex or SBC story matters if Amazon's core business is deteriorating to fund it. It isn't.
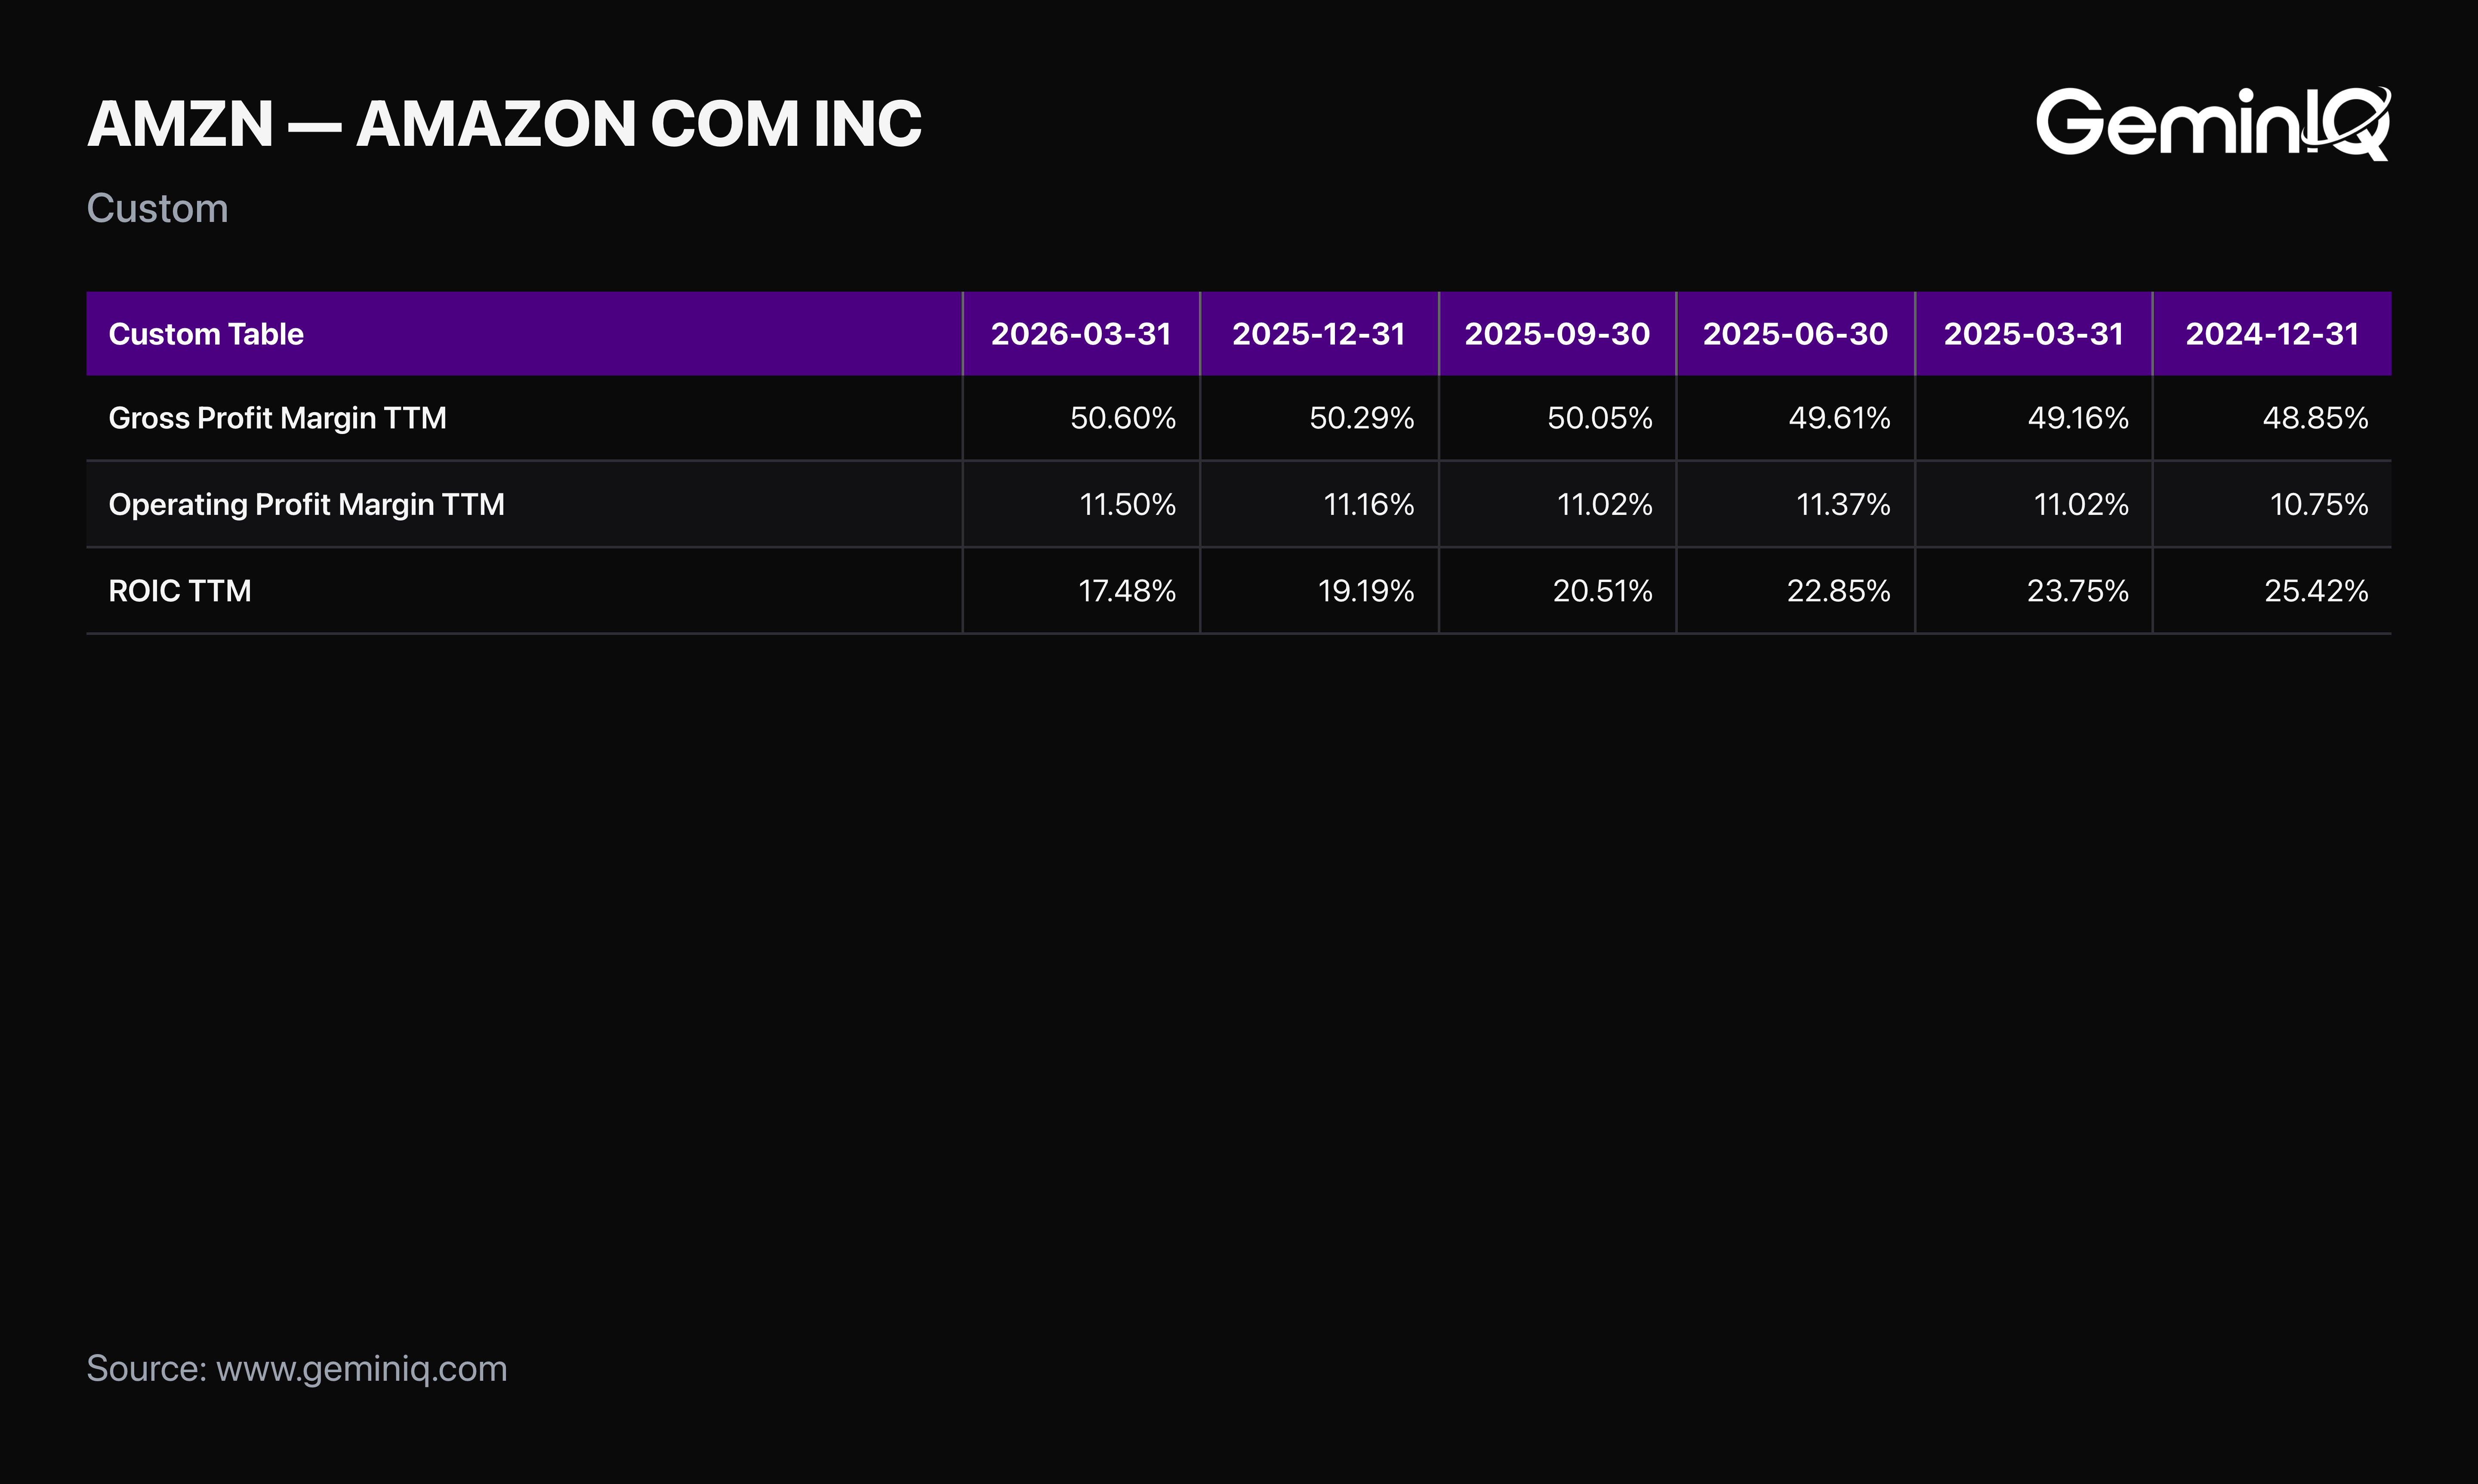
The Data: GeminIQ's pre-calculated Gross Margin (TTM) sits at 50.6%, up from 47.6% two years ago. Operating Margin (TTM) is 11.5%, and ROIC (TTM) is 17.5%.
The GeminIQ Edge: Margin expansion during the heaviest capex ramp in the company's history is the detail a pure cash flow headline misses. Pulling Calculated Metrics alongside the raw cash flow data shows the spending is layered on top of a business getting more profitable, not one straining to stay afloat.
Insiders Selling, Institutions Steady
Two different signals around Amazon worth separating rather than blending into one "smart money" narrative.
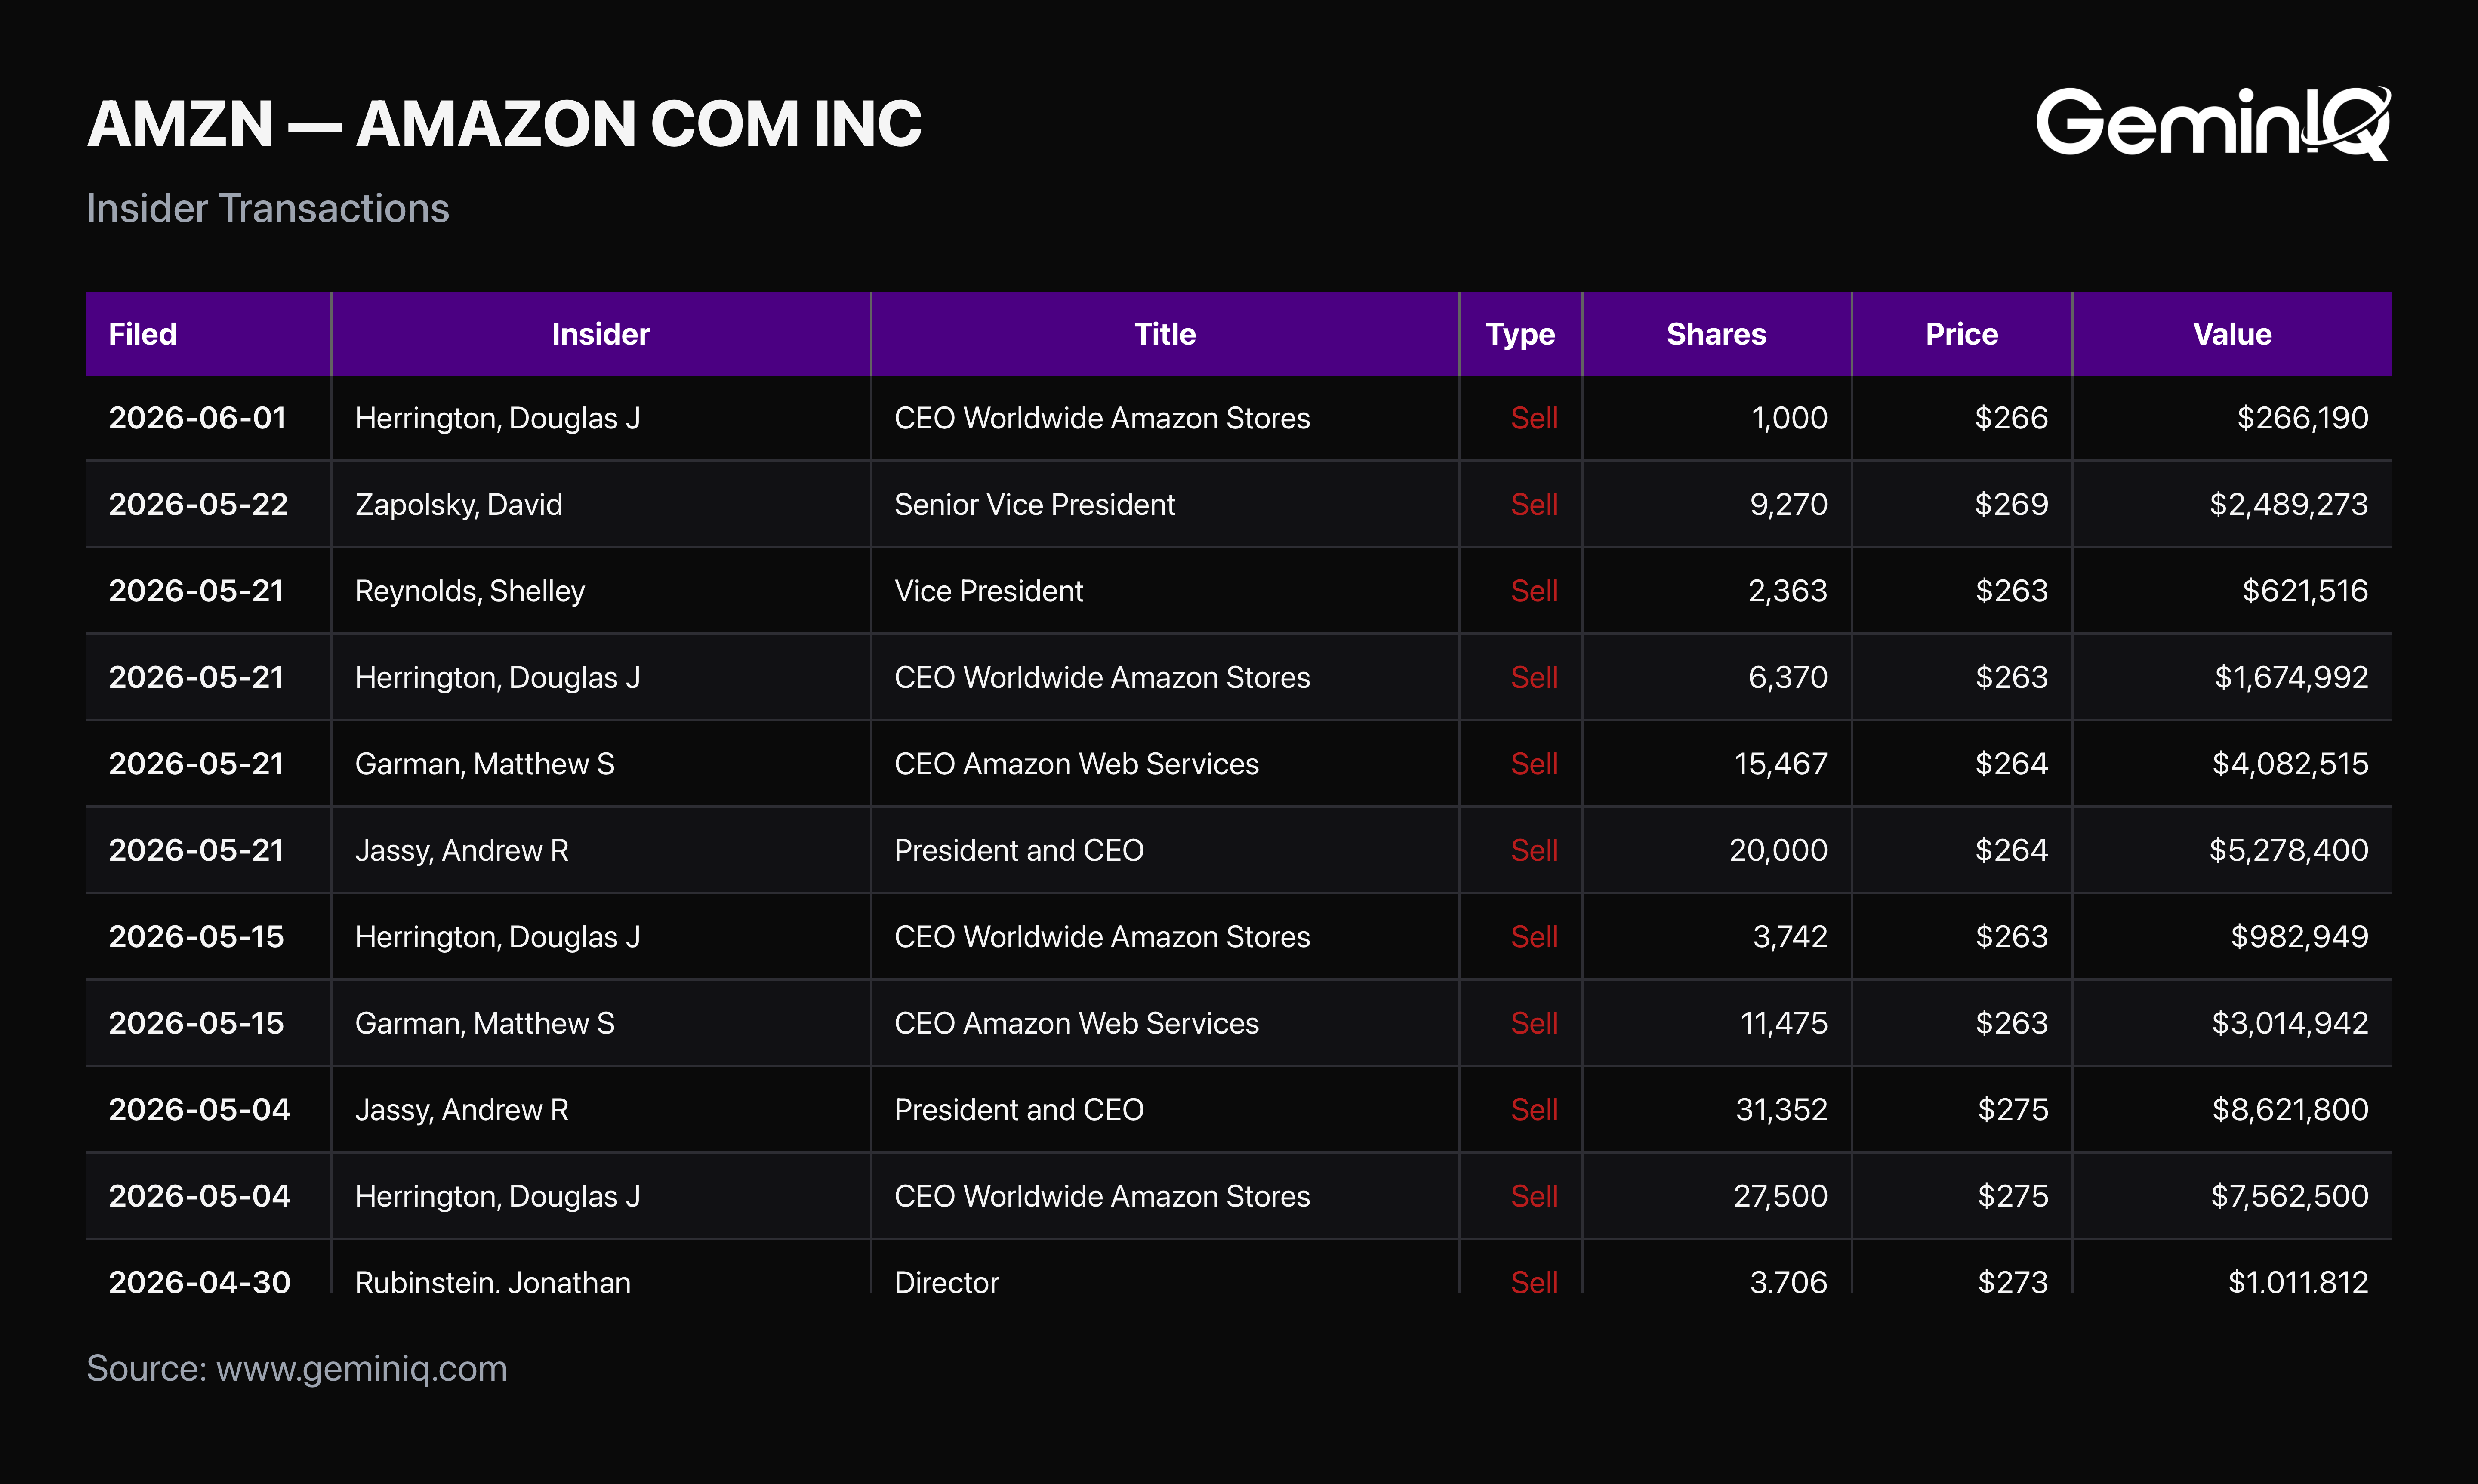
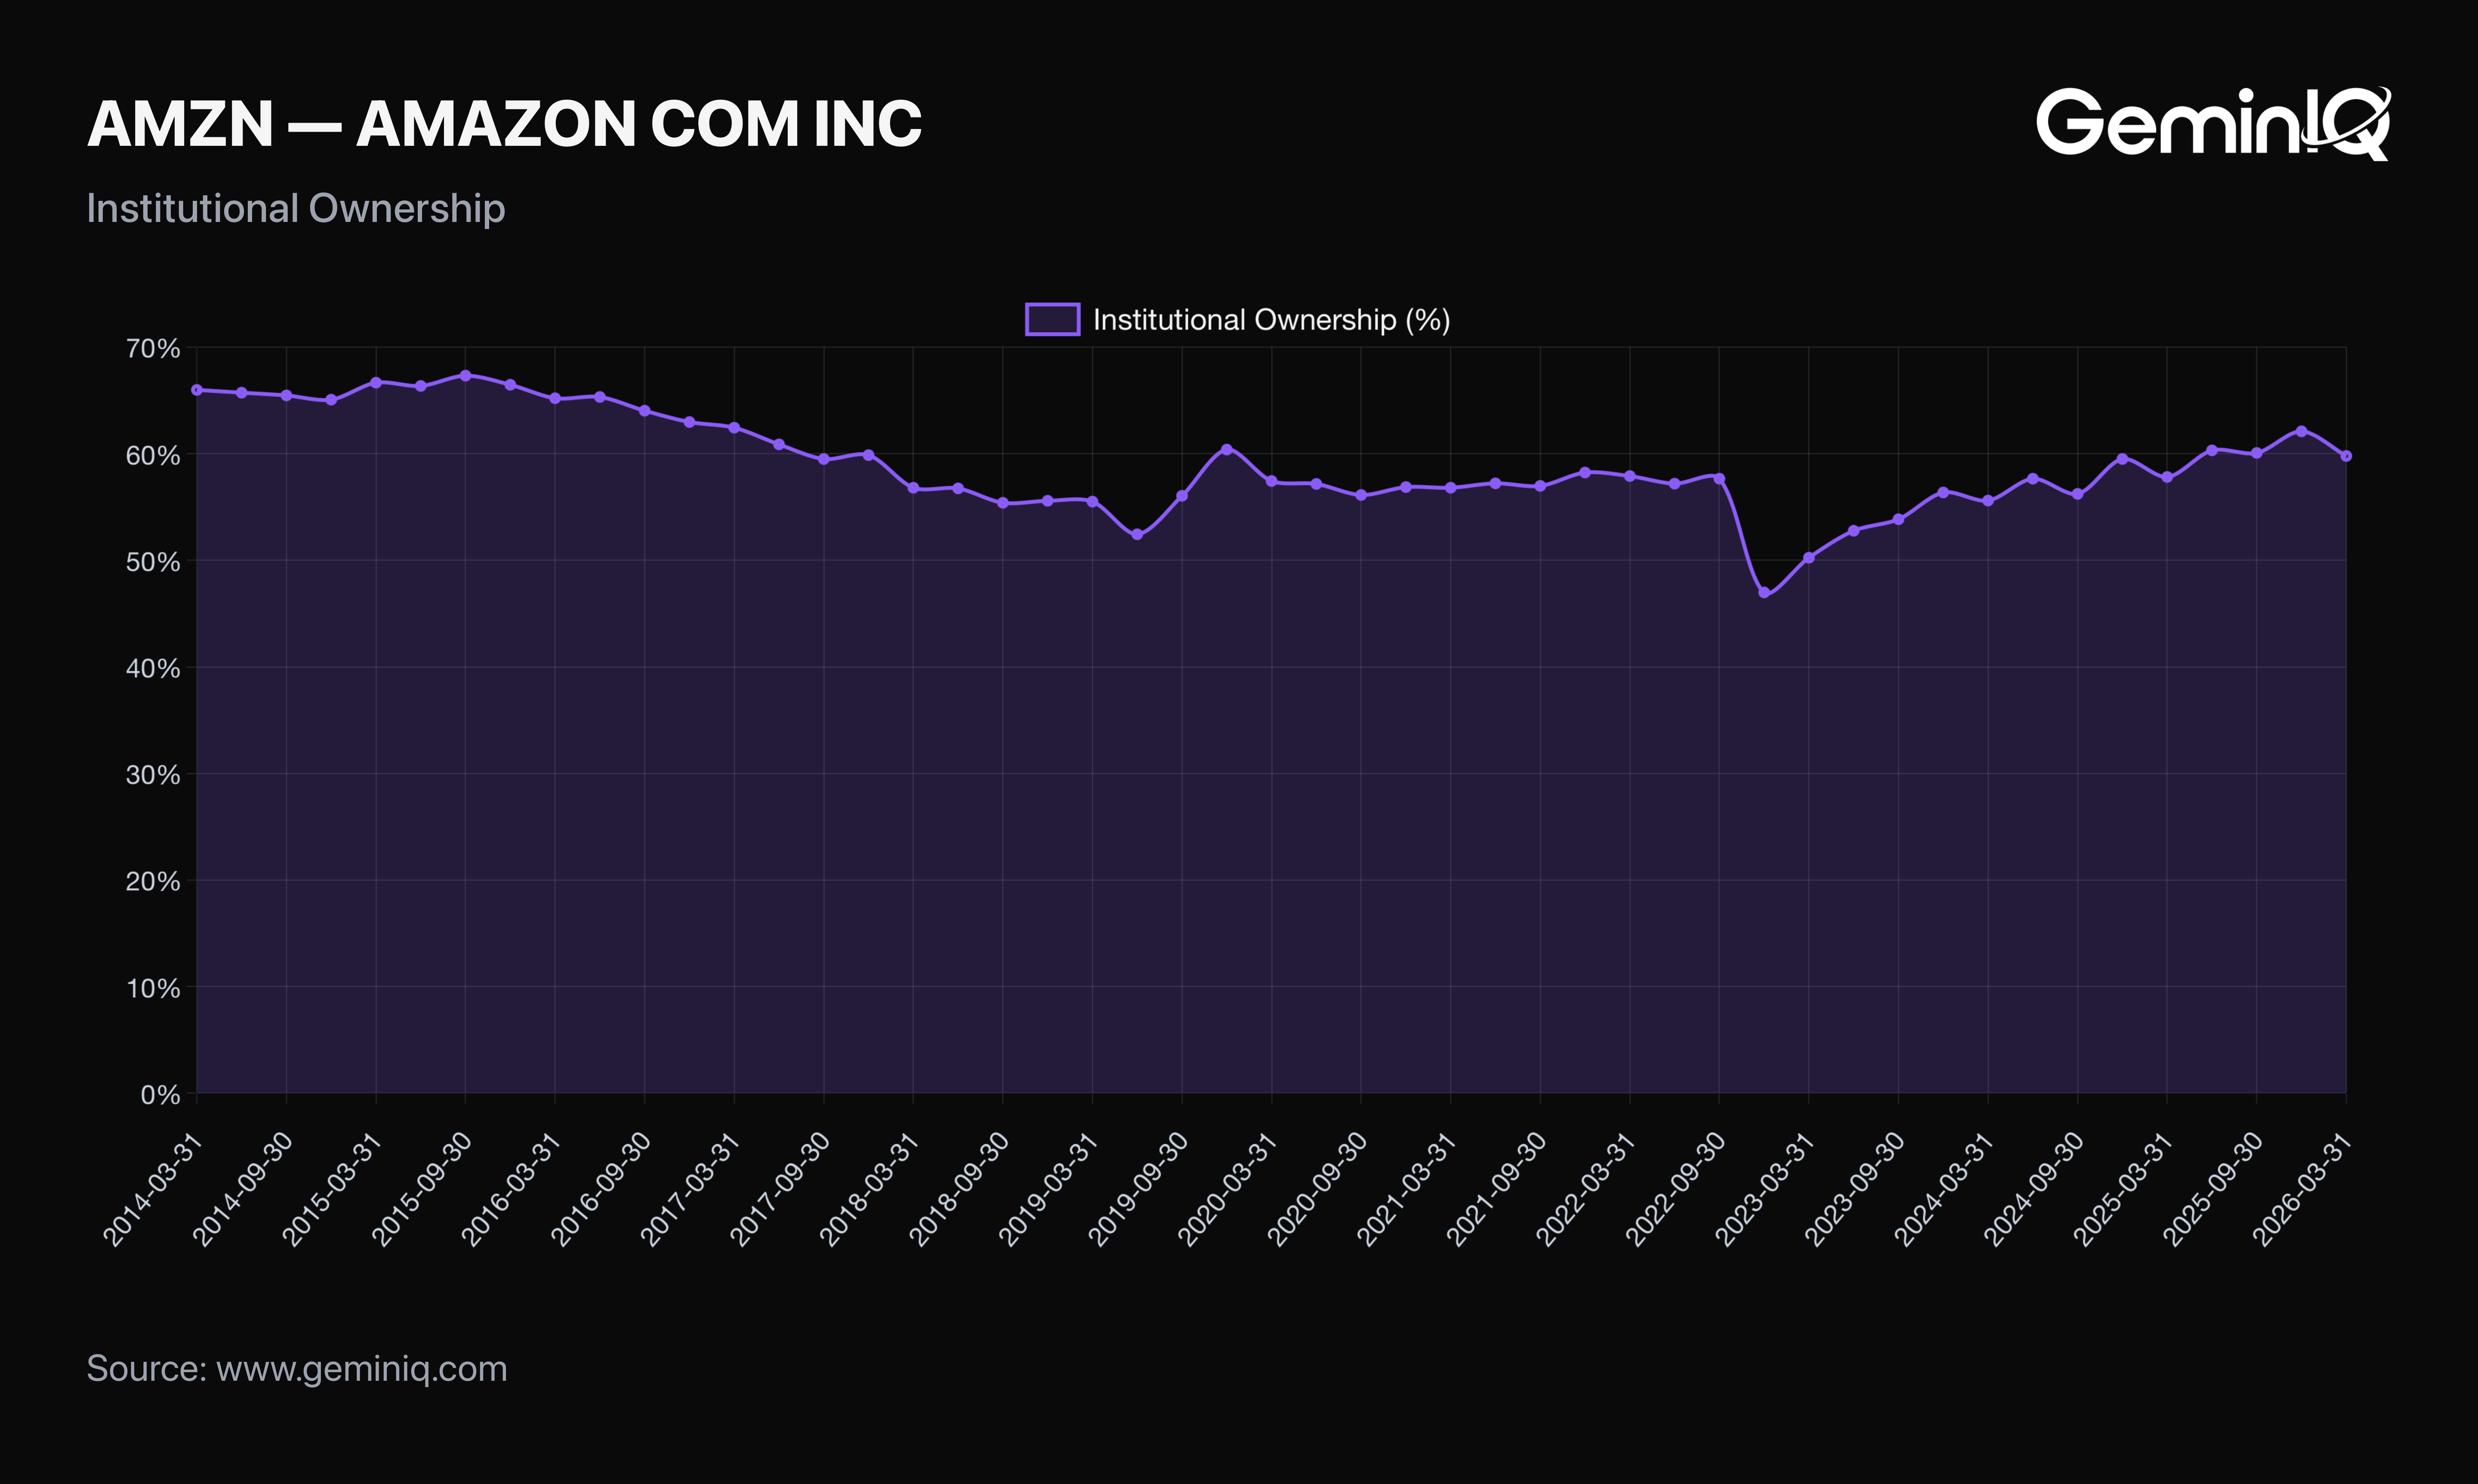
The Data: GeminIQ's Insider Transactions feed shows executive sales dominate the record — CEO Andy Jassy and other senior executives have filed dozens of open-market sales in recent months, consistent with scheduled diversification of large SBC-funded equity stakes rather than a new signal. Institutional Ownership, by contrast, has stayed in a 57.8%-62.1% band over the past year, currently 59.8% — stable, not a story either direction.
The GeminIQ Edge: Treating routine executive share sales as a bearish "smart money" signal overstates what's actually a predictable pattern for any large company compensating employees heavily in stock. Selling shares to diversify a large equity stake isn't a smart-money tell. It's just what happens when a company pays people well in stock.
Frequently Asked Questions
What does GeminIQ's data show about Amazon's free cash flow?
Amazon's TTM Operating Cash Flow of $148.5 Billion is now smaller than its TTM CapEx of $151.0 Billion, producing negative Free Cash Flow of roughly -$2.47 Billion. Quarterly CapEx has nearly tripled over the past two years, from $14.9 Billion to $44.2 Billion.
Is Amazon's negative free cash flow a warning sign?
Based on the filing data, it doesn't appear to be. Gross margin and operating margin have both expanded over the same period the capex ramp occurred, and the negative figure traces entirely to a documented, multi-quarter capital spending increase rather than a one-time charge or declining core profitability.
When did Amazon last file its 10-Q, and what period does it cover?
Amazon's most recent filing is a Form 10-Q filed April 30, 2026, covering the fiscal quarter ended March 31, 2026 (Q1 FY2026).
Where can I verify Amazon's CapEx figures against the original filing?
The figures are drawn directly from Amazon's Q1 FY2026 10-Q cash flow statement, filed with the SEC on April 30, 2026. The full filing is publicly available on SEC EDGAR (linked in the citation block below).
Wall Street's data. Main Street's price.
Institutional terminals charge thousands a year for as-filed accuracy. GeminIQ gives you the same thing for a fraction of the cost: financials built directly from raw SEC EDGAR filings, not third-party APIs, with full XBRL traceability back to the original 10-K or 10-Q. No normalized guesswork, just calculated metrics, charts, screeners, and watchlists built on numbers exactly as the company reported them. Start researching now at GeminIQ.com.
All financial figures cited in this article reference Amazon.com, Inc.'s Q1 FY2026 10-Q (filed April 30, 2026, period ending March 31, 2026). All SEC filings are publicly available at SEC EDGAR.
Disclaimer: The content in this blog is for educational and entertainment purposes only and does not constitute financial, legal, or tax advice. Investing involves risk, including the loss of principal. The views expressed are my own and not intended as financial advice or a guarantee of future performance.