
Arista (ANET) Q3 2026 Earnings: EPS Up 82%, Cash Flow Down 5%

By Chad Hartman
Published · Last updated
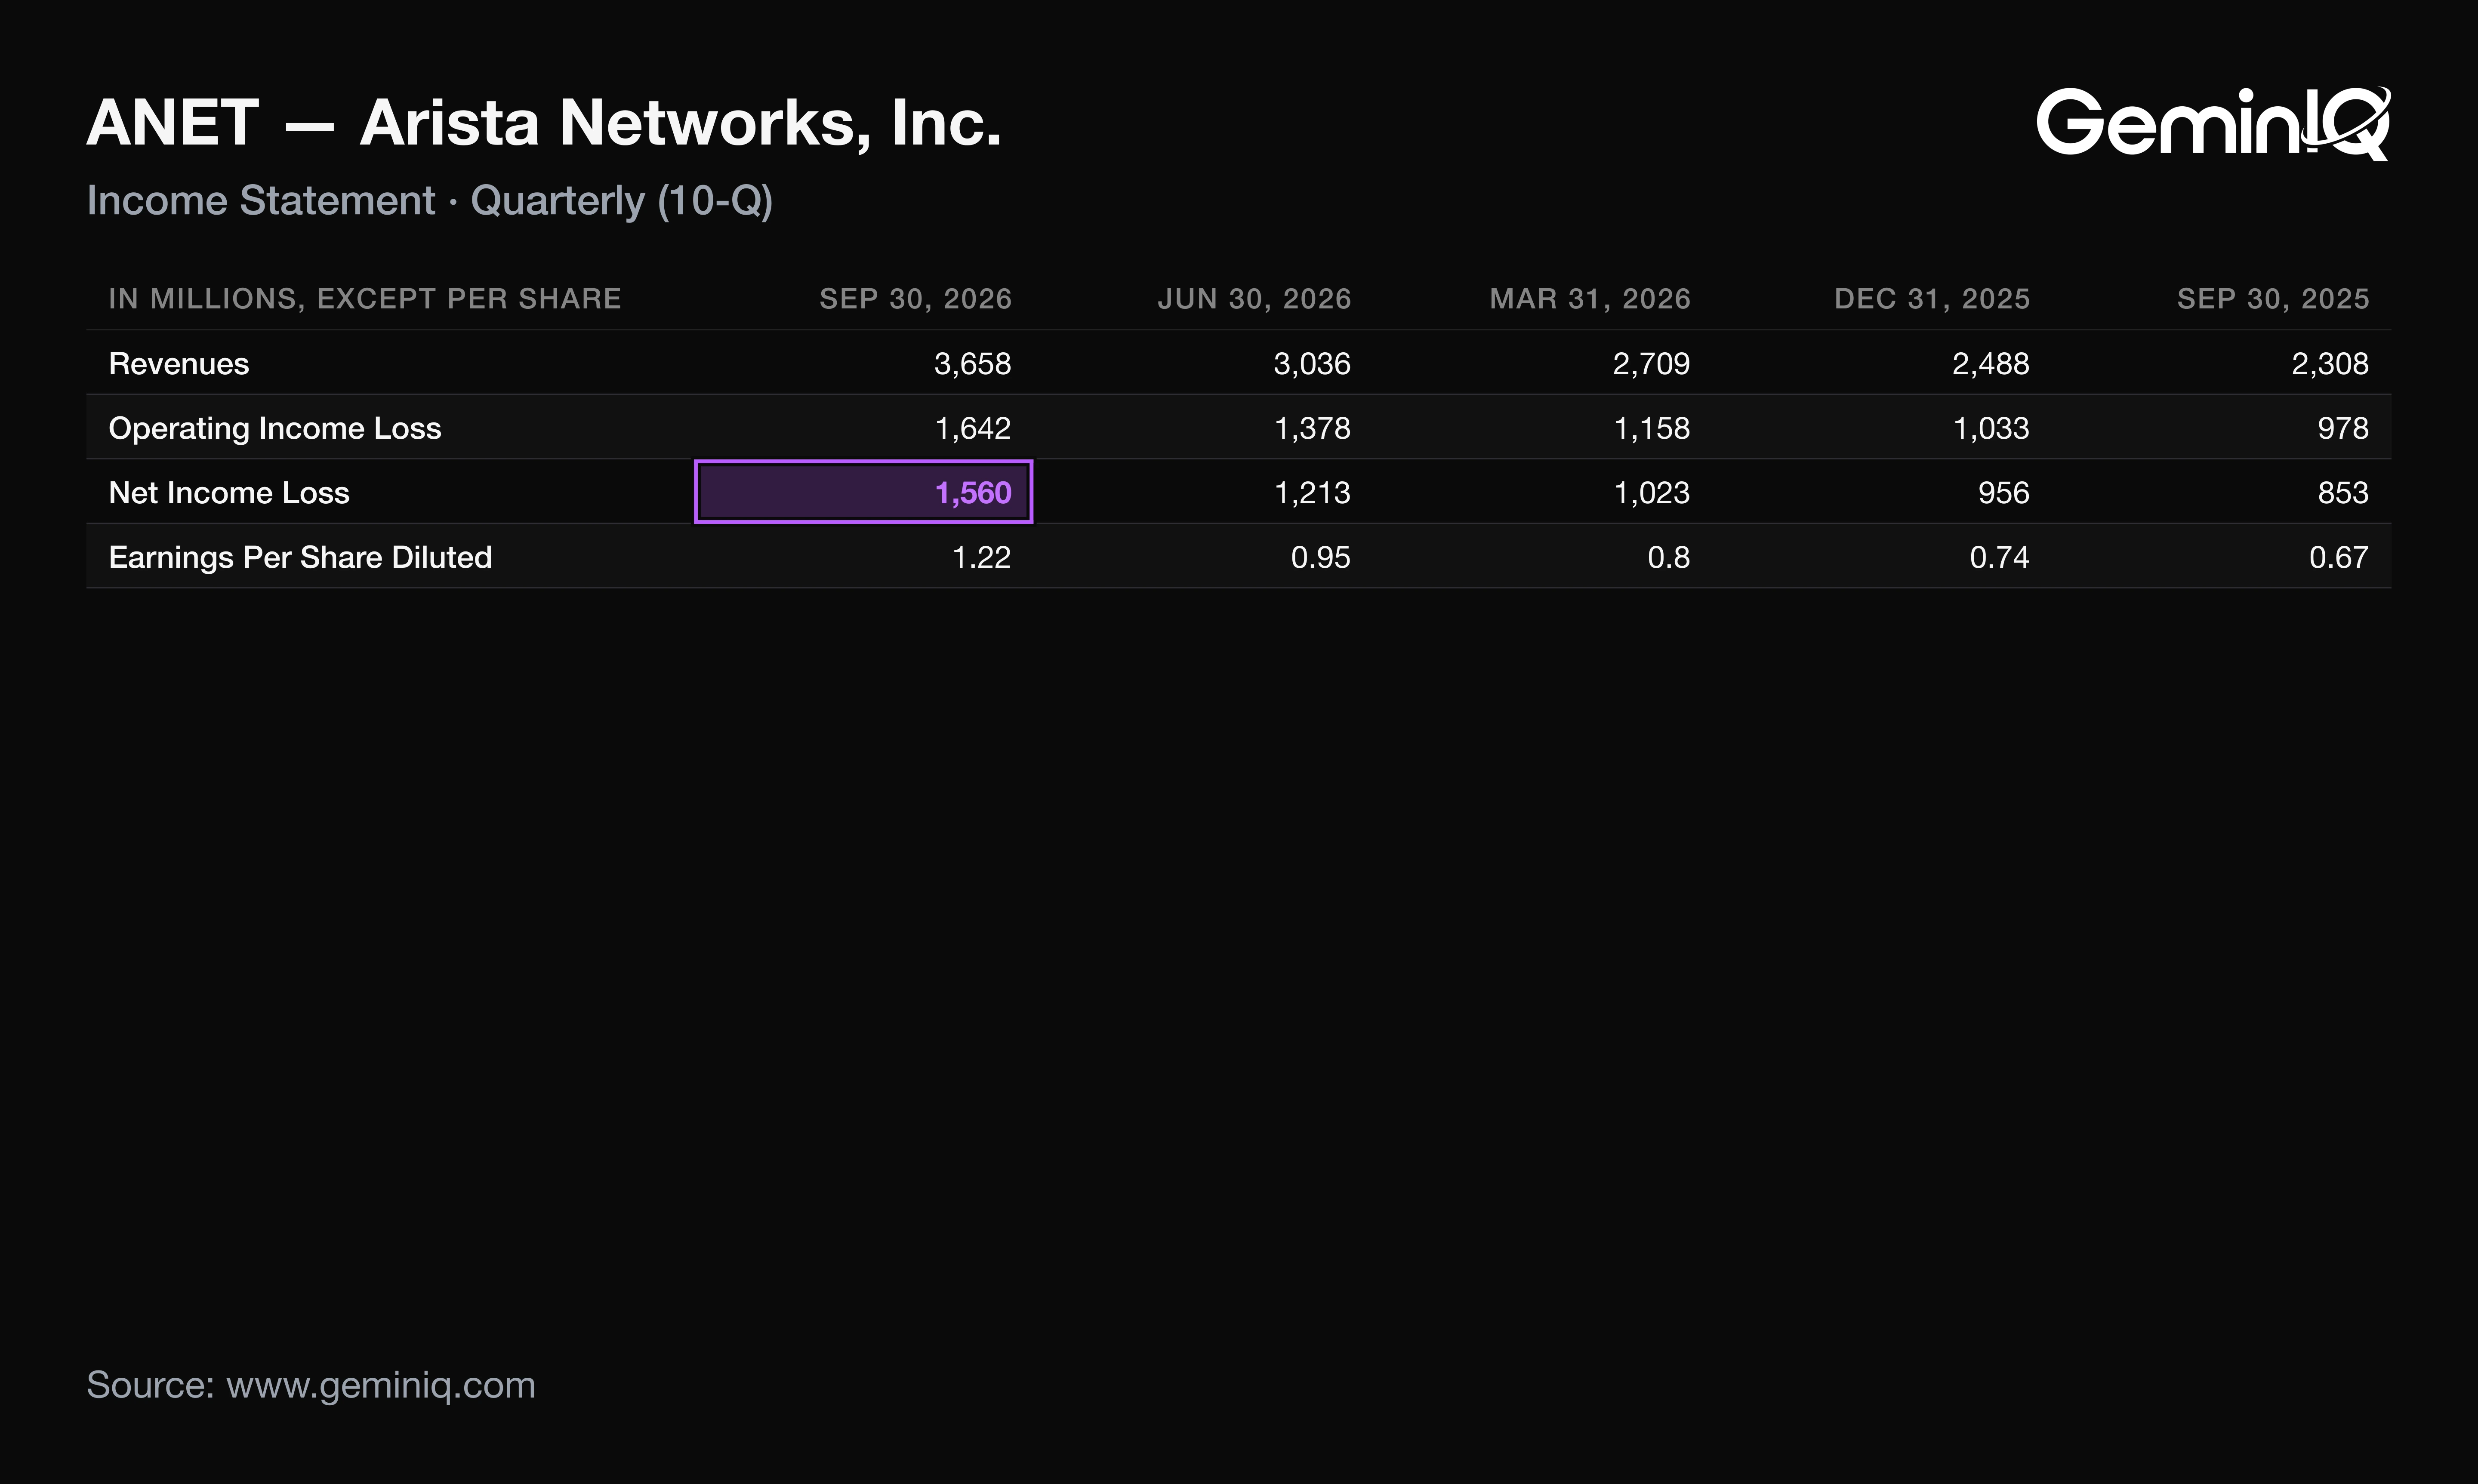
Arista (ANET) reported Q3 FY2026 revenue of $3.66 billion, up 58.5%, and diluted EPS of $1.22, up 82.1%, for the quarter ended September 30, 2026; it released results on November 3 and filed its 10-Q on November 4. Operating cash flow went the other way: $1.20 billion, down 5.3% from a year earlier. Net income grew 82.9% with help from a $135.8 million "Other" income line that was negative a year ago, and the 10-Q shows inventory and deferred costs absorbing the cash.
| Field | Value |
|---|---|
| Company | Arista ($ANET) |
| Quarter | Q3 FY2026, period ended September 30, 2026 |
| Earnings release | November 3, 2026 (Form 8-K) |
| 10-Q filed | November 4, 2026 |
| Revenue | $3.66 Billion (+58.5% YoY) |
| Diluted EPS | $1.22 (+82.1% YoY) |
| Operating margin | 44.9% (+2.5 pts YoY) |
| Operating cash flow (TTM) | $5.24 Billion |
| Operating cash flow (Q3, YoY) | -5.3% |
Arista Q3 2026 Revenue, EPS and Margins
Arista's Q3 2026 revenue was $3.66 billion, up 58.5% from a year earlier and the highest of the last 16 quarters. Diluted EPS rose faster than operating income, and the gap is mostly below the operating line.
The Data: Revenue rose 58.5%. Gross margin fell to 63.6% from 64.6%. Operating margin still rose to 44.9% from 42.4%, the second-highest of the last 16 quarters, because operating expenses grew more slowly than gross profit. Operating income rose 67.9% to $1.64 billion; net income rose 82.9% to $1.56 billion. Diluted shares were 1,278.2 million, up 0.1%, so no buyback shrank the denominator.
Why: Other income, net was $273.1 million against $98.9 million, and the 8-K reconciliation strips $134.5 million of gains on strategic investments out of non-GAAP results. The tax rate was 18.5% against 20.8%, and the year-ago quarter carried a $34.6 million one-time OBBB Act charge. Without the investment gains, and taxing the remainder at 18.5%, diluted EPS would have been about $1.14 (derived), still up roughly 70% from $0.67. The 8-K shows GAAP EPS of $1.22 above non-GAAP EPS of $1.20; a year earlier it was $0.67 against $0.77. About 8 cents of the quarter came from investment marks.
What Arista's Q3 2026 10-Q Shows Beyond the Press Release
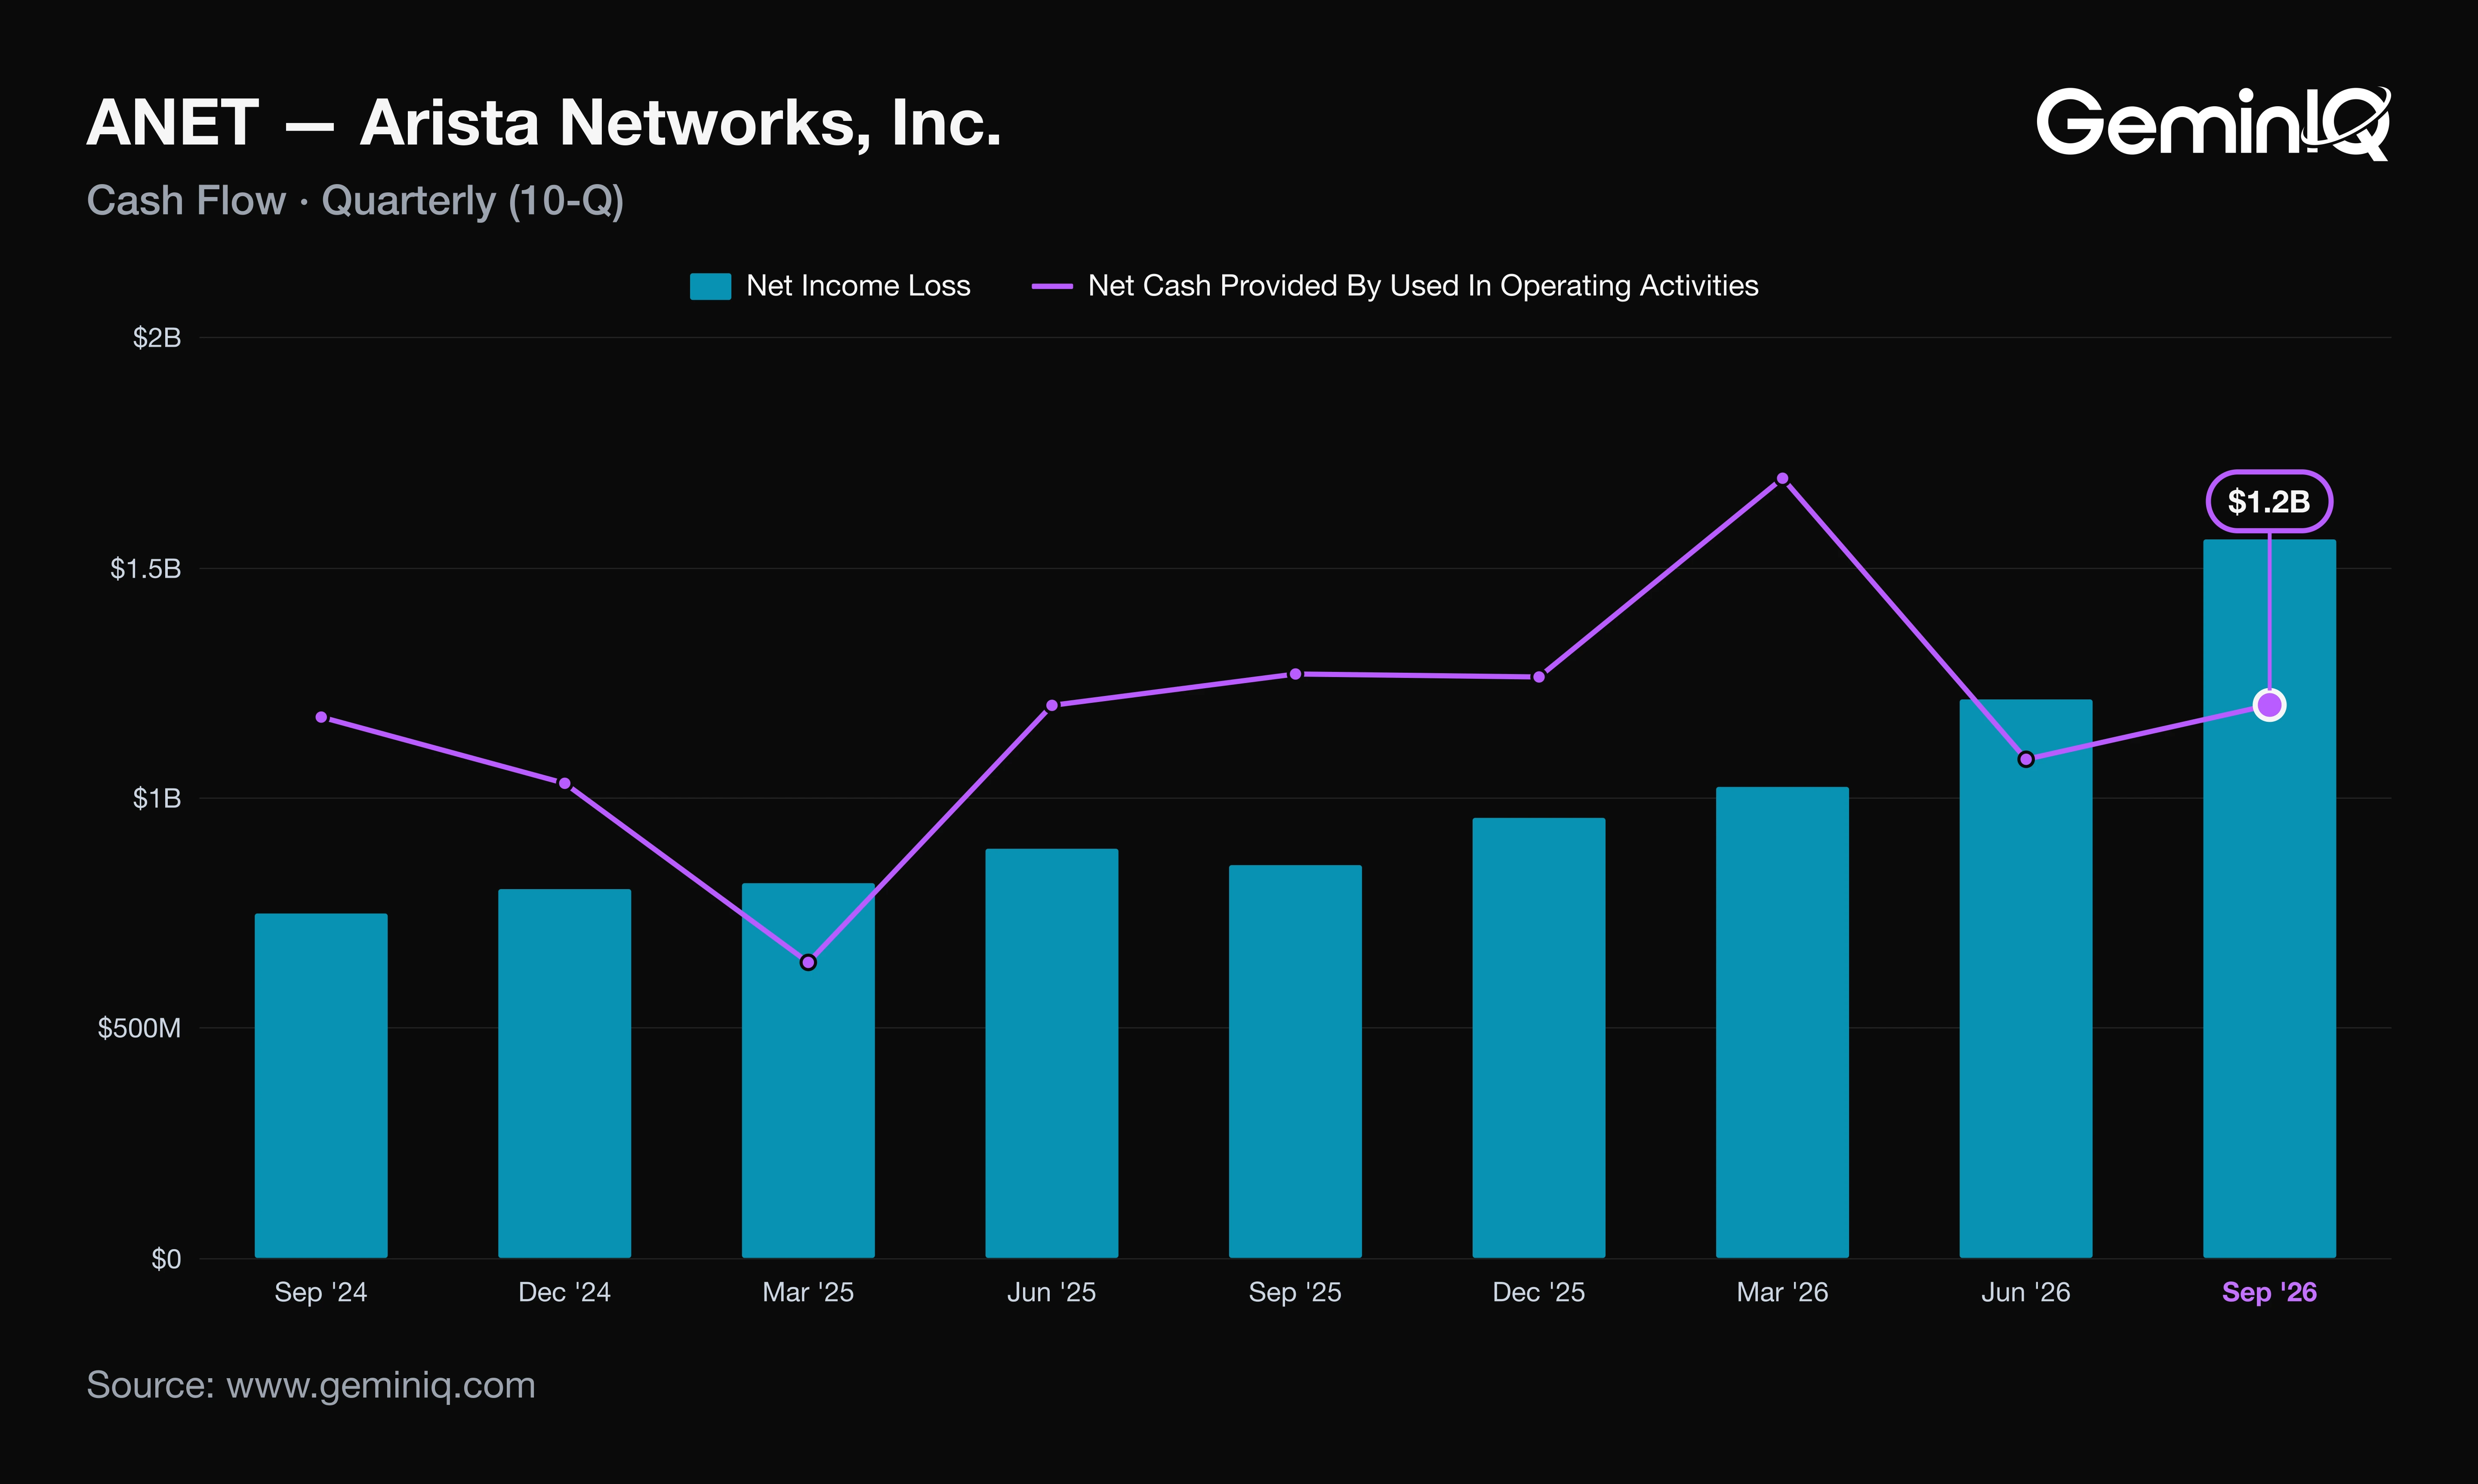
Arista's Q3 2026 operating cash flow was $1.20 billion, down 5.3% from $1.27 billion a year earlier, while net income rose 82.9%. The release's highlights lead with revenue growth, margins and EPS and do not mention cash flow.
A reader who saw "record profitability" would expect operating cash flow to have climbed with it. Instead cash conversion dropped.
The Data: Operating cash flow was 77% of net income this quarter (derived), against 89% in Q2 and 149% a year ago. Over nine months, the 10-Q shows inventory rose $962.8 million against $321.1 million in the same period of 2025, receivables rose $440.9 million, and other assets rose $604.2 million on deferred cost of sales. Purchase obligations stood at $11.4 billion, with $9.3 billion due within a year.
Why: The company attributes the working-capital drain to higher purchase commitments for AI networks and tight memory and silicon supply, which it says "will increase our working capital requirements." Deferred revenue supplied $1.5 billion of cash over the nine months, against $1.8 billion a year earlier, so the cushion is thinner than it was. The benign reading is a build ahead of shipments that convert when product is accepted. If it is, cash flow catches up with profit; if the stock sits, 77% becomes the new baseline.
Arista Q3 2026 Free Cash Flow, Capex and Buybacks
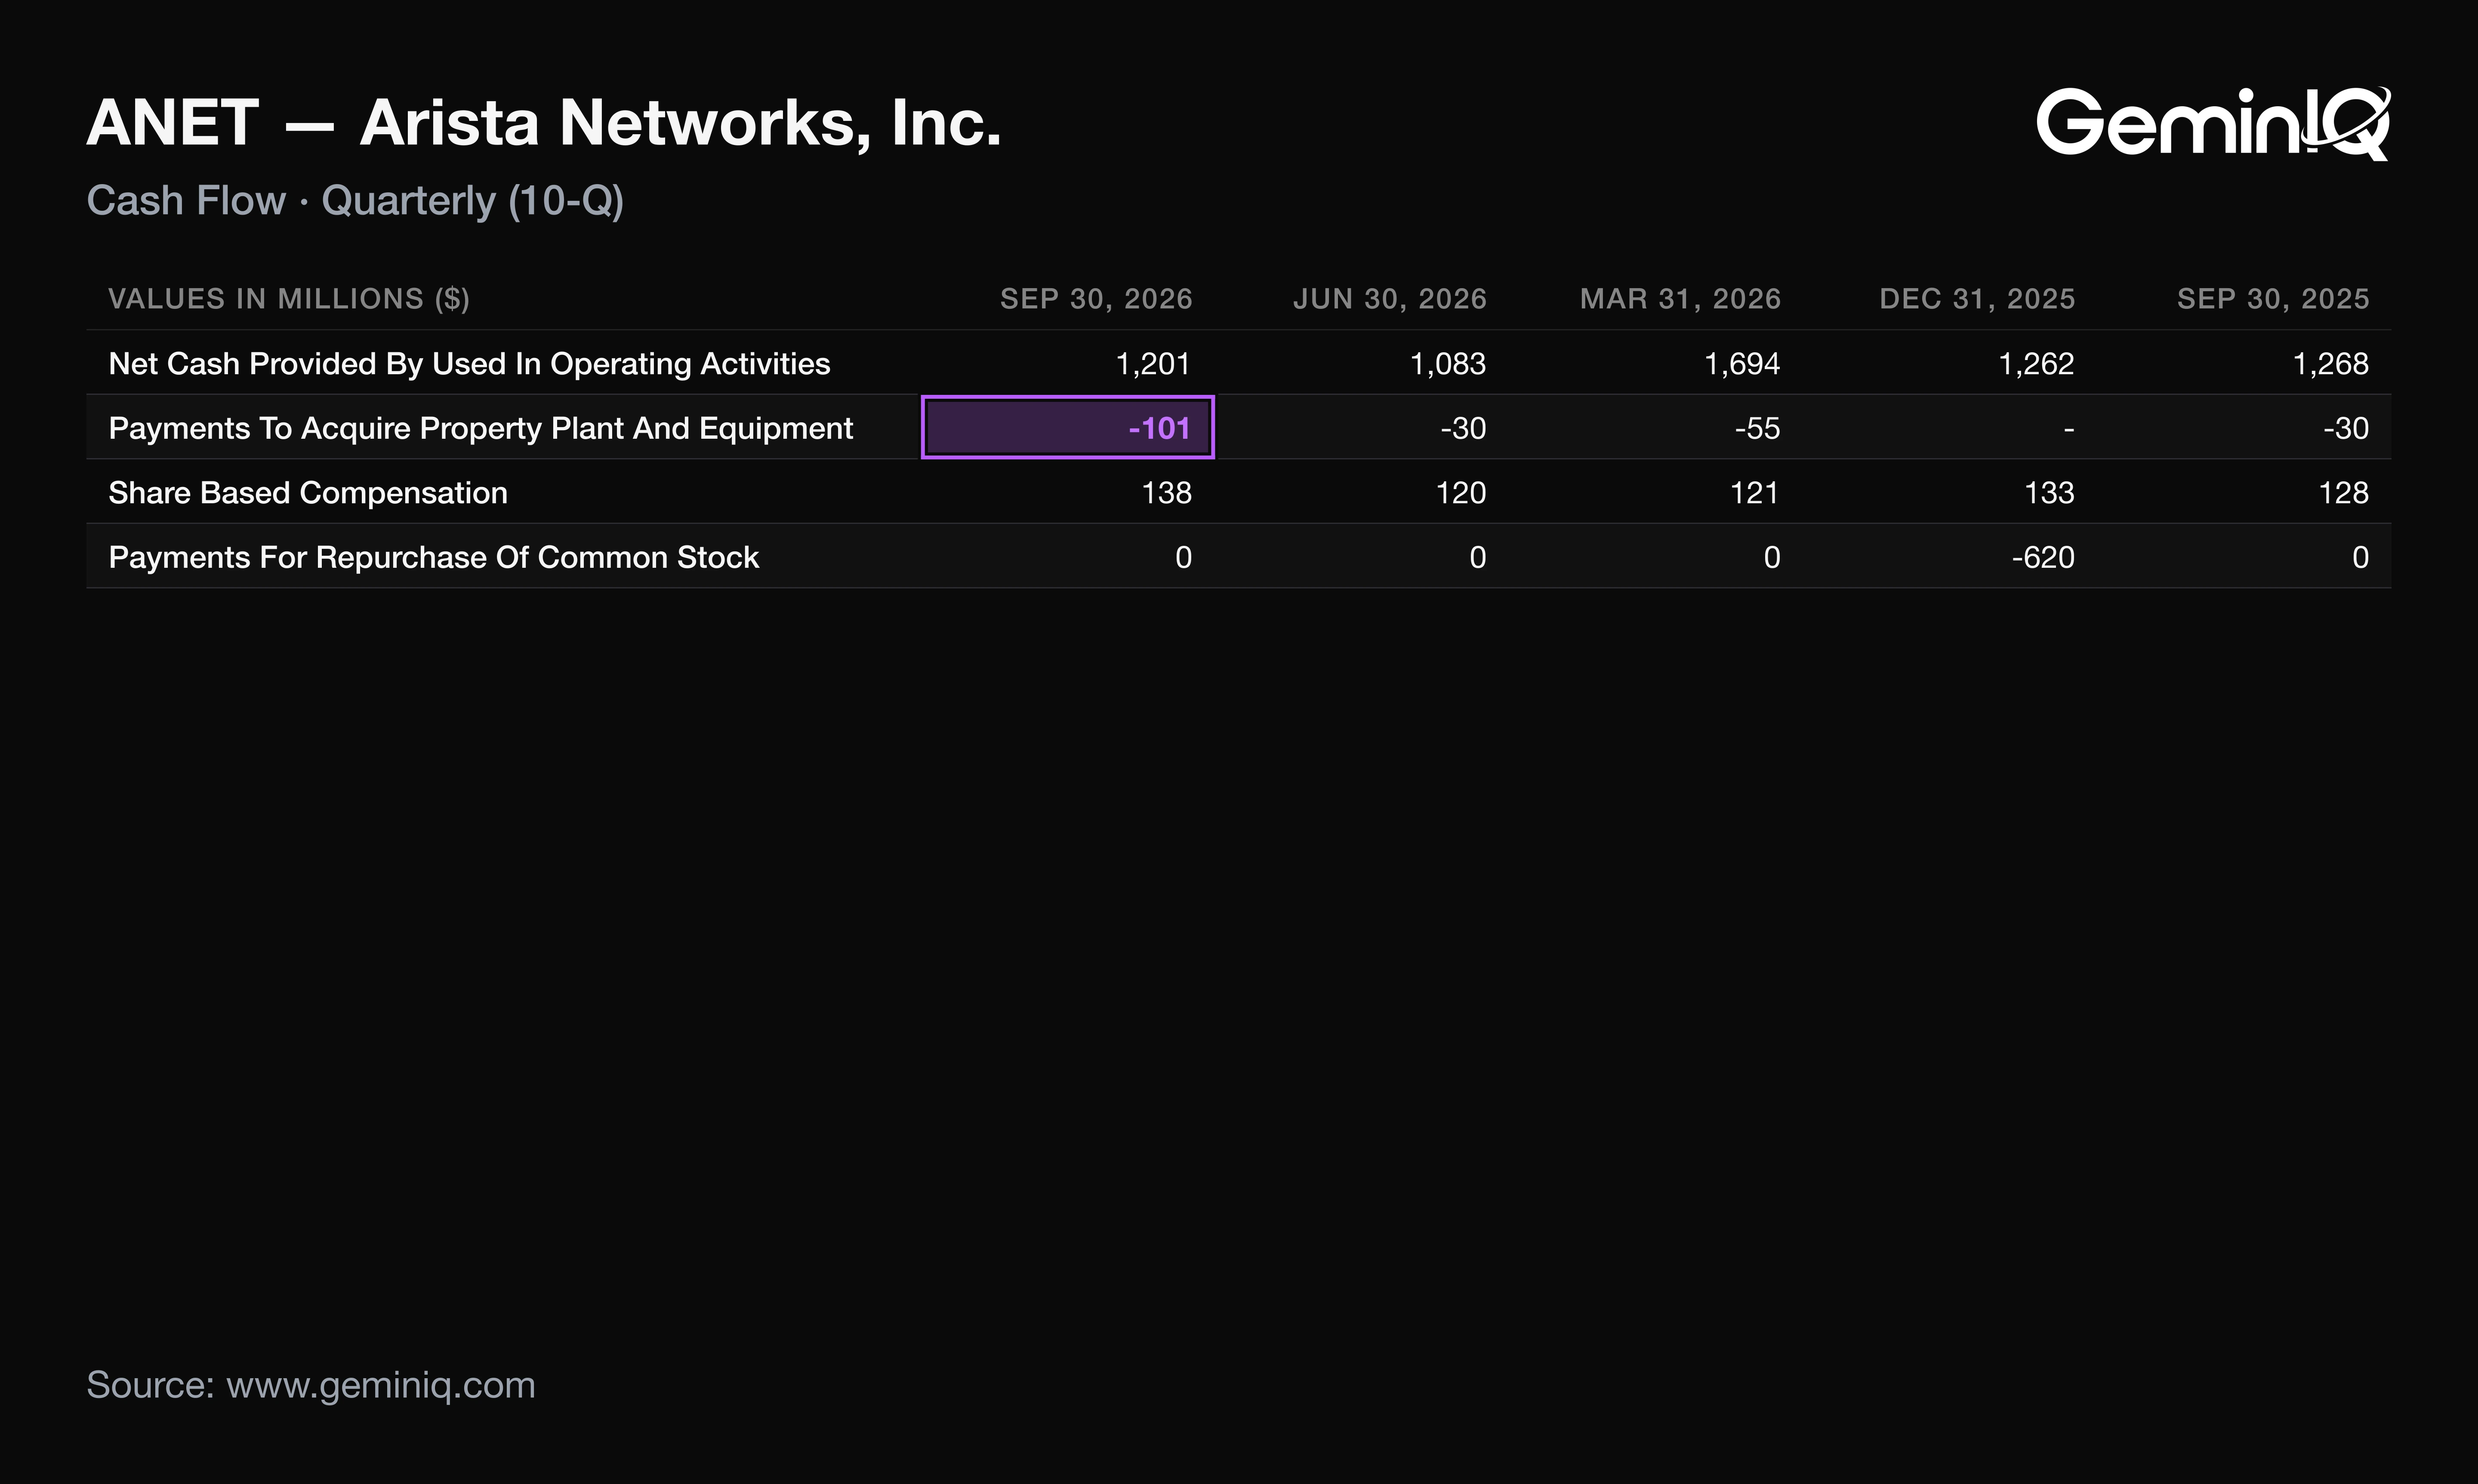
Arista's Q3 2026 free cash flow was $1.10 billion, down 11.1% from a year earlier, after capital expenditure of $100.7 million, the highest of the last 16 quarters. GeminIQ's pre-calculated Free Cash Flow for the trailing twelve months was $5.05 billion, up 24.5%.
The Data: Capex was 3.4 times the $29.7 million of Q2 (derived). Arista held about $14.4 billion of cash, equivalents and marketable securities at quarter end. It repurchased no shares in the nine months of 2026, against $983.0 million in the same months of 2025, and $817.9 million of the May 2025 authorization remains.
Why: The MD&A ties part of the capex to the ongoing construction of a building in Santa Clara for office, lab and data center space. Stock-based compensation was $138.1 million in the quarter, and with no repurchases nothing offsets it, which is how diluted shares edged up 0.1% rather than fall.
Arista's Q4 2026 Guidance After Q3
In the 8-K, Arista guided Q4 2026 revenue to $3.9 billion to $4.0 billion, 6.6% to 9.4% above Q3's $3.66 billion (derived). It also guided non-GAAP operating margin of 48% to 49% and non-GAAP diluted EPS of $1.26 to $1.30.
The Data: The Q2 8-K guided Q3 revenue to approximately $3.3 billion; the company reported 10.8% more. It guided non-GAAP EPS of $1.06 to $1.08 and reported $1.20, and guided non-GAAP operating margin of 48% to 49% against a reported 49.1%.
Why: Q3 grew 20.5% sequentially, so the Q4 guide asks for much slower growth, and the guided margin range sits at or below Q3's 49.1% even as revenue rises. The company's own text points to memory and silicon costs pressuring gross margin. The guide is the company's claim, and Q3's results sat above the top of its range.
How ANET Stock Has Moved After Past Earnings Reports
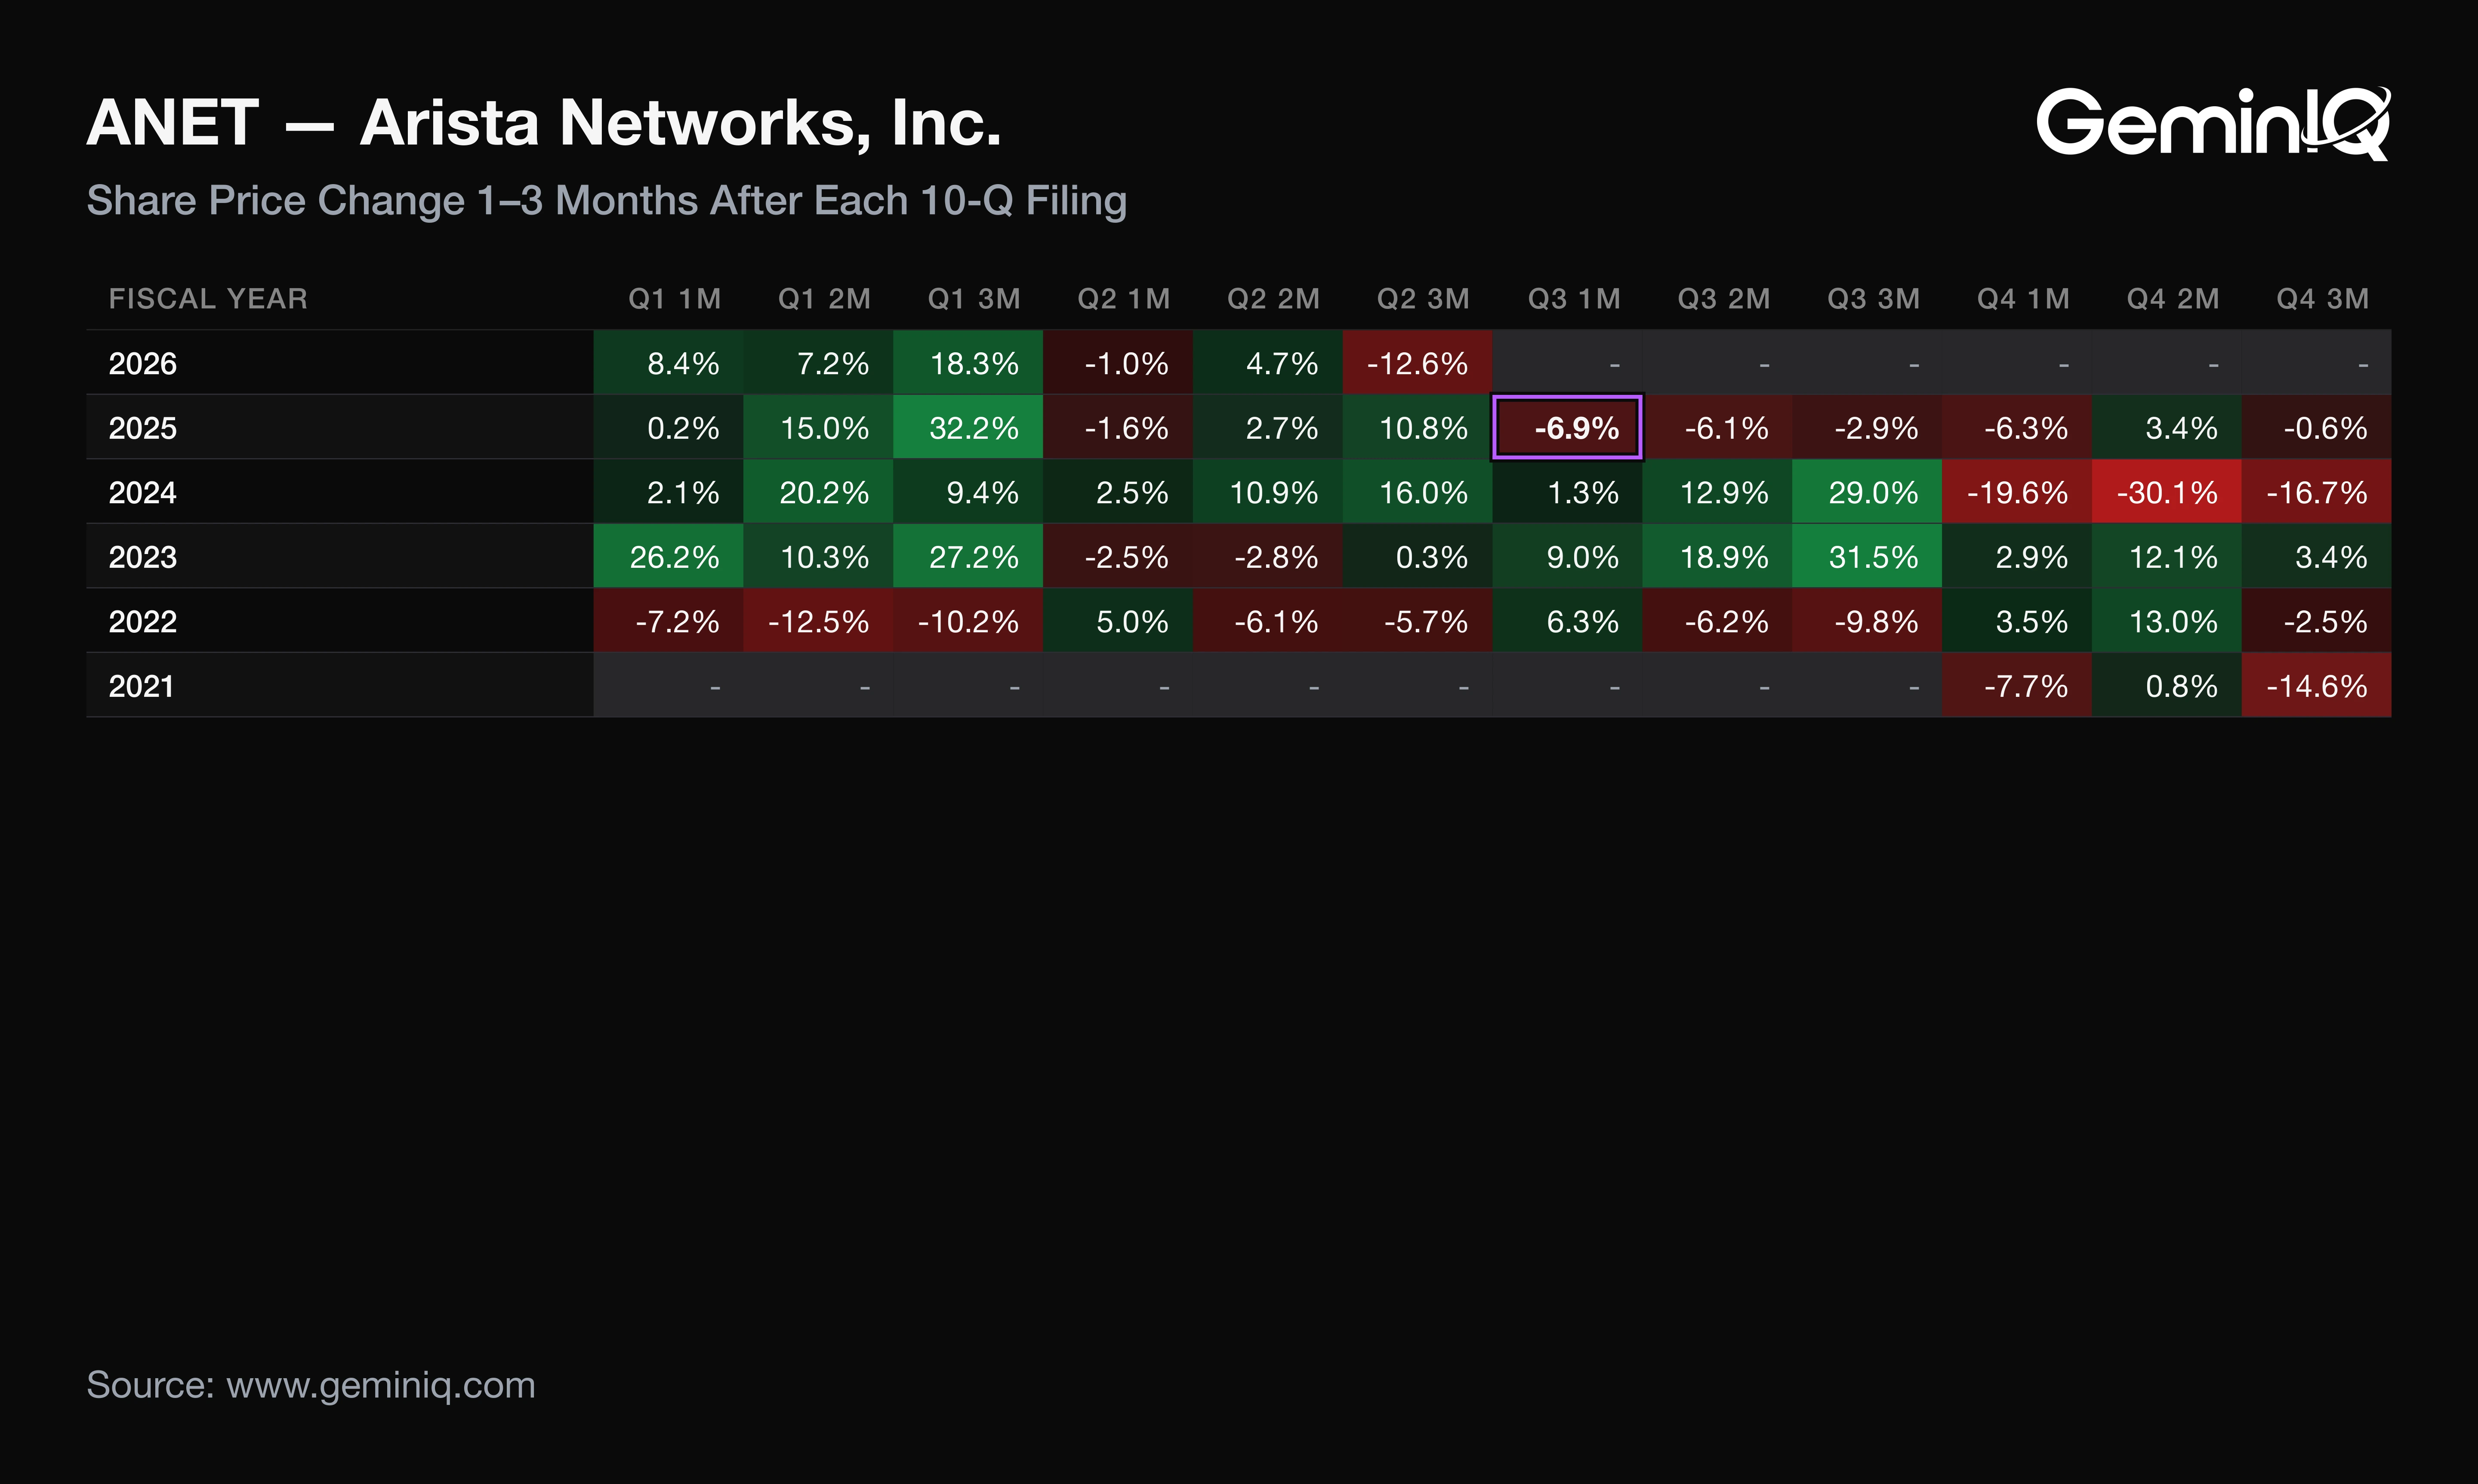
Across the last 12 10-Q filings with a completed one-month window, filed October 31, 2023 to August 5, 2026, ANET's median one-month return was +0.8%, positive after 7 of 12. The median three-month return was +10.1%, positive after 8 of 12. The range ran from -19.6% after the February 2025 filing to +9.0% after the October 2023 filing. Past Q3 filings were followed by one-month returns of +9.0%, +1.3% and -6.9%. These figures describe how Arista's stock moved after its past filings; they are a historical association, not a forecast. This filing's window has not yet elapsed. The Earnings Reaction Heat Map fills it in over the next three months.
The Data: Form 4 filings from September 25, 2025 to September 25, 2026 show 60 sales totaling $1.19 billion and no purchases, against 61 sales of $993.4 million in the prior twelve months. Jayshree Ullal's sales were $603.9 million and Andreas Bechtolsheim's $521.3 million. Institutions held 68.33% at June 30, 2026, up 3.62 points in a year and the highest of the last 16 quarters. The Form 4 data runs only through the September 25 filings, so it does not cover trading after the release.
Why: Sales with zero purchases fit the roughly 3:1 sell-to-buy norm, so the insider record is context rather than a finding. The reaction record is mixed in a specific way: three-month returns have been far more reliable than one-month returns.
A quarter where net income outgrows operating income on investment gains and cash flow falls is one whose profit is waiting on shipments to convert, and the cash flow statement is where that shows first.
Frequently Asked Questions
When does Arista report earnings?
Arista reported Q3 2026 results on November 3, 2026 and filed its 10-Q on November 4. Last year it filed its fourth-quarter results on February 17, 2026, a pattern from the filing record, not a forecast of the next date.
Does Arista pay a dividend?
Arista paid no dividend in Q3 2026 or in the trailing twelve months, and the 10-Q states a belief that it will not pay cash dividends in the foreseeable future. Its capital return has been buybacks, none of which occurred in the first nine months of 2026.
Is Arista doing well financially?
Arista's trailing net profit margin was 39.97% and operating margin 43.83%, per GeminIQ's pre-calculated Net Profit Margin and Operating Profit Margin. Return on Invested Capital was 35.19%, down 2.91 points in a year, and Net Debt to EBITDA was -0.43x, a net cash position.
What was Arista's free cash flow in Q3 2026?
Arista's Q3 2026 free cash flow was $1.10 billion, operating cash flow less capex, down 11.1% from $1.24 billion a year earlier. That is about 71% of the quarter's net income (derived), against 145% a year ago.
Wall Street's data. Main Street's price.
Institutional terminals charge thousands a year for as-filed accuracy. GeminIQ gives you the same thing for a fraction of the cost: financials built directly from raw SEC EDGAR filings, not third-party APIs, with full XBRL traceability back to the original 10-K or 10-Q. No normalized guesswork, just calculated metrics, charts, screeners, and watchlists built on numbers exactly as the company reported them. Start researching now at GeminIQ.com.
All financial figures cited in this article reference Arista Networks, Inc.'s Q3 2026 10-Q (filed November 4, 2026, period ending September 30, 2026), with guidance and management commentary drawn from the company's Form 8-K earnings release (filed November 3, 2026). All SEC filings are publicly available at SEC EDGAR and SEC EDGAR.
Disclaimer: The content in this blog is for educational and entertainment purposes only and does not constitute financial, legal, or tax advice. Investing involves risk, including the loss of principal. The views expressed are my own and not intended as financial advice or a guarantee of future performance.