
Capex Intensity by Sector: What Filings Show

By Chad Hartman
Published · Last updated
Oracle Corp is currently spending capex at 7.3x its own depreciation and amortization. Alphabet Inc. is running 5.2x. Both numbers are visible proof of the AI infrastructure buildout everyone already knows is happening — but the more useful comparison sits on the other side of the ledger, where the majority of the filing universe is running the opposite pattern: spending less on capex than it is depreciating the assets already on the books.
This study reads GeminIQ's as-filed universe as of the most recent trailing-twelve-month filing period for non-financial companies with usable capex and depreciation data — 3,191 companies at the most recent snapshot. A persistence check runs separately across 6,676 companies with at least three of the last four quarterly trailing-twelve-month readings available. Every figure is drawn directly from as-filed capex and depreciation-and-amortization line items via GeminIQ's Financial Statements data, with the top and bottom 1% of each sector's distribution trimmed.
The Pattern
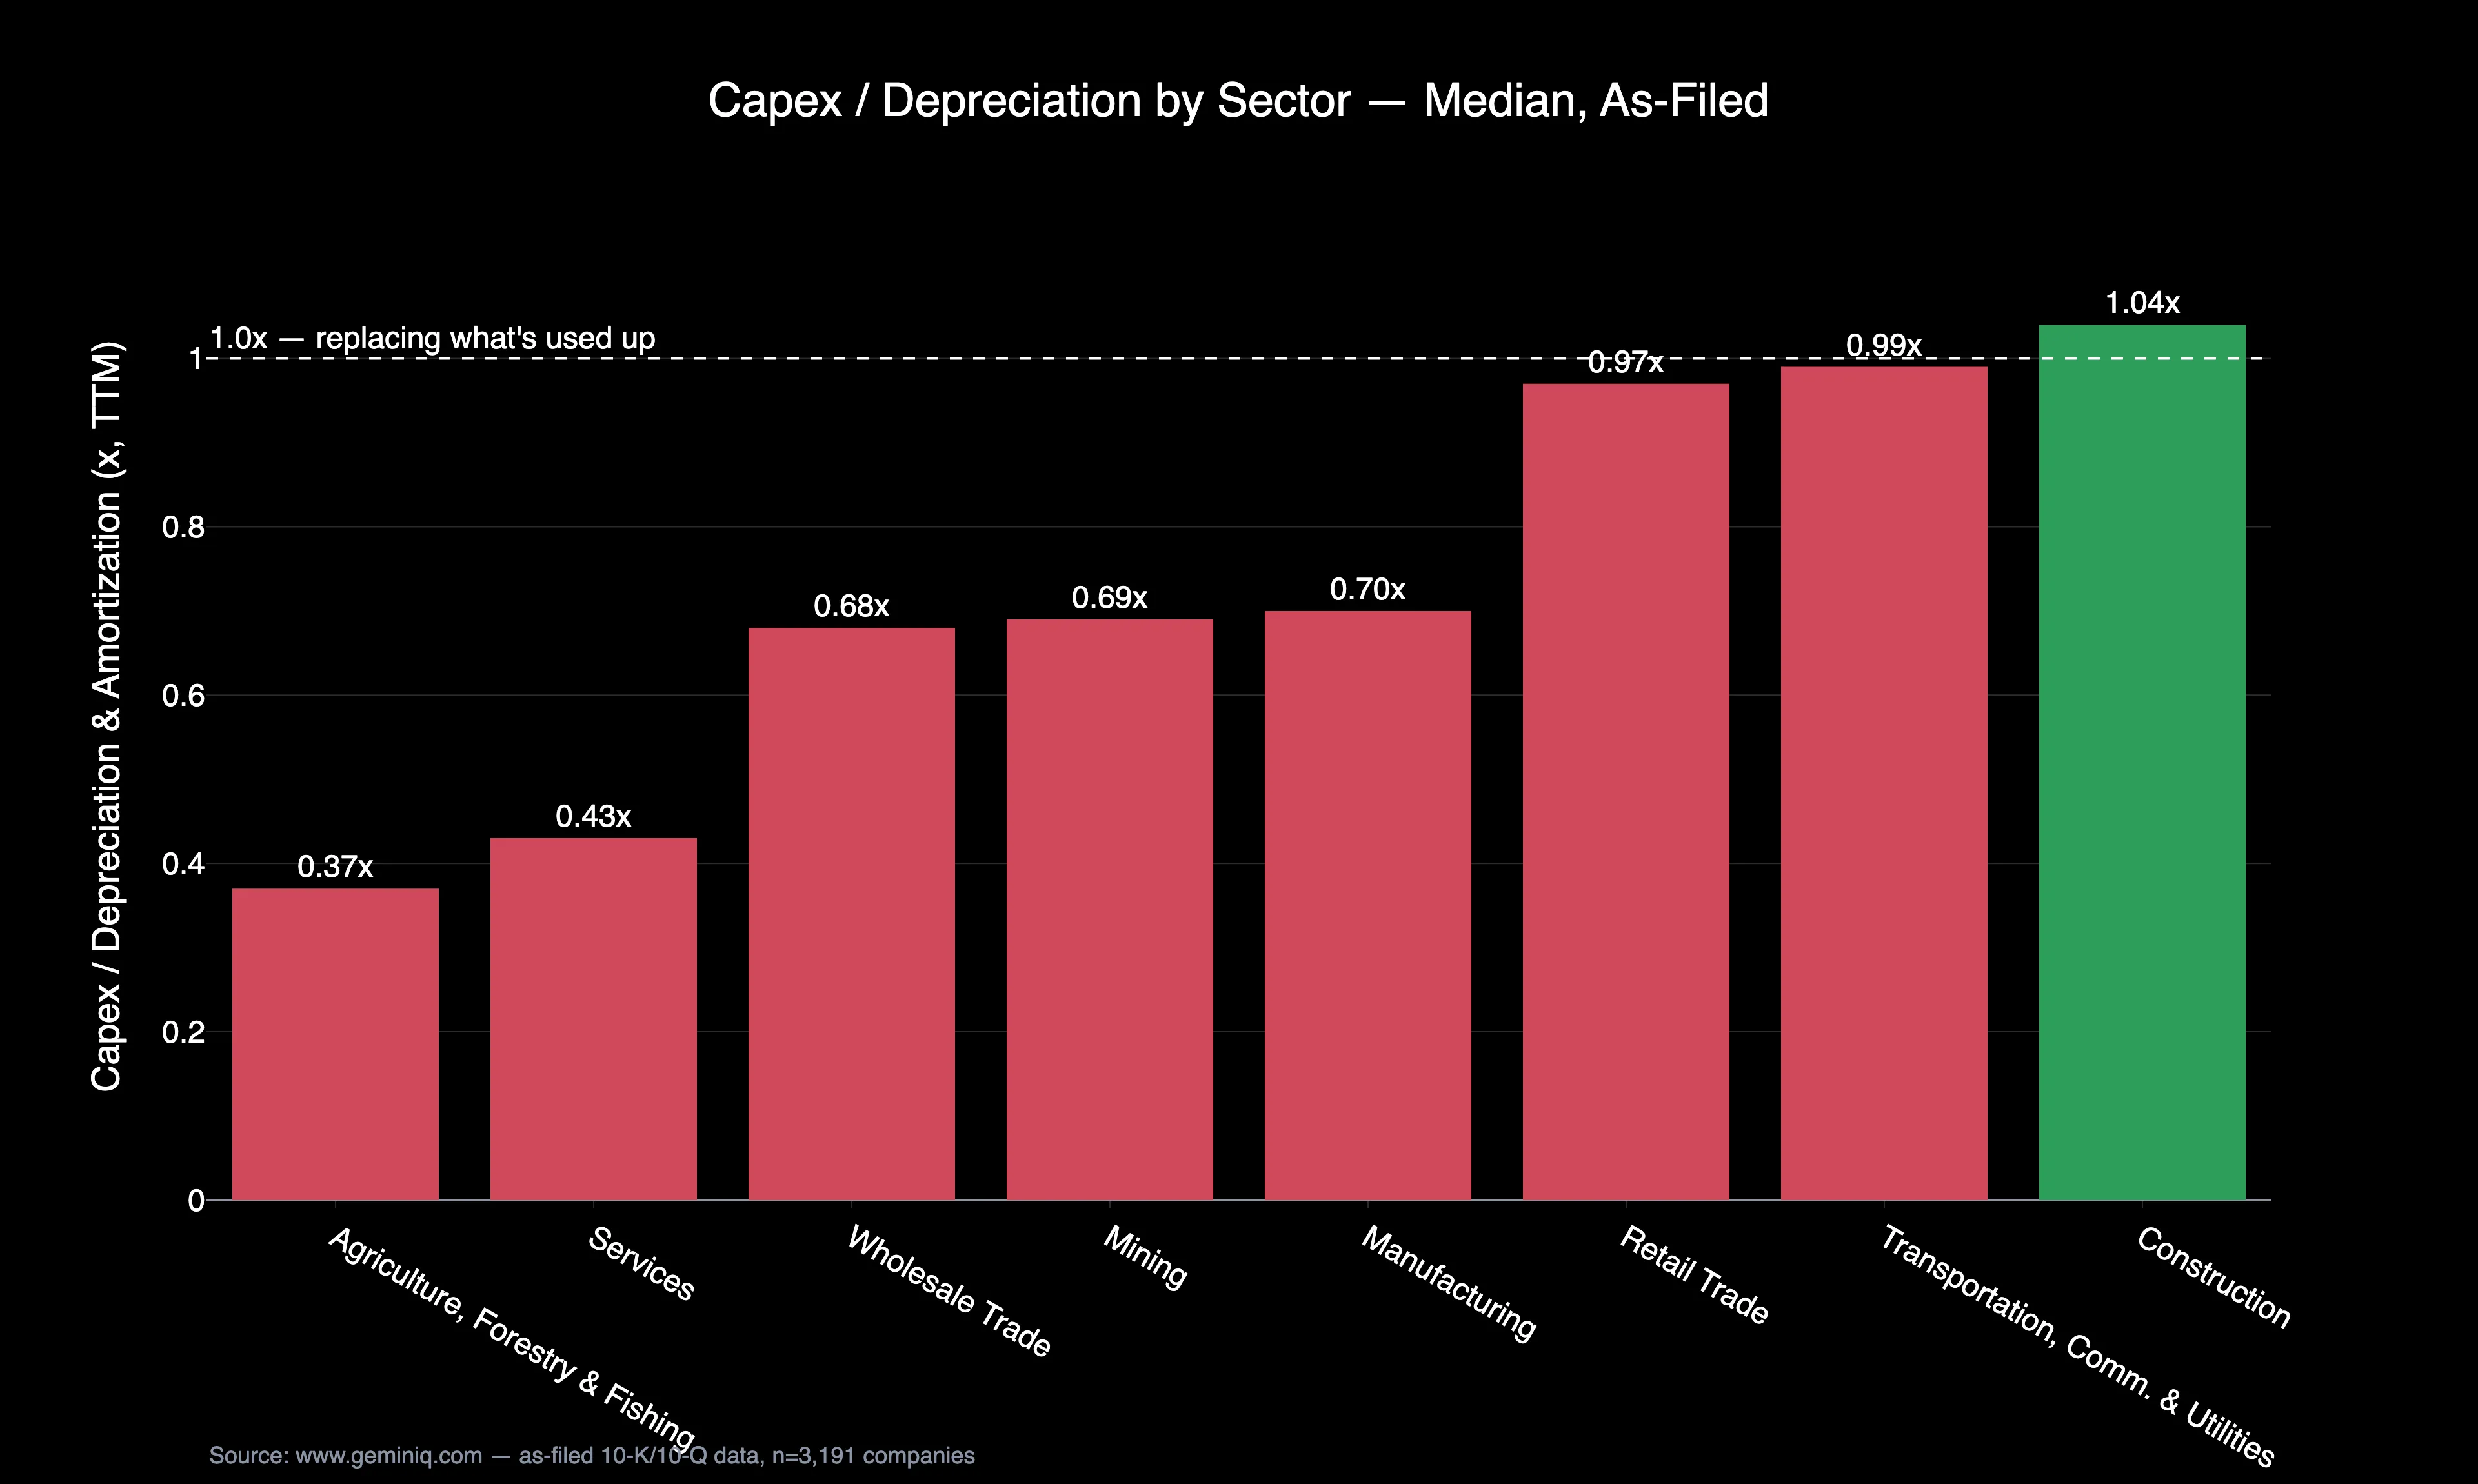
Capex as a share of revenue is the number most benchmark tables lead with, and it varies enormously by sector — from roughly 1% of revenue in Wholesale Trade to nearly 10% in Transportation, Communications & Utilities. But the ratio that actually says something about a business's trajectory is capex against its own depreciation, not against revenue. A company spending less on capex than it is depreciating is, asset by asset, not fully replacing what it uses up. The universe median currently sits at 0.68x — the typical company is running capex at barely two-thirds of its depreciation charge. 55.0% of companies with sufficient recent history have run below that 1x line in every one of their last four quarterly trailing-twelve-month readings, not just the latest one.
The Data
| Sector | N | Capex / Revenue (median) | Capex / D&A (median) |
|---|---|---|---|
| Transportation, Communications & Utilities | 291 | 9.8% | 0.99x |
| Mining | 142 | 6.7% | 0.69x |
| Agriculture, Forestry & Fishing | 29 | 3.3% | 0.37x |
| Retail Trade | 204 | 2.7% | 0.97x |
| Manufacturing | 1,557 | 2.5% | 0.70x |
| Services | 812 | 1.3% | 0.43x |
| Wholesale Trade | 96 | 1.0% | 0.68x |
| Construction | 60 | 0.9% | 1.04x |
| Universe (ex-financials) | 3,191 | 2.3% | 0.68x |
Construction and Wholesale Trade sit under the 200-company floor GeminIQ applies to Filing Data Study buckets and should be read as directional. Every other sector's median capex-to-D&A ratio sits at or below 1.0x (Construction, at 1.04x, is the one exception, and it is one of the two thin buckets) — including Transportation, Communications & Utilities, the most capital-intensive sector on a revenue basis, which still runs a median of just 0.99x. The revenue-based ratio makes some sectors look capital-hungry and others look capital-light; the depreciation-based ratio shows that almost none of them, at the median, are spending enough to fully replace what they're using up.
The Extremes
Oracle Corp and Alphabet Inc., at 7.3x and 5.2x capex-to-D&A respectively, sit far above every sector median in this study — the filed evidence of a buildout cycle large enough to be reshaping the Services sector's own aggregate numbers. McDonald's Corp, at 7.7x, is the less obvious name on this list: a mature, franchise-heavy restaurant chain running capex intensity in the same range as the AI infrastructure builders, reflecting a multi-year push into company-operated restaurant reinvestment and technology upgrades that doesn't show up in the "McDonald's is a slow-growth compounder" framing most investors default to.
At the other end, Baxter International is running capex at just 0.3x its own depreciation charge, and Twilio Inc. at 0.9x — both companies effectively harvesting their existing asset base rather than reinvesting in it. Neither figure alone proves decline; a low-capex-intensity software or services business can be a genuine feature of the model rather than a warning sign. The distinction is whether the pattern holds for multiple consecutive periods or reflects one light quarter, which is exactly what the persistence check above is built to separate.
The Method
Capex-to-revenue and capex-to-D&A are both computed from as-filed trailing-twelve-month figures via GeminIQ's Financial Statements data, for each company's most recent filing period within the last fifteen months. The persistence figure — companies running capex below D&A in every one of their last four quarterly TTM readings — was computed separately across the fuller history in GeminIQ's lake, requiring at least three of the last four quarterly snapshots to be present. Sectors are grouped by SIC division from each company's own filed SIC code. This is a historical distribution measured across the current filing snapshot and recent history, not a forecast. Full methodology is covered in How GeminIQ Builds Filing Data Studies.
Check Your Holdings
Pull up any position's Financial Statements on GeminIQ, divide its trailing capex by its trailing depreciation and amortization, and check whether that ratio has been below 1.0x for more than one recent period — a single light quarter is normal, but a sustained run below 1x, especially outside a capital-light sector like Services, is the kind of signal a headline revenue number won't show. Every reader can rebuild this check for their own holdings directly from GeminIQ's as-filed data.
Frequently Asked Questions
What is a good capex-to-depreciation ratio?
There's no fixed threshold, but a ratio persistently below 1.0x means a company is spending less on capex than it's depreciating its existing asset base. In GeminIQ's data, the universe median currently sits at 0.68x, and 55.0% of companies with sufficient history have run below 1x in every one of their last four quarterly readings.
What does it mean when a company's capex is below its depreciation?
Asset by asset, the company is not fully replacing what it uses up in a given period. It isn't automatically a warning sign — a low-capex-intensity software or services business can be a genuine feature of the model — but a sustained run below 1x outside a capital-light sector is worth a closer look.
Which sectors have the highest capex intensity?
By capex-to-revenue, Transportation, Communications & Utilities leads at 9.8% of revenue in GeminIQ's data. But even that sector's capex-to-D&A ratio sits at just 0.99x — nearly every sector's median capex-to-depreciation ratio sits at or below 1.0x, regardless of how capital-intensive it looks on a revenue basis.
How many companies does this study cover?
3,191 non-financial companies with usable capex and depreciation data at the most recent snapshot, plus a persistence check across 6,676 companies with sufficient recent quarterly history.
Wall Street's data. Main Street's price.
Institutional terminals charge thousands a year for as-filed accuracy. GeminIQ gives you the same thing for a fraction of the cost: financials built directly from raw SEC EDGAR filings, not third-party APIs, with full XBRL traceability back to the original 10-K or 10-Q. No normalized guesswork, just calculated metrics, charts, screeners, and watchlists built on numbers exactly as the company reported them. Start researching now at GeminIQ.com.
All figures are drawn from each company's as-filed 10-K and 10-Q filings, publicly available on SEC EDGAR. Sector medians, quartiles, and the multi-quarter persistence figure are computed from GeminIQ's Financial Statements data across the described universe and snapshot window.
Disclaimer: The content in this blog is for educational and entertainment purposes only and does not constitute financial, legal, or tax advice. Investing involves risk, including the loss of principal. The views expressed are my own and not intended as financial advice or a guarantee of future performance.