
Filing Data Study Methodology: How Our SEC Analysis Works

By Chad Hartman
Published · Last updated
Every few weeks, a chart goes viral claiming that some pattern in earnings "predicts" what a stock does next. Almost none of them survive contact with the actual math. They compound returns that were never meant to be compounded, they compare a handful of cherry-picked quarters against nothing, and they call an association a prediction. The finding evaporates the moment anyone checks the baseline. This post is the methodology behind every GeminIQ filing data study — the fixed set of rules we apply before a single number goes into a post, so that when we tell you "quarters with X were followed by Y," the statement holds up. It exists for two reasons: so you can trust the studies, and so you can run the same checks yourself.
Every study in this series reads the same source: the as-filed 10-K and 10-Q filings in GeminIQ's database, going back 17 years, joined to how each stock actually traded in the months after each filing hit SEC EDGAR. No normalized third-party feed sits in between. What follows are the five rules that govern how those filings become a finding.
Table of Contents
- What a Filing Data Study Measures
- The Numbers Are Cumulative — Never Compound Them
- Every Result Is Measured Against the Base Rate
- Sample Size, Outliers, and Medians
- Association, Not Prediction
- Where the Data Comes From
- How to Run This Yourself
What a Filing Data Study Measures
A filing data study asks a different question than a single-company teardown. A teardown audits one company's most recent filing. A study reads the whole shelf — thousands of filings across the market, or one company's entire filing history — to find a pattern that no single quarter reveals. The raw material is two things joined together: what a company reported in its filing, and what its stock did afterward.
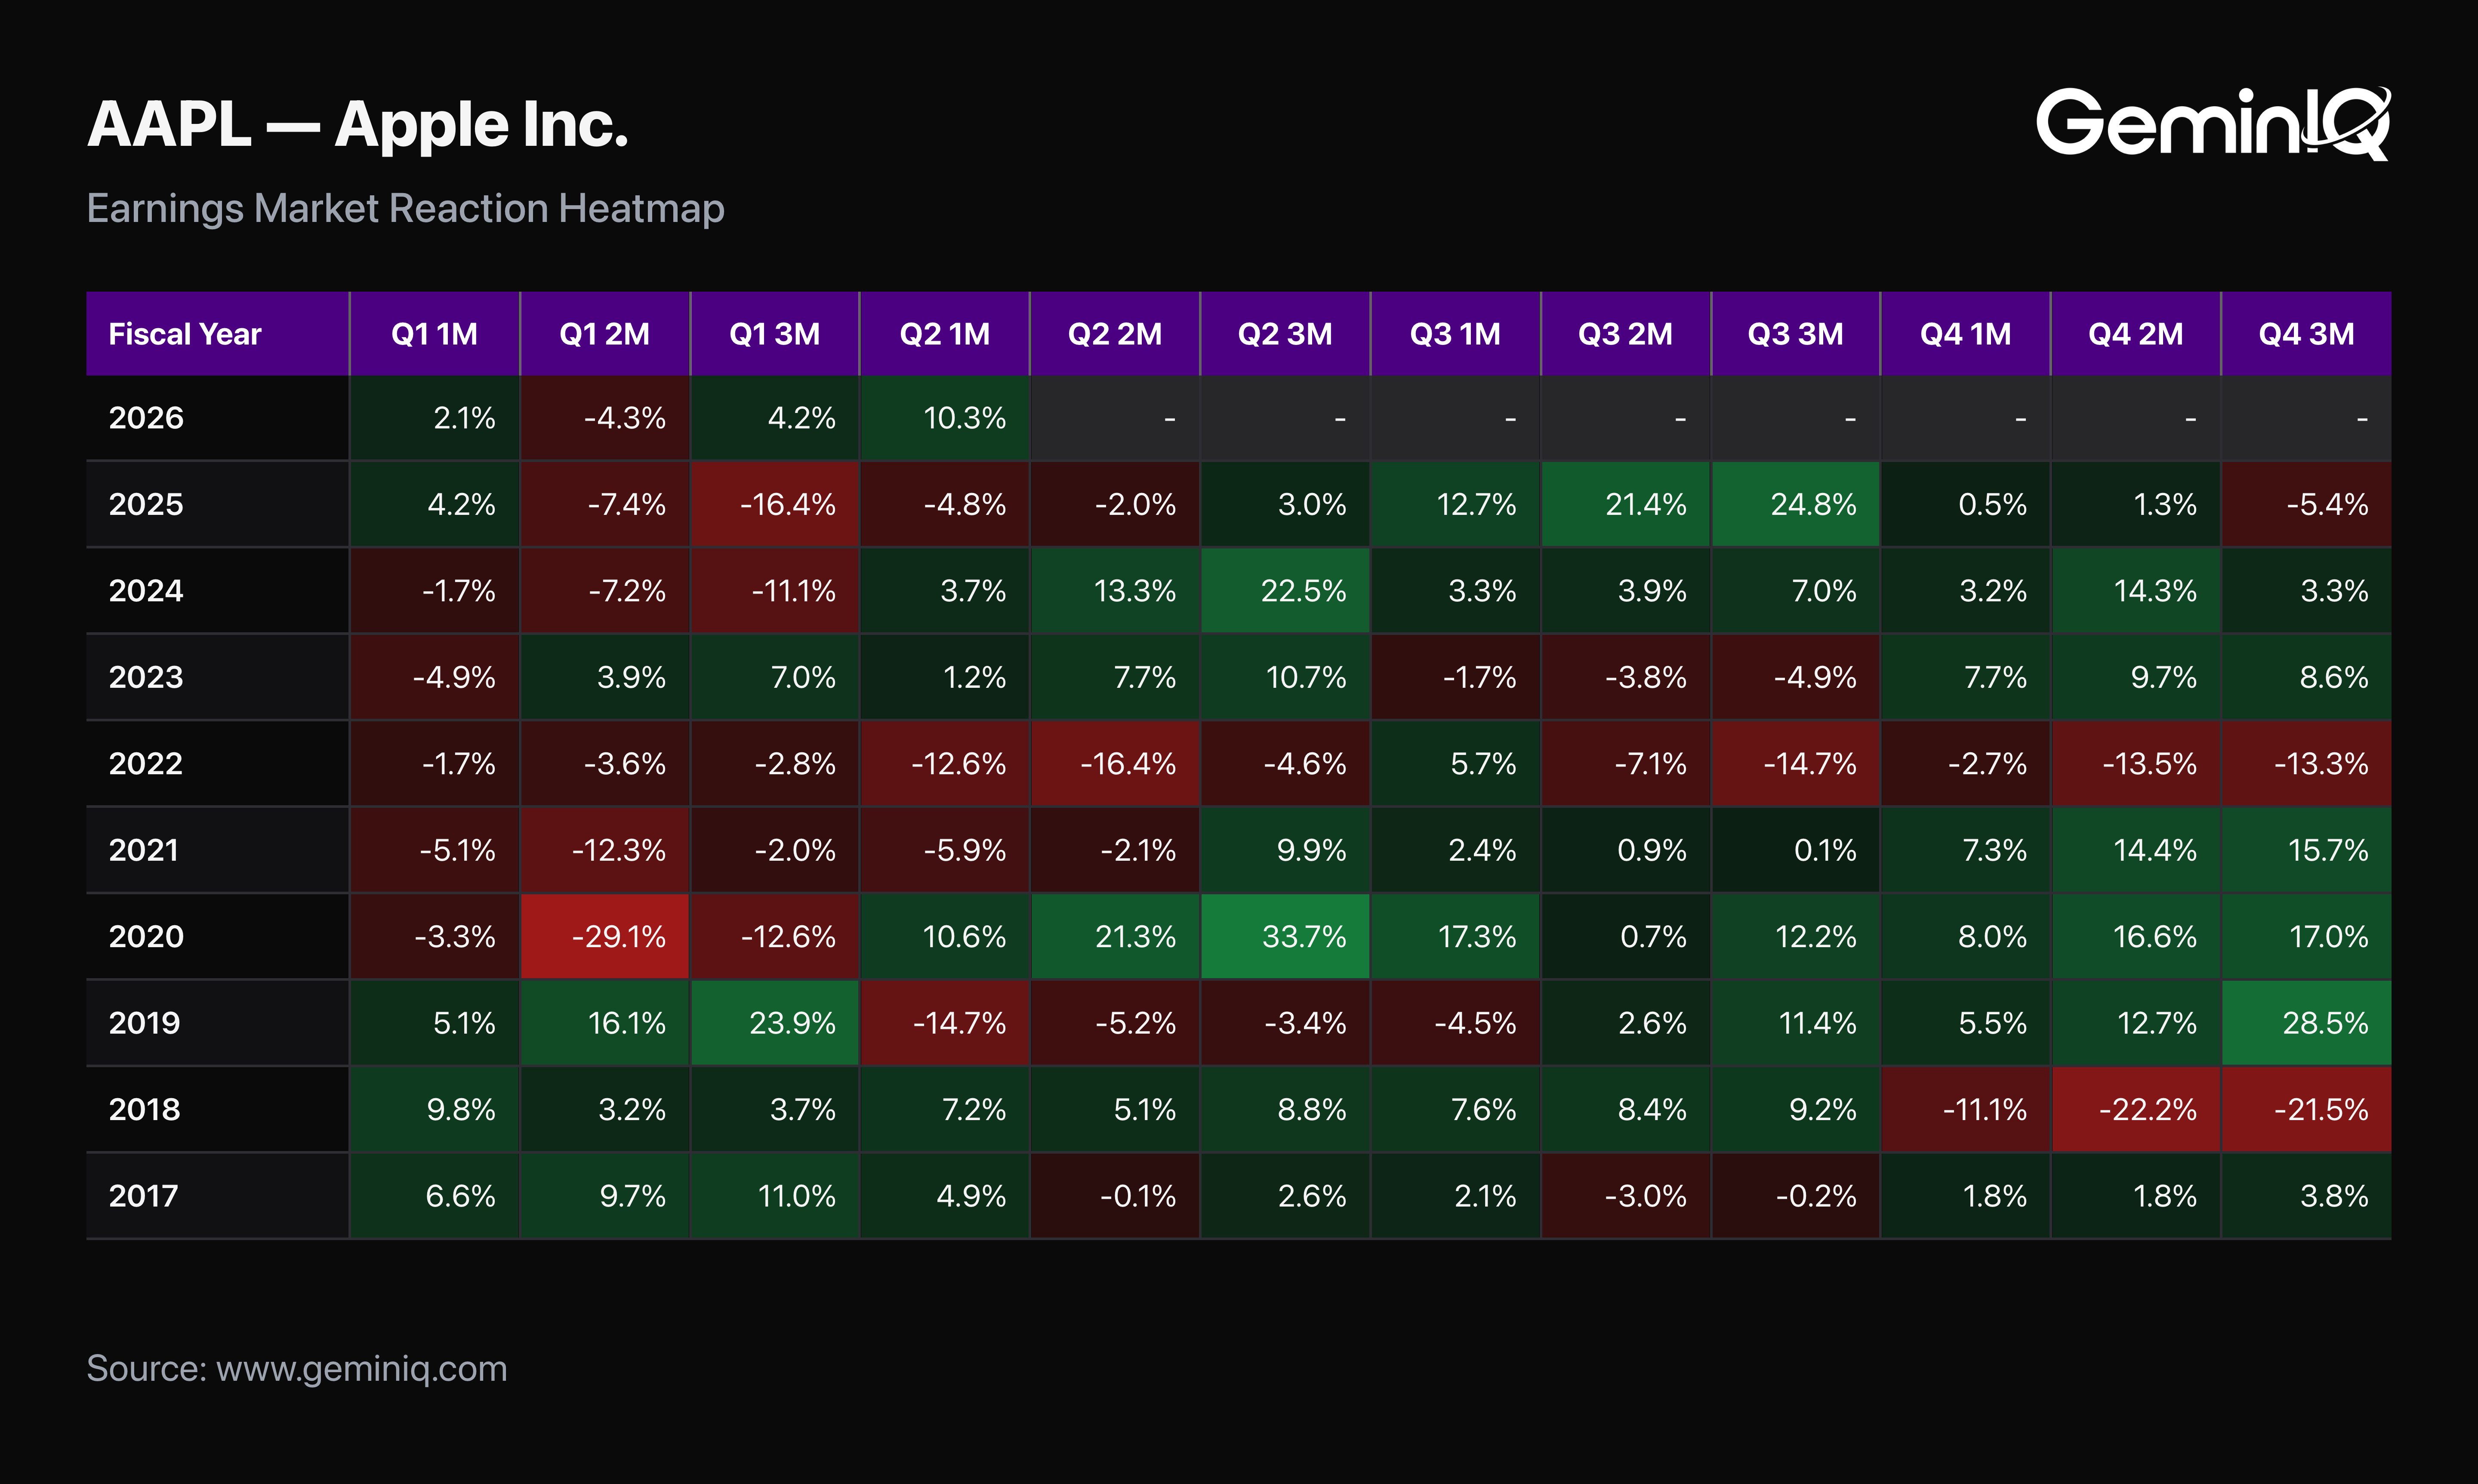
The "afterward" comes from GeminIQ's Earnings Market Reaction Heat Map, which records each stock's cumulative return over the months following a filing's filed date. A quarterly 10-Q carries the three months after filing; an annual 10-K carries the full twelve. That window is the spine of every study — the bridge between the number a company disclosed and the market's verdict on it.
The Numbers Are Cumulative — Never Compound Them
This is the single most common error in amateur earnings-reaction analysis, and it fabricates results out of thin air. The post-filing return figures are cumulative — each one already measures the total move from the filing date to that point. The three-month number is not the third month's return; it is the entire move across all three months, measured from the filing.
So you never multiply them together or add them up. If a stock is up 4% at month one and up 7% at month two, its second-month contribution is the difference — three points — not eleven. Compounding two cumulative figures double-counts the first month and inflates every result. When a study reports how a bucket of filings drifted over time, it plots the cumulative figures directly and derives any single month's move by subtraction. Getting this wrong is how a flat pattern gets turned into a "signal."
Every Result Is Measured Against the Base Rate
Here is what the viral charts almost never show you: the baseline. The last 17 years have been, on balance, a rising market. Pick any random basket of filings and the stocks mostly drifted up afterward, simply because most stocks drifted up in that period. "Stocks rose after companies did X" is therefore a meaningless sentence on its own. The only question that carries information is whether they rose more or less than average.
So every bucket in every study is reported against the universe base rate — the average post-filing drift across all filings over the same window — never against zero. If quarters with expanding margins were followed by a 5% three-month drift while the universe averaged 5%, that is not a finding; it is the market. If they were followed by 9% against a 5% baseline, now there is something to talk about. The base rate is what separates a real pattern from an artifact of the era.
Sample Size, Outliers, and Medians
A pattern built on twenty filings is a story, not a study. Every bucket we draw a conclusion from clears a floor of roughly 200 filings; below that, we either widen the definition or report the result as suggestive and say so plainly. A handful of quarters can look like anything.
Two more guards run on every study. We trim the most extreme 1% of returns on each tail before averaging, because a single meme-stock quarter that ran up several hundred percent can single-handedly bend an average and manufacture a trend that describes one company, not a pattern. And we report the median alongside the mean, because when the two diverge sharply, the average is being carried by outliers and the median is the more honest center of the distribution.
Association, Not Prediction
This is a discipline of language, and it is not optional. A study can establish that, historically, quarters exhibiting a certain characteristic were followed by a certain kind of move. It cannot establish that the characteristic predicts the move, causes it, or signals what any specific stock will do next. The past window is a record of what happened, not a forecast, and no filing data study on this site will ever tell you what a stock is going to do or what to do about it.
So the findings are always framed as association over the sample: "quarters with X were followed by Y." Never "X predicts Y." The distinction is the difference between reporting the historical record and pretending to see the future — and it is the line between analysis and a sales pitch dressed as analysis.
Where the Data Comes From
The filing figures come straight from the XBRL-tagged 10-K and 10-Q filings on SEC EDGAR, surfaced through GeminIQ's Financial Statements exactly as each company reported them. Nothing is normalized, re-templated, or reclassified on the way in. That matters for a study more than for anything else, because a study aggregates across thousands of companies — and if each of those numbers had been quietly reshaped by a third-party aggregator's house template, the pattern you found would be a pattern in the aggregator's decisions, not in what companies actually filed.
Insider and institutional signals, where a study uses them, come from SEC Form 4 and Form 13F. Both are quarterly by nature — they are not live or real-time feeds, and any study that leans on them treats them as periodic snapshots and pivots quickly back to the fundamentals. The market-reaction data is the post-filing price record described above. That is the entire input set: what was filed, and what happened next. No opinions, no estimates, no black box.
How to Run This Yourself
The point of publishing the method is that none of it is proprietary magic — it is discipline applied to public data, and you can apply the same discipline to whatever you own. Pull any company's filing in Financial Statements and read the line straight off the filing. Open the Earnings Market Reaction Heat Map to see how the stock actually traded after each of its filings, and remember the cumulative rule when you read those columns. Use the Stock Screener to define the characteristic you care about across the market, then always ask what the average filing did over the same window before you believe the pattern.
That last habit — comparing everything to the baseline — is the one that will save you from most of the bad charts on the internet. The filings are public and the price history is public. What a study adds is the refusal to let either one lie to you.
Wall Street's data. Main Street's price.
Institutional terminals charge thousands a year for as-filed accuracy. GeminIQ gives you the same thing for a fraction of the cost: financials built directly from raw SEC EDGAR filings, not third-party APIs, with full XBRL traceability back to the original 10-K or 10-Q. No normalized guesswork, just calculated metrics, charts, screeners, and watchlists built on numbers exactly as the company reported them. Start researching now at GeminIQ.com.
Disclaimer: The content in this blog is for educational and entertainment purposes only and does not constitute financial, legal, or tax advice. Investing involves risk, including the loss of principal. The views expressed are my own and not intended as financial advice or a guarantee of future performance.