
Capital One (COF) Q3 2026 Earnings: EPS Up 16%, Pretax Up 4%

By Chad Hartman
Published · Last updated
Capital One (COF) filed its Q3 2026 10-Q on November 3, 2026, for the quarter ended September 30, after releasing results on October 20: total net revenue was $16.34 billion, up 6.4% from a year earlier, and diluted EPS was $5.61, up 16.1%. Pretax income grew only 4.3%, so a lower tax rate and a share count 4.7% smaller supplied most of the EPS growth. The release led with adjusted EPS of $6.69, which sits $1.08 above the GAAP figure.
| Field | Value |
|---|---|
| Company | Capital One ($COF) |
| Quarter | Q3 FY2026, period ended September 30, 2026 |
| Earnings release | October 20, 2026 (Form 8-K) |
| 10-Q filed | November 3, 2026 |
| Revenue | $16.34 Billion (+6.4% YoY) |
| Diluted EPS | $5.61 (+16.1% YoY) |
| Operating margin | 28.0% (-0.6 pts YoY) |
| Operating cash flow (TTM) | $43.19 Billion |
| Pretax income growth (YoY) | +4.3% |
Capital One Q3 2026 Revenue, EPS and Margins
Capital One's Q3 2026 diluted EPS was $5.61, up 16.1% from $4.83, the highest of the last 16 quarters, while pretax income of $4.57 billion grew just 4.3%. The EPS growth came from three places, and profit from operations was the smallest.
A reader who saw the 16% EPS headline would expect earnings to have grown about as fast. Instead the 10-Q splits the gain three ways.
The Data: Pretax income was $4,572 million against $4,382 million. The tax provision fell 13% to $1,033 million, an effective rate of 22.6% against 27.1% a year earlier. Net income available to common stockholders rose 10.9% to $3,422 million, and diluted shares fell 4.7% to 609.5 million from 639.5 million. In the 8-K, EPS was $4.73 in Q2 2026.
Why: Roughly 4 points of the 16 came from pretax income, about 6 from the lower tax rate and about 5 from fewer shares. Had the rate held at 27.1%, income from continuing operations would have been about $3.33 billion instead of $3.54 billion, or roughly 34 cents a share, putting EPS near $5.27. The 10-Q attributes the year-over-year rate change to the prior-year Discover allowance, which distorted that quarter.
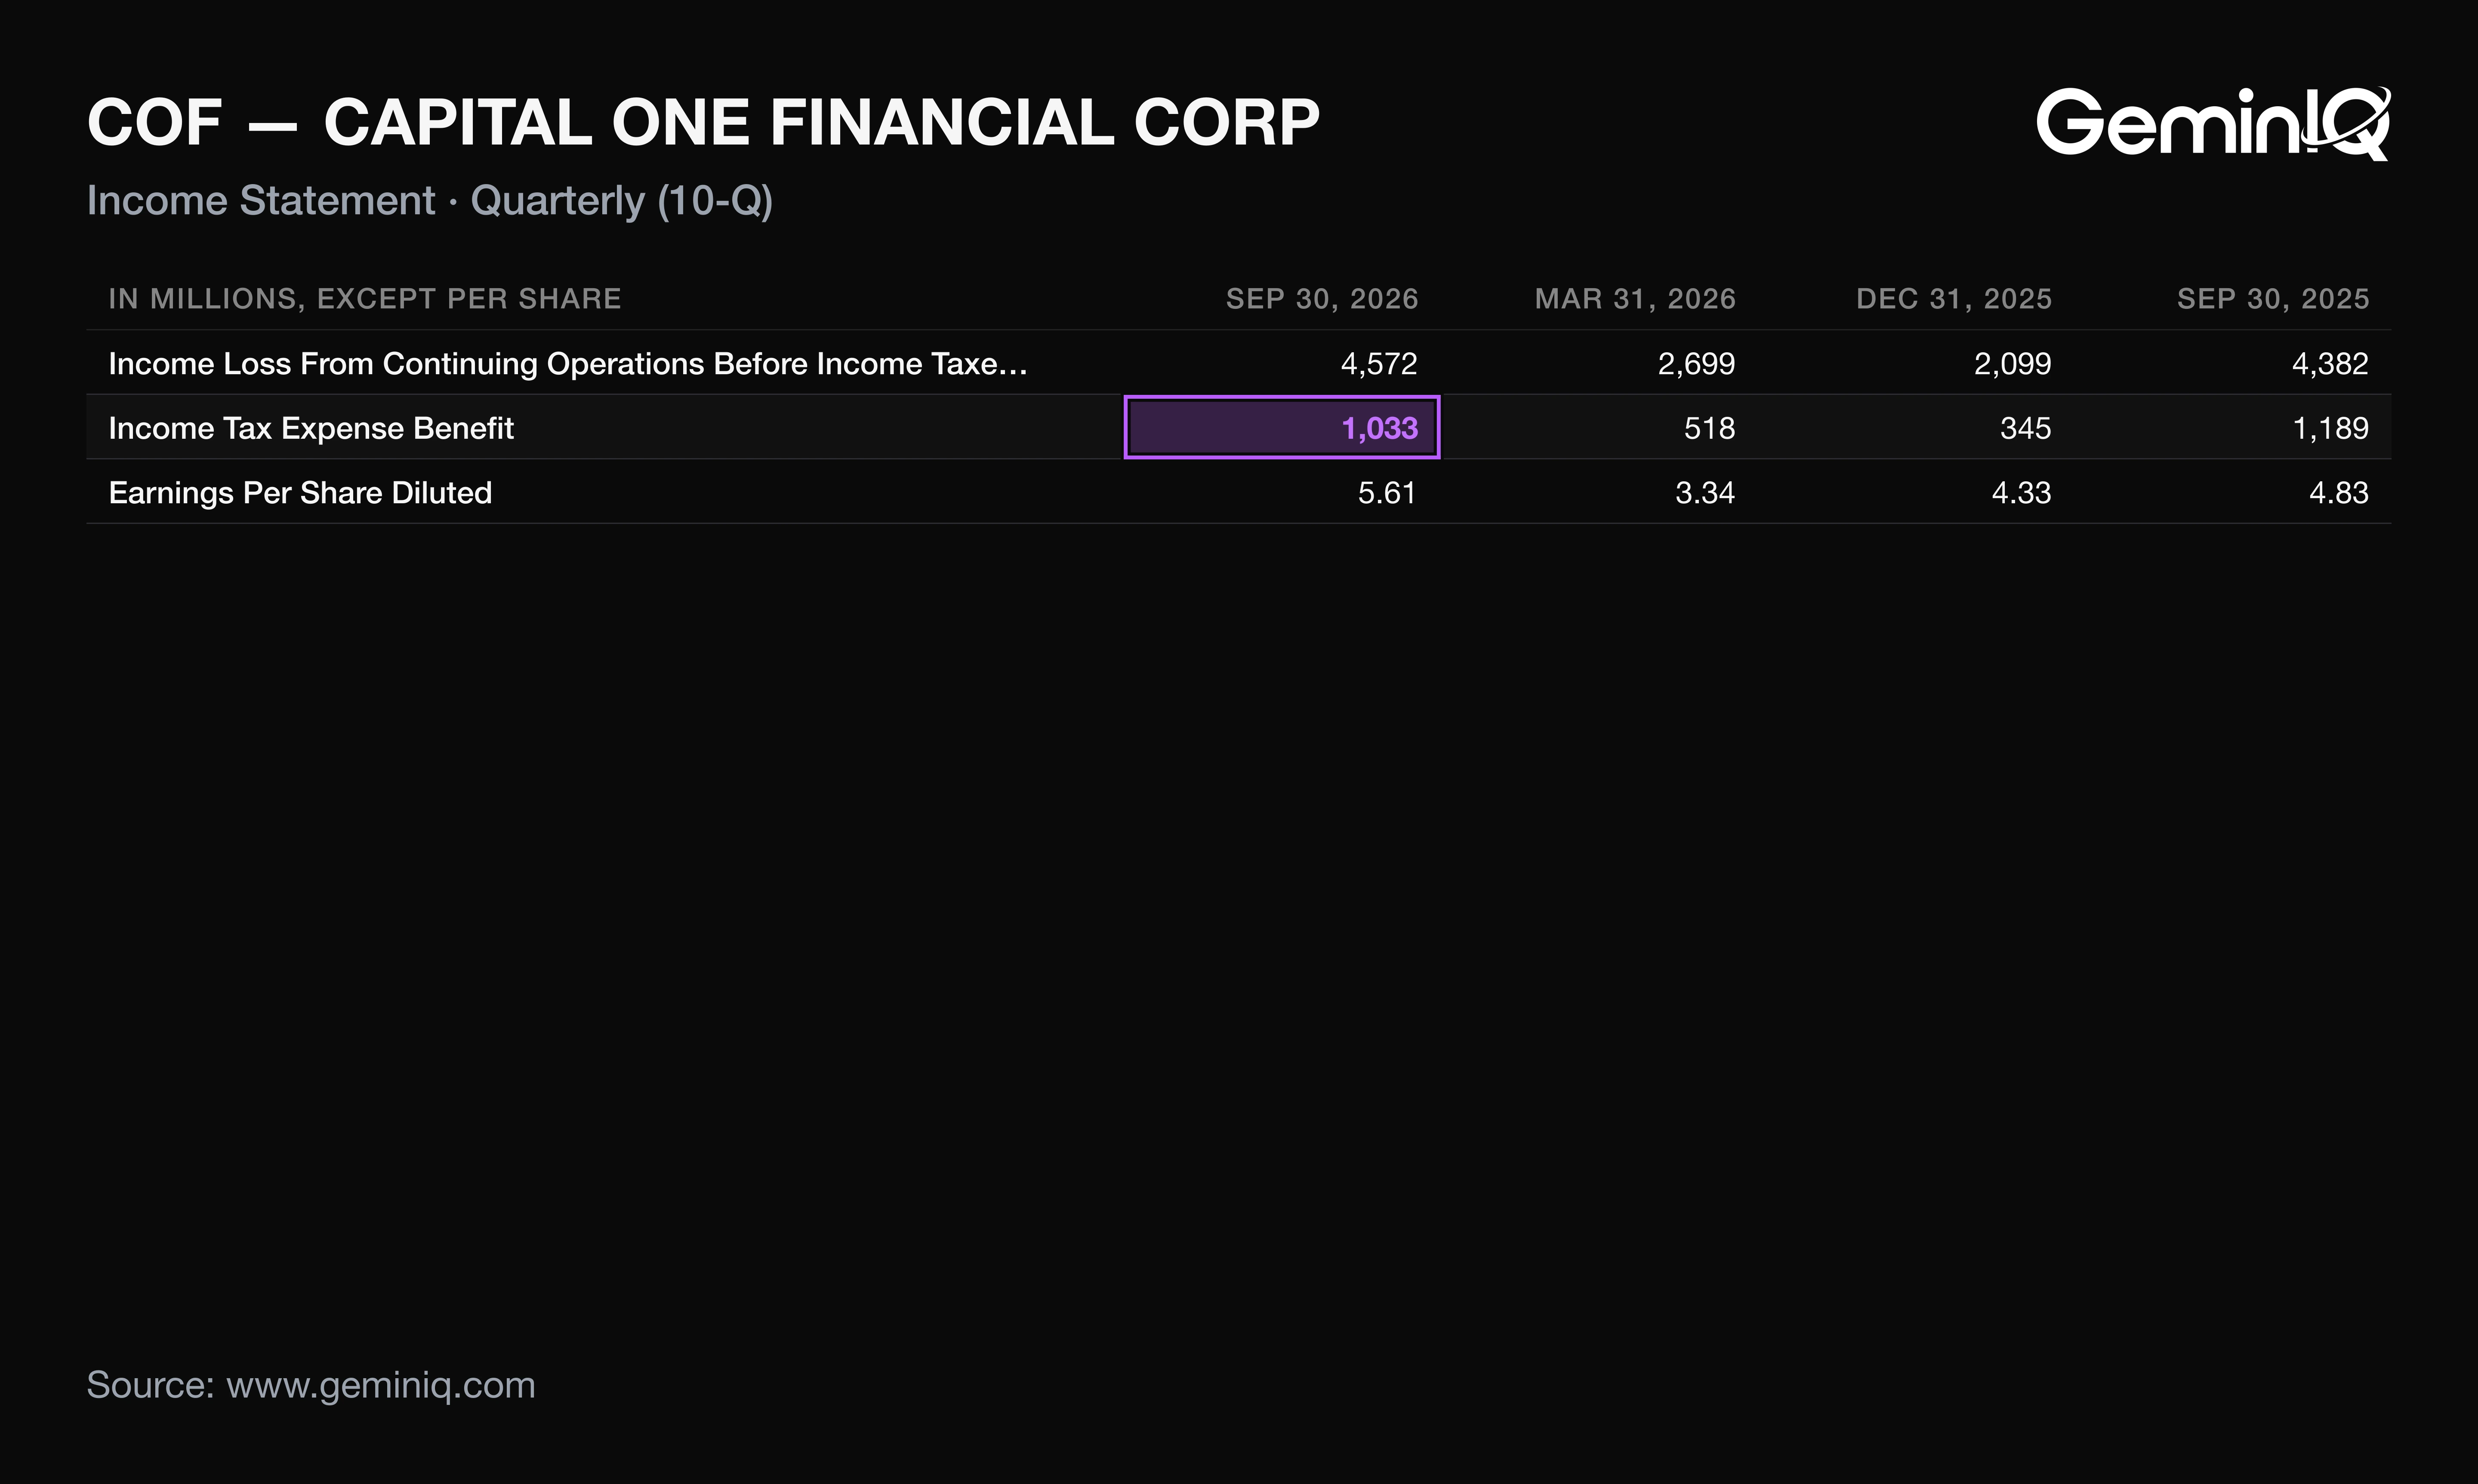
Margins moved less than EPS: pretax income was 28.0% of net revenue, 0.6 points below a year earlier. A repeat of the 27.1% tax rate would remove more than two-fifths of the quarter's EPS growth.
What Capital One's Q3 2026 10-Q Shows Beyond the Press Release
Capital One's net revenue rose $985 million to $16.34 billion, and the 10-Q traces $503 million of that to non-interest income rather than lending. The release led with a net interest margin up 40 basis points from Q2 and adjusted EPS; the filing measures against Q3 2025.
The Data: Net interest margin was 8.41%, up 5 basis points year over year. Credit card interest income was $12,112 million against $12,109 million, flat, as the card yield slipped to 17.70% from 17.99%. Discount and interchange fees rose to $2,335 million from $1,812 million, up 29%. The MD&A credits higher purchase volume ($254.7 billion, up 11%) and reissuing legacy Capital One debit cards onto the Global Payment Network, whose volume rose 25% to $190.9 billion.
Why: Net interest income rose $482 million, but the rate and volume table shows $371 million of the benefit came from cheaper deposits, which cost 2.94% against 3.27%. The loan book itself earned slightly less per dollar. Per the 8-K, adjusting items total $1.08 a share: $0.60 of acquisition amortization, $0.42 of Discover integration cost and $0.06 for Brex. That is 16% of the $6.69 adjusted figure. Discover integration expenses reached $338 million in the quarter, $1.1 billion over nine months, up $294 million, and $2.4 billion since the deal's announcement in Q1 2024, so the excluded cost is still growing.
Capital One Q3 2026 Buybacks, Dividends and Capital Ratios
Capital One repurchased $2.6 billion of stock in Q3 2026 and $7.9 billion over nine months, equal to 90% of nine-month net income of $8.7 billion. Add $1.5 billion of common dividends and the $9.4 billion returned exceeded what the company earned.
The Data: Period-end shares were 601.5 million, down 5% from 635.7 million. The common equity Tier 1 ratio was 13.8%, against 14.3% at December 31, 2025, and the tangible common equity ratio was 9.8% against 10.7%. Tangible book value per share was $102.72 against $105.18 a year earlier. The quarterly dividend was $0.80 per share, up 33% from $0.60.
Why: Stockholders' equity fell $4.0 billion to $109.7 billion in nine months, which the MD&A attributes to net treasury stock purchases and higher unrealized securities losses, partly offset by net income. Buybacks also had to outrun the 10.6 million shares issued in the April Brex acquisition. EPS grew 16% while tangible book value per share fell 2%.
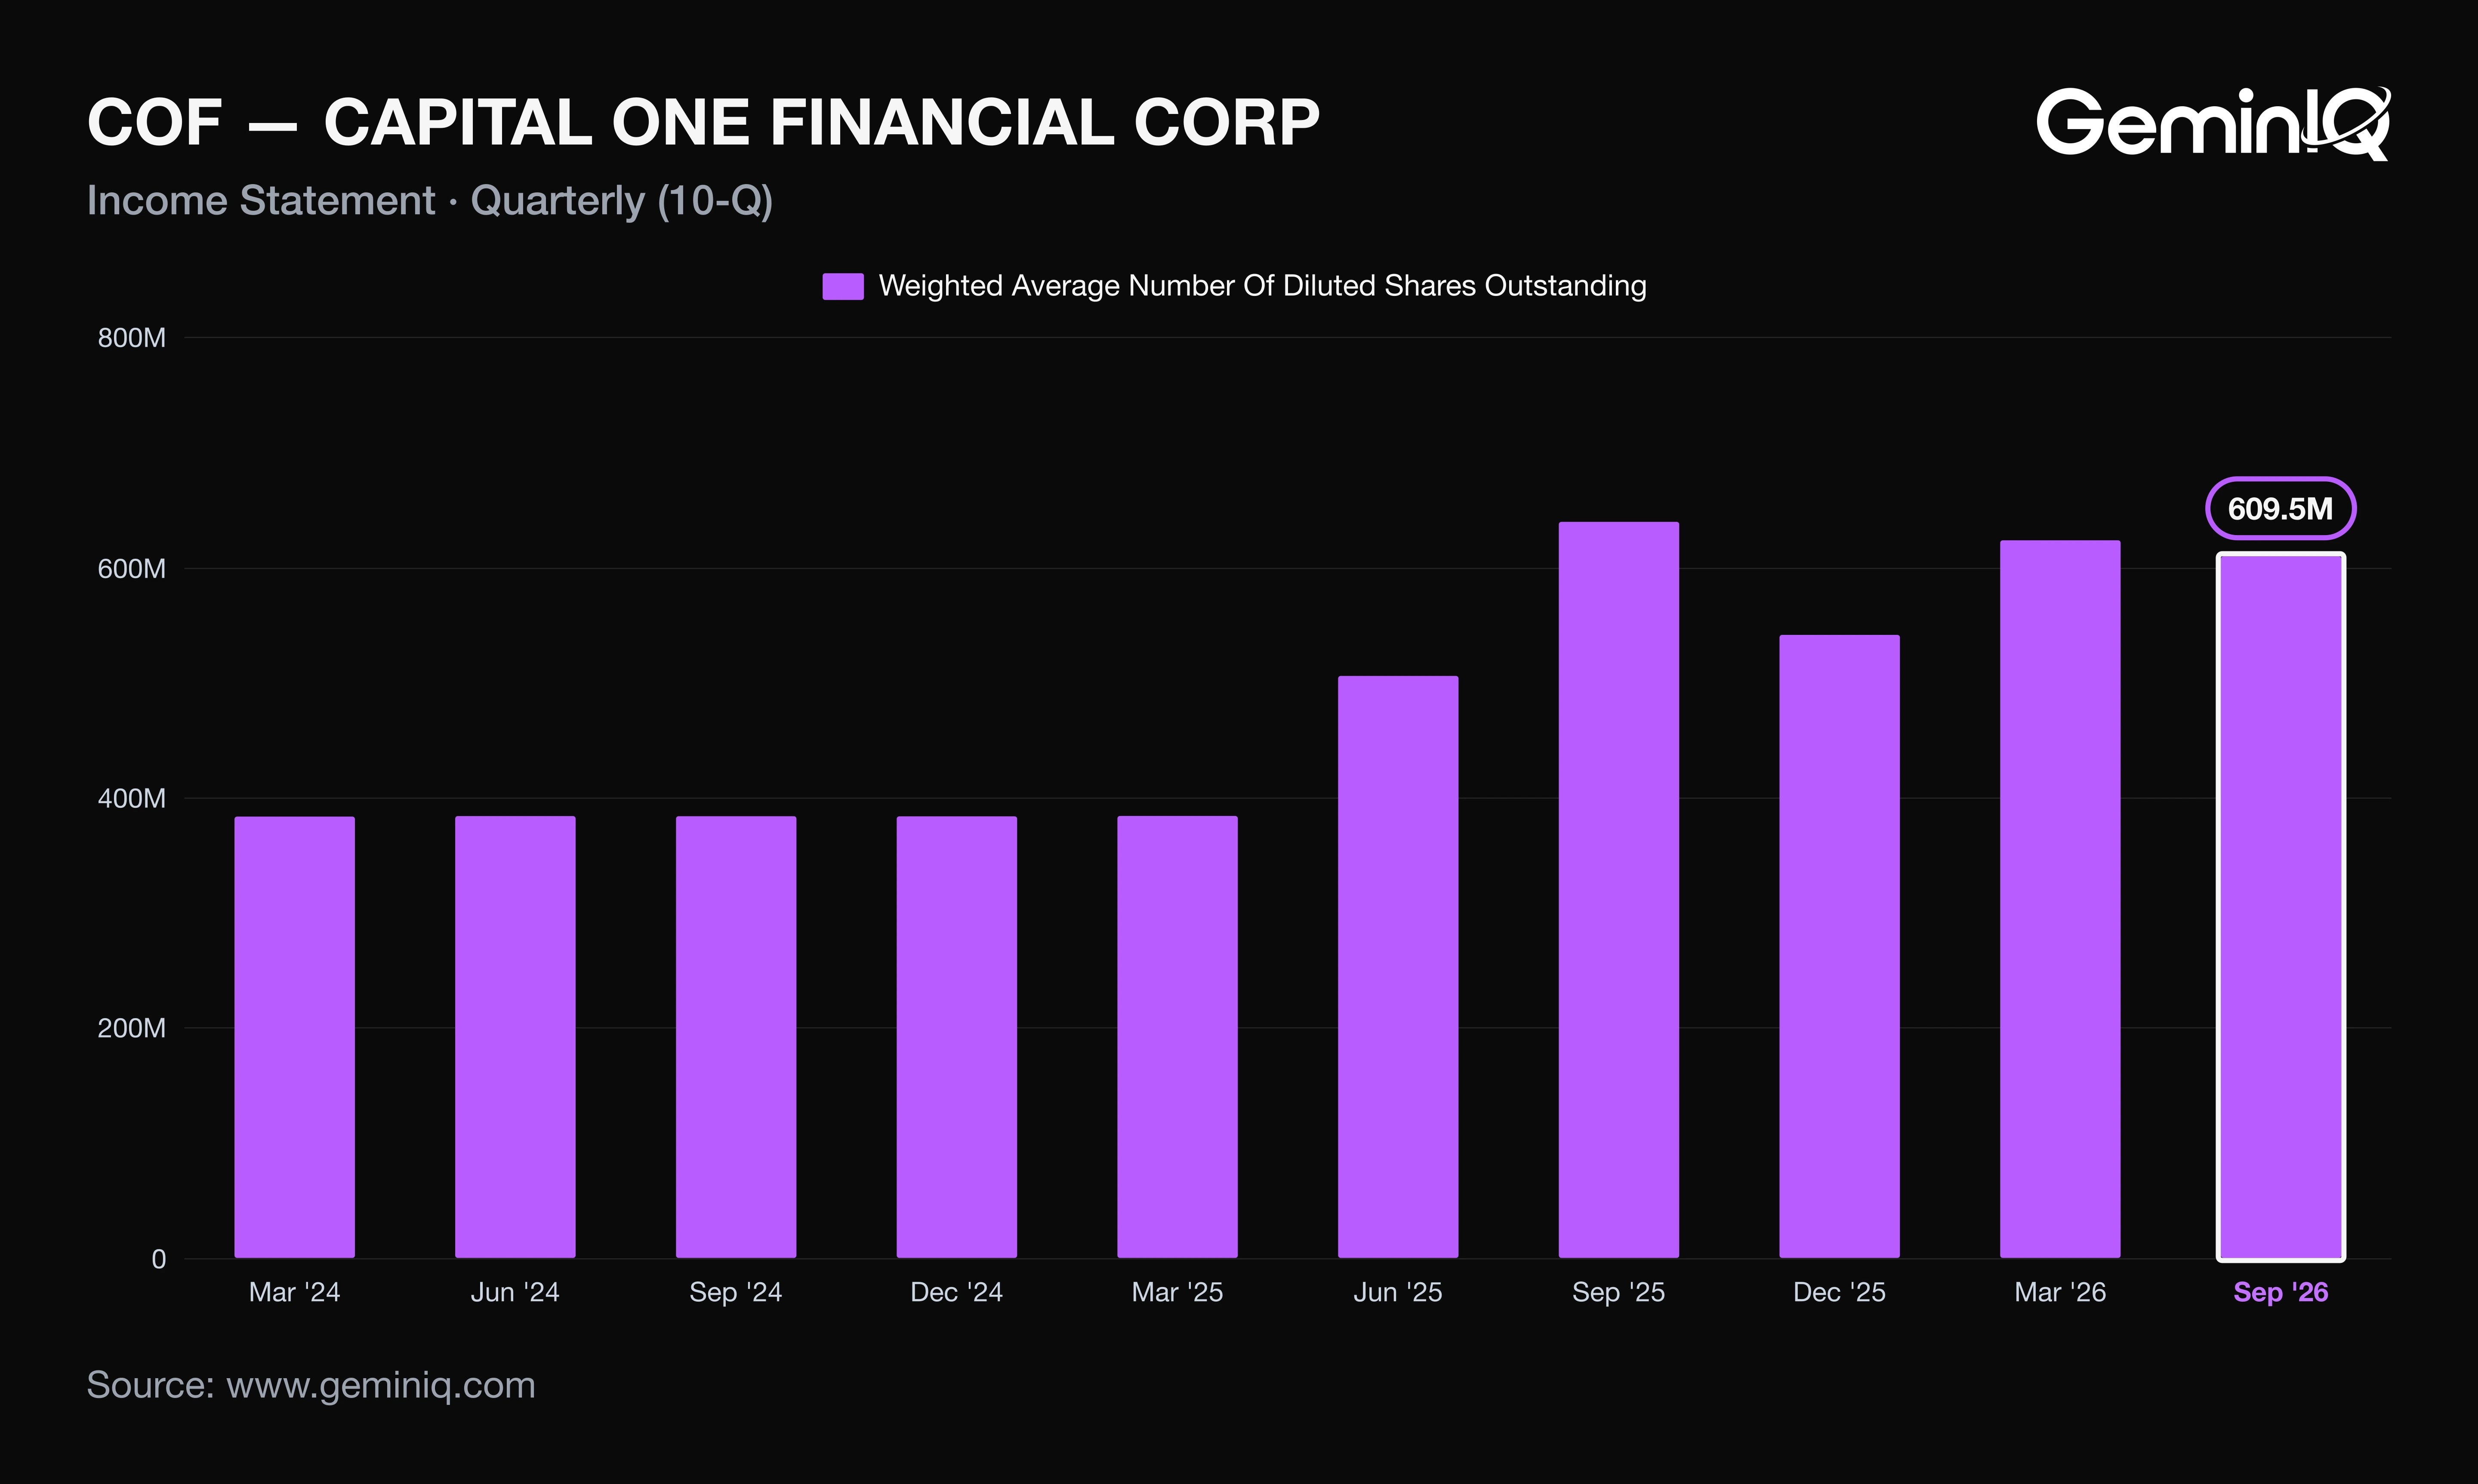
When a lender returns more than it earns, per-share earnings can rise while per-share capital falls, and the capital ratio is where the difference shows up.
How COF Stock Has Moved After Past Earnings Reports
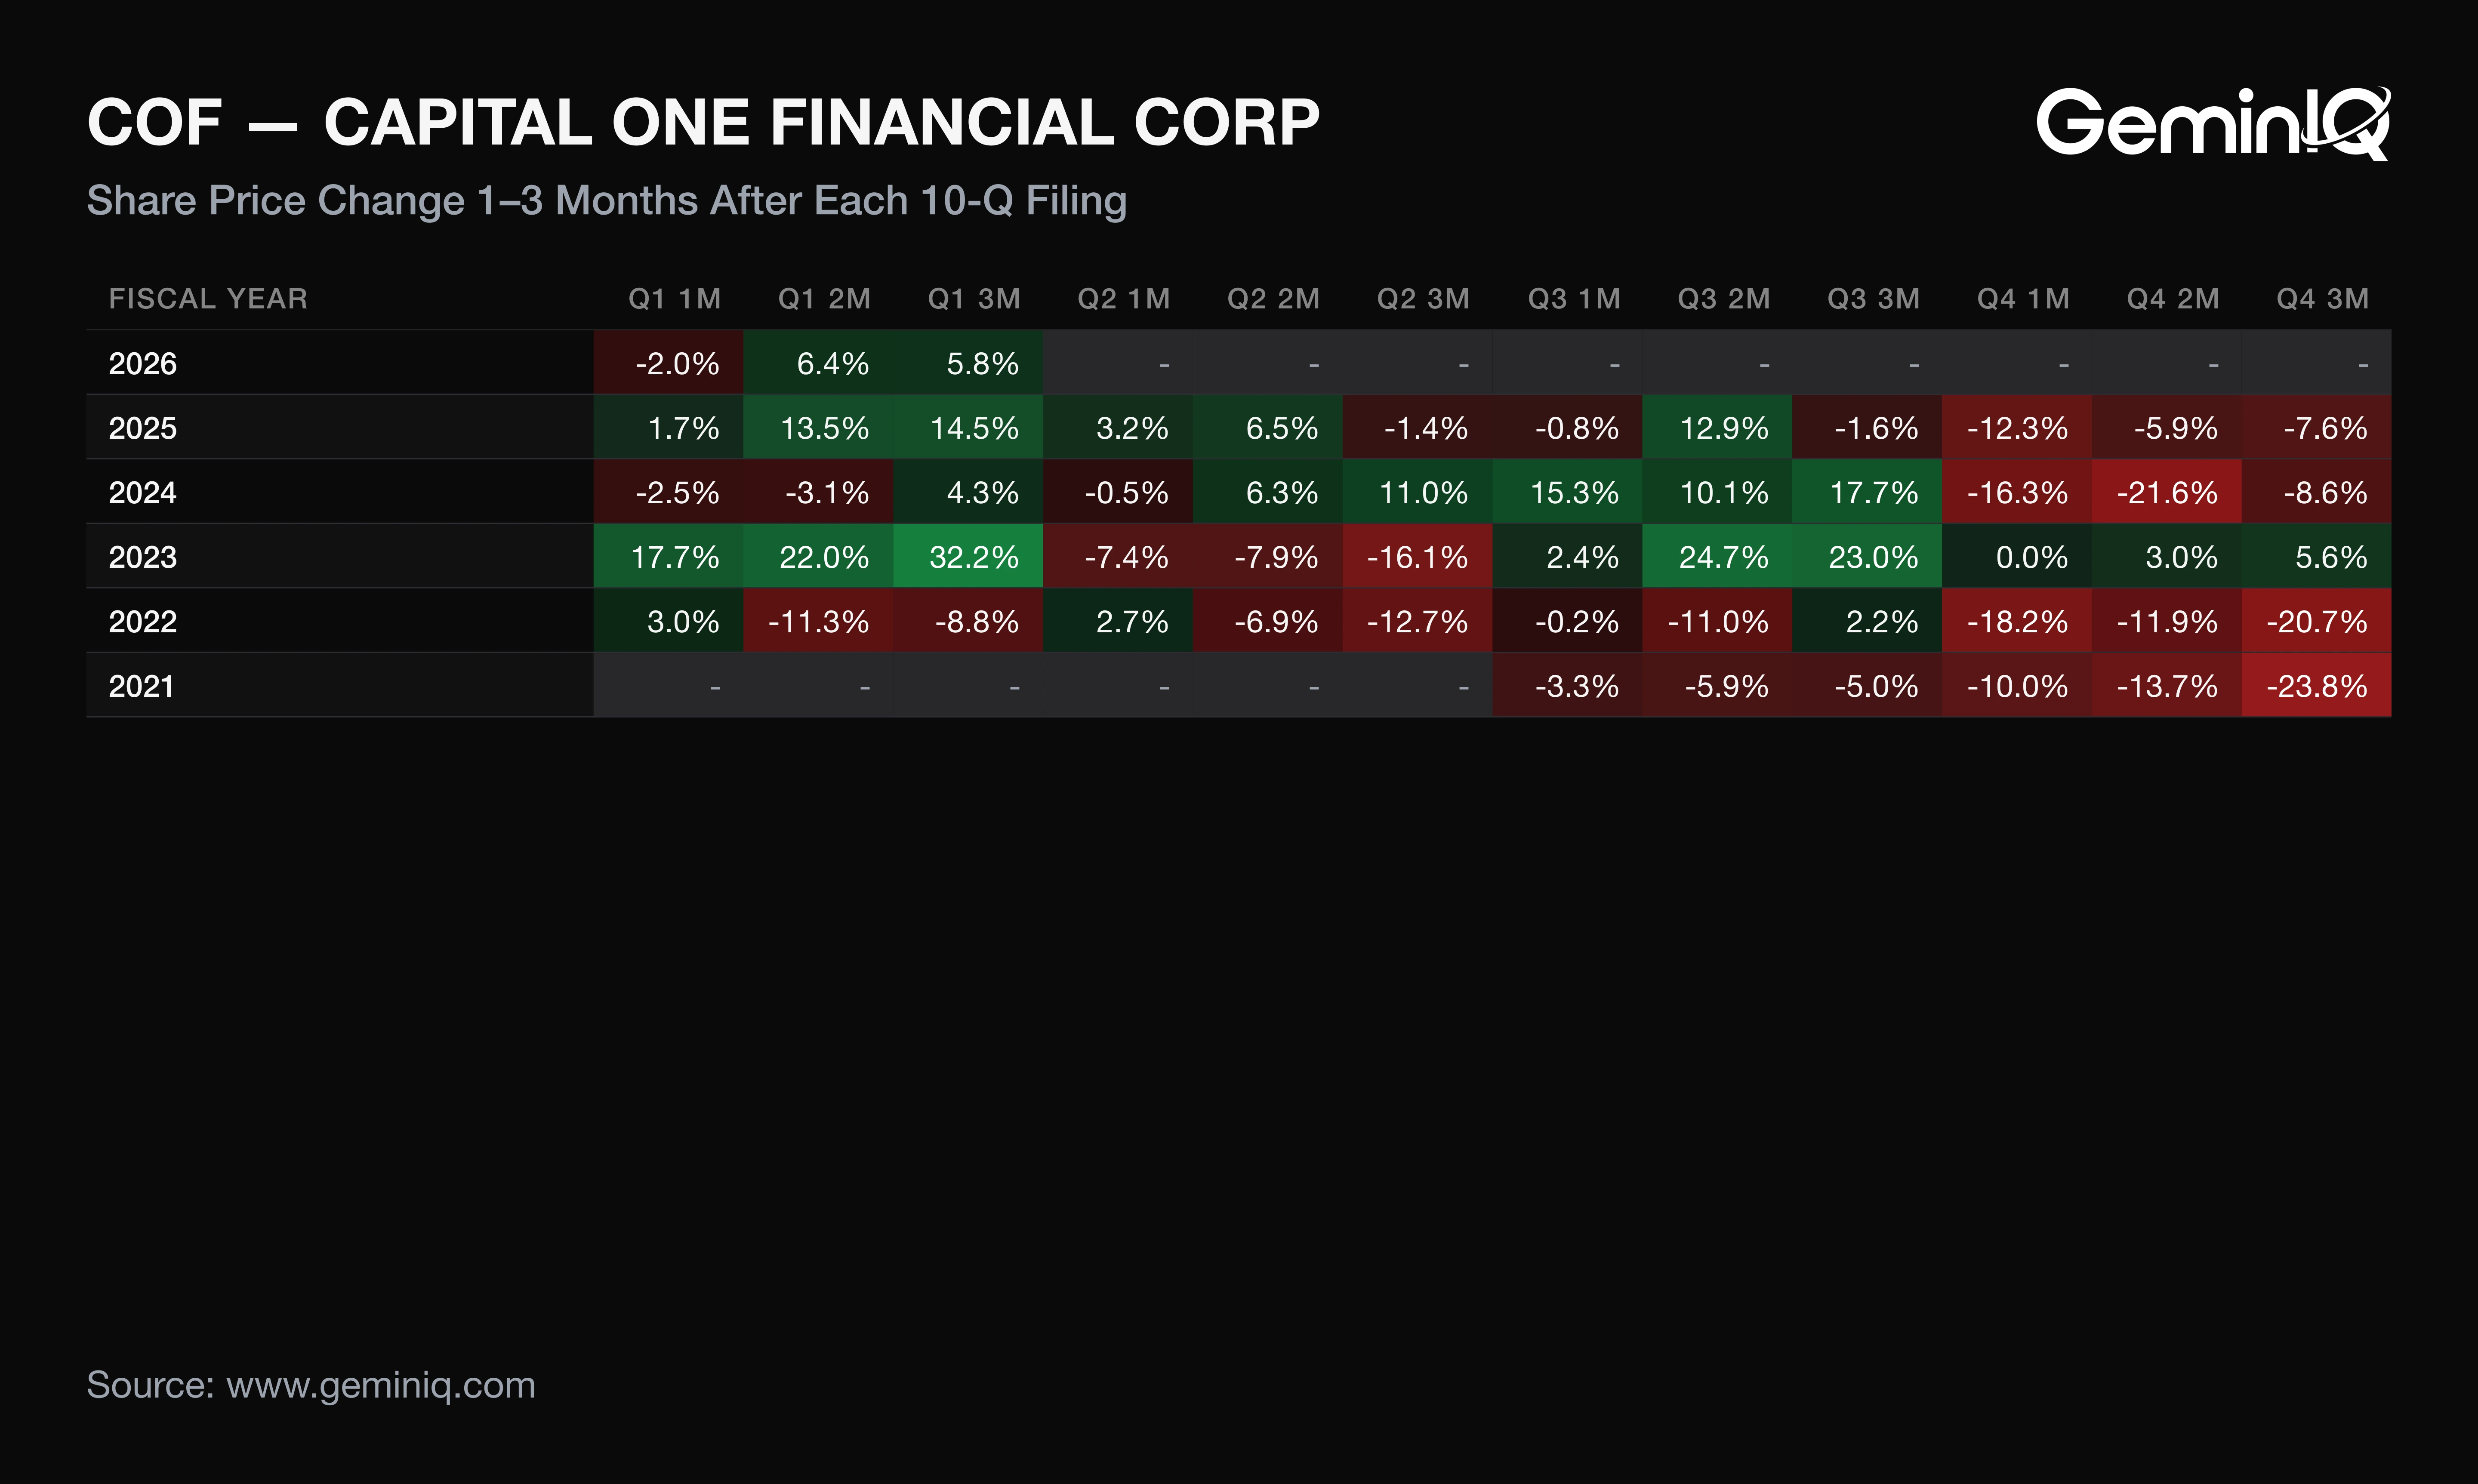
Across Capital One's last 12 10-Q filings with a completed one-month window (filed July 2023 to May 2026), the median one-month return was -0.7%, positive after only 4 of 12. The three-month median was +5.7%, positive after 8 of 12. These figures describe how Capital One's stock moved after its past filings; they are a historical association, not a forecast.
The Data: One-month returns ranged from -16.3% (filed February 2025) to +15.3% (filed October 2024). After the last three Q3 filings, one-month returns were +2.4%, +15.3% and -0.8%. This filing's window has not yet elapsed. The GeminIQ Earnings Reaction Heat Map is below.
Why: A negative one-month median alongside a positive three-month median means the typical window recovered after its first month, and a 31.6-point one-month range means the median describes few individual filings.
Insider selling grew over the same stretch. In the 12 months of Form 4 filings from September 15, 2025 to September 15, 2026, insiders filed 42 sales totaling $89.3 million and no purchases, against 14 sales totaling $20.2 million in the prior 12 months; the most recent purchase was May 23, 2022. Richard Fairbank accounted for $46.1 million, 52% of the dollars, and Neal Blinde for 19%. The latest 13F, as of June 30, 2026, put institutional ownership at 84.02%; the September quarter's 13F had not yet been filed.
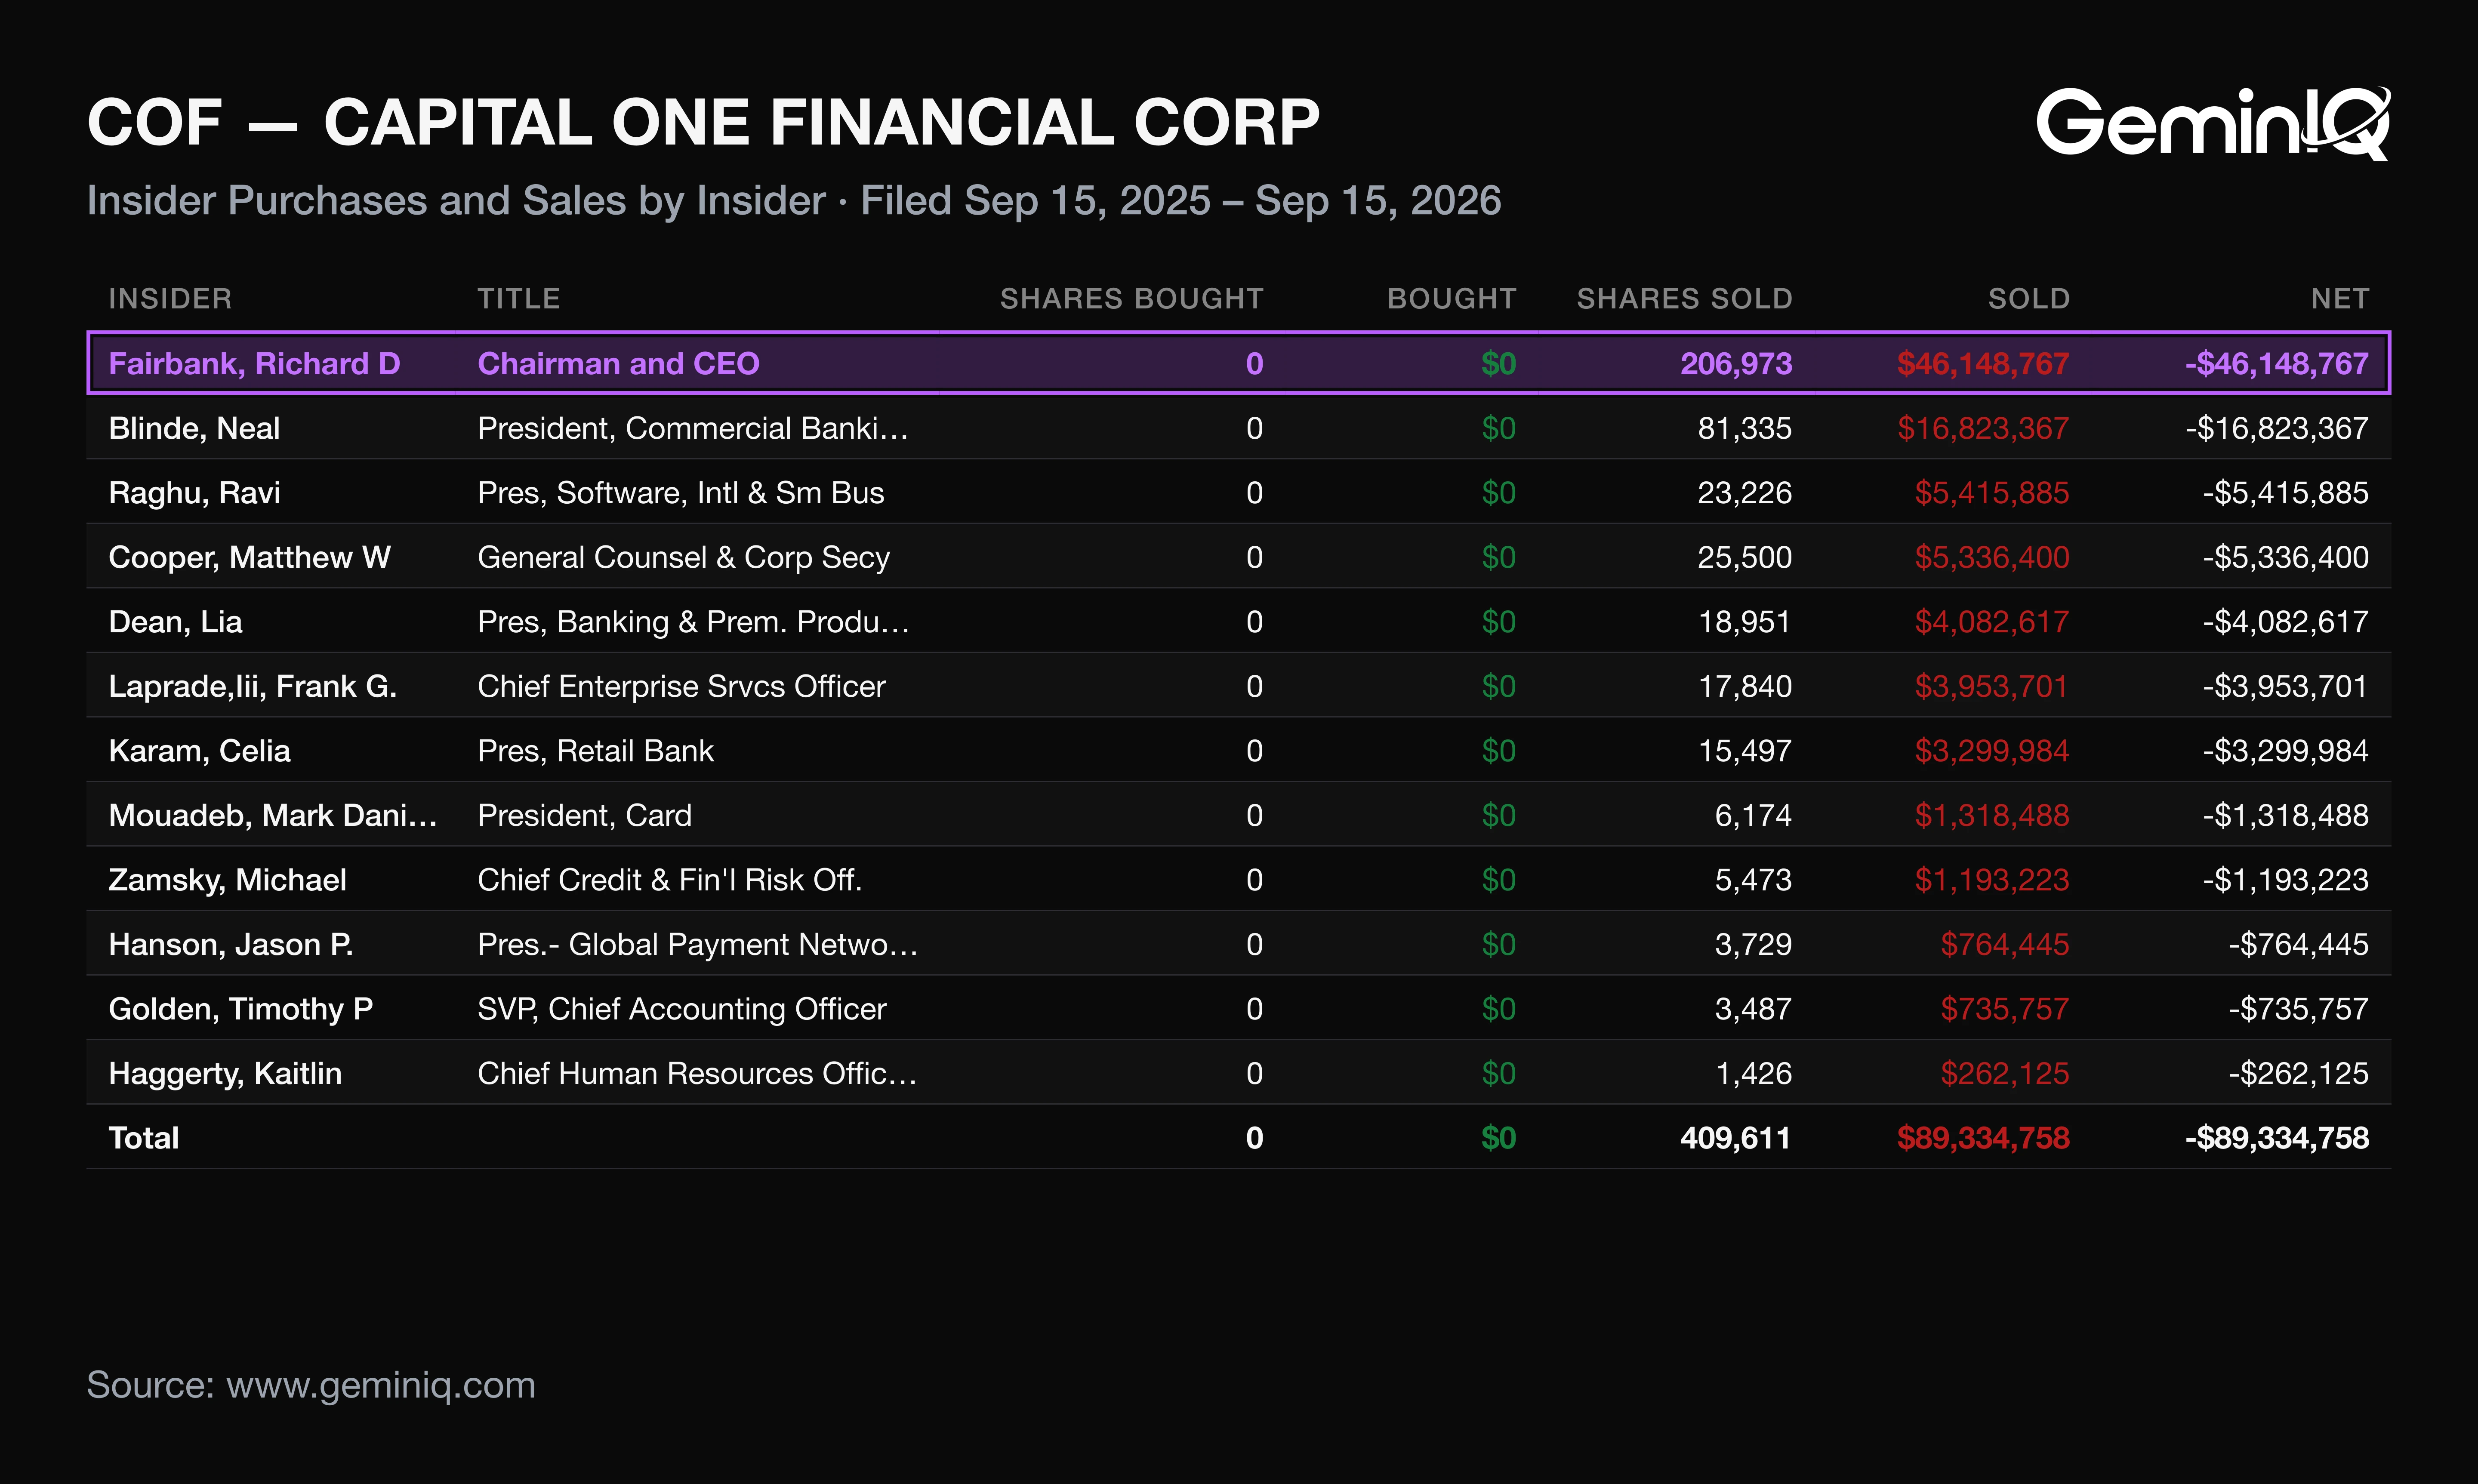
When one name supplies half the dollars, insider selling describes one holder's plans more than a broad shift among executives.
Frequently Asked Questions
When does Capital One report earnings?
Capital One reported Q3 2026 results on October 20, 2026 and filed its 10-Q on November 3, 2026. Last year it filed its fourth-quarter results on February 19, 2026. That is a pattern from the filing record, not a forecast of the next date.
Does Capital One pay a dividend?
Yes. Capital One declared and paid $0.80 per common share in Q3 2026, up 33% from $0.60 a year earlier, and $2.40 per share over the first nine months. Common dividends in Q3 totaled $491 million.
Is Capital One doing well financially?
Capital One earned $3.5 billion in Q3 2026 and $8.7 billion over nine months, against $319 million in the first nine months of 2025, which carried the initial Discover loan allowance. The net charge-off rate was 2.73% against 3.16% a year earlier, and the CET1 capital ratio was 13.8%.
What is Capital One's current revenue?
Capital One's total net revenue was $16.34 billion in Q3 2026, up 6.4% from $15.36 billion. Over nine months it was $47.4 billion, up 25% from $37.9 billion, largely because Discover was included from May 18, 2025.
Wall Street's data. Main Street's price.
Institutional terminals charge thousands a year for as-filed accuracy. GeminIQ gives you the same thing for a fraction of the cost: financials built directly from raw SEC EDGAR filings, not third-party APIs, with full XBRL traceability back to the original 10-K or 10-Q. No normalized guesswork, just calculated metrics, charts, screeners, and watchlists built on numbers exactly as the company reported them. Start researching now at GeminIQ.com.
All financial figures cited in this article reference CAPITAL ONE FINANCIAL CORPORATION's Q3 2026 10-Q (filed November 3, 2026, period ending September 30, 2026), with guidance and management commentary drawn from the company's Form 8-K earnings release (filed October 20, 2026). All SEC filings are publicly available at SEC EDGAR and SEC EDGAR.
Disclaimer: The content in this blog is for educational and entertainment purposes only and does not constitute financial, legal, or tax advice. Investing involves risk, including the loss of principal. The views expressed are my own and not intended as financial advice or a guarantee of future performance.