
Carvana Stock Crash and Recovery: What the Filings Showed

By Chad Hartman
Published · Last updated
Carvana ($CVNA) closed out 2022 at $0.95 a share — down 98.4% from the $60.36 it traded at eighteen months earlier. The company had just burned through more than a billion dollars in a single quarter and posted negative shareholders' equity for the first time in its public history. By the quarter ended March 31, 2026, that same share closed at $62.88, having touched as high as $84.40 along the way — a recovery of more than 6,500% off the bottom. The story everyone tells is that Carvana nearly collapsed under a reckless, debt-funded expansion and then staged one of the great comeback rallies in recent market history, more on momentum than on anything visible in the numbers. But standard financial media doesn't read the footnotes twice — once for the fall, and again for the turn. Read Carvana's own 10-Ks and 10-Qs in the order they were filed, and both moves are sitting in the filed record. A debt and inventory buildup stacked three warning signs deep while the stock still traded in the twenties. An operating turnaround showed up in the income statement a full quarter before the balance-sheet fix that grabbed the headlines — and the company's own founders bought heavily on the way down, still missing the actual bottom by seven months and another 95% decline.
Every figure below is drawn from Carvana Co.'s own 10-K and 10-Q filings, filed between June 2017 and April 2026 — 37 consecutive quarterly filings (9 10-Ks and 28 10-Qs) spanning Carvana's first quarter as a public company through the quarter ended March 31, 2026 — read in the order they were filed and joined to how the stock actually traded in the one to three months after each 10-Q hit SEC EDGAR, and the twelve months after each 10-K.
The Bet on Bigger
Heading into 2022, the market's read on Carvana was simple: the fastest-growing online used-car retailer in the country was scaling into a durable logistics advantage, and every dollar of new debt was buying market share nobody else could touch.
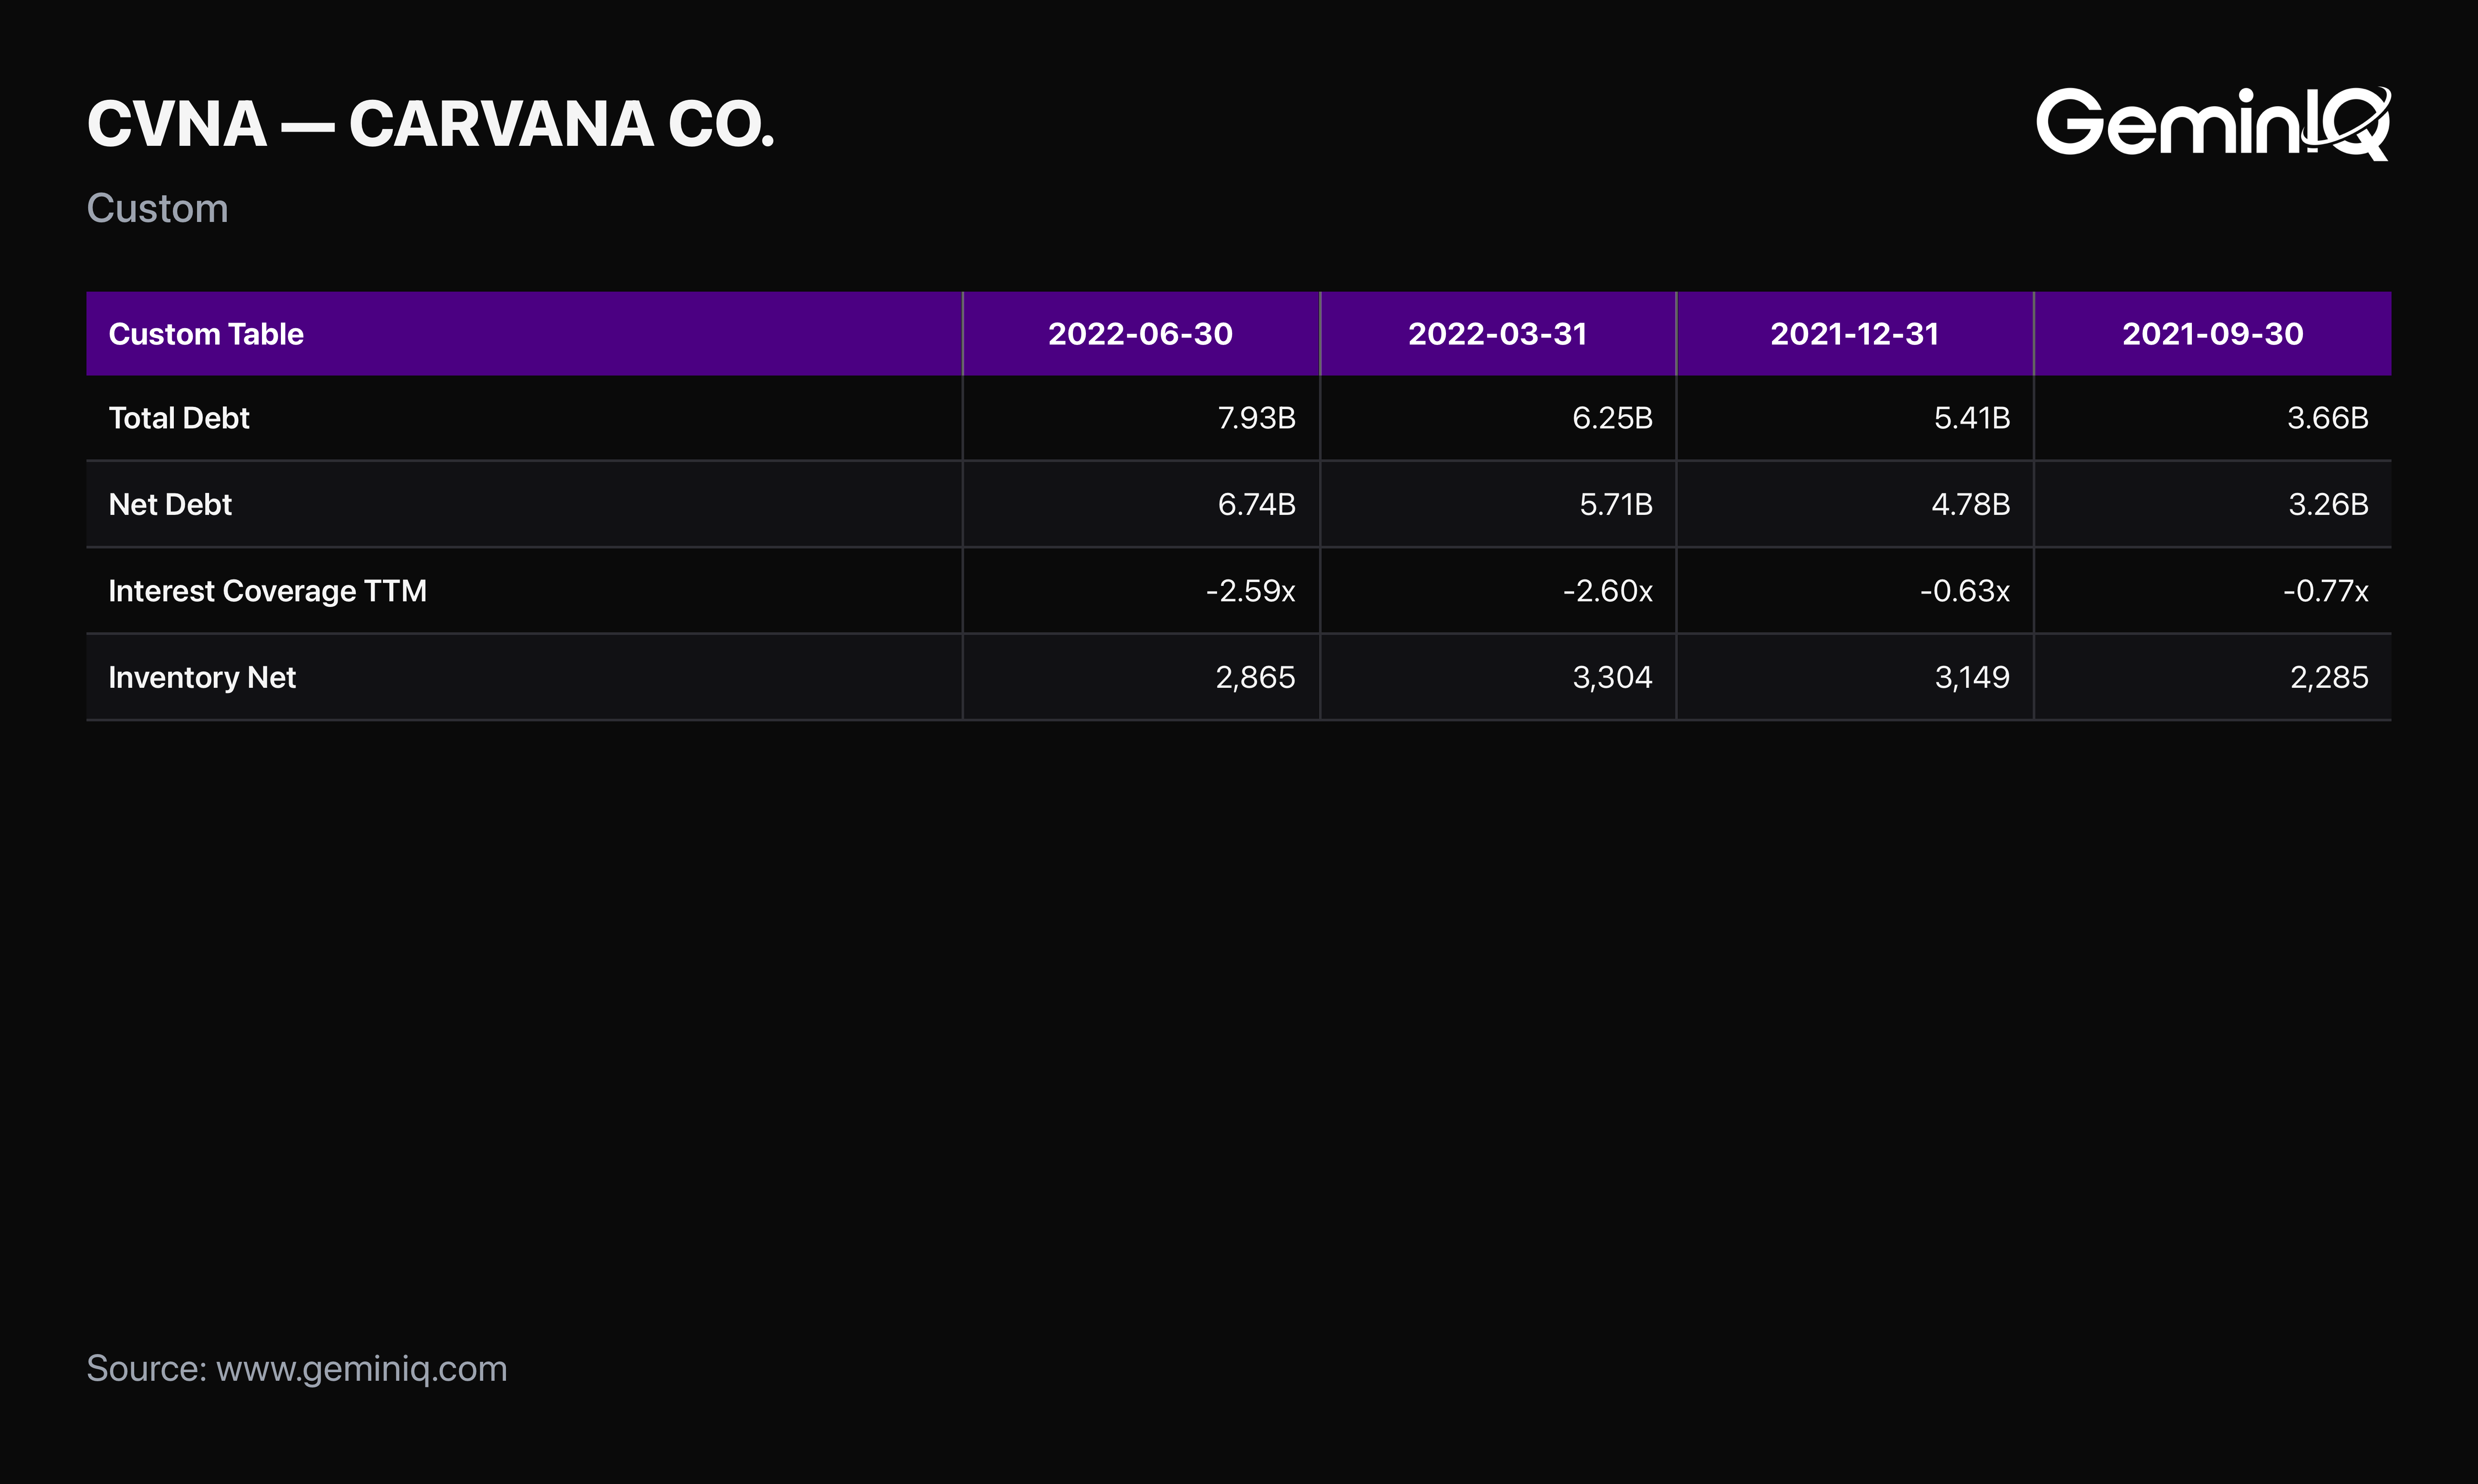
The Filing Data: Carvana's Total Debt climbed from $3.66 Billion in the September 2021 quarter to $5.41 Billion by December 2021 — a 47.8% jump in a single quarter. It kept climbing, to $6.25 Billion by March 2022 and $7.94 Billion by June 2022, more than doubling in three quarters. Net Debt moved in lockstep, from $3.26 Billion to $6.74 Billion over the same stretch. Vehicle Inventory grew even faster in percentage terms, from $1.44 Billion in the March 2021 quarter to $3.30 Billion by March 2022 — up 129.6% year-over-year. The FY2022 10-K separately shows $2.20 Billion under Payment For Acquisitions, Net Of Cash Acquired, the cash portion of a major physical-infrastructure purchase completed that year and layered on top of the new debt. Trailing-twelve-month Interest Expense rose from $176 Million in December 2021 to $486 Million by December 2022 — a 176% increase — and the Interest Coverage Ratio had already gone negative well before that climb finished, reading -0.63x in December 2021 and -2.60x by March 2022.
The Signal: A company whose operating earnings can't cover its interest expense before that expense has even finished climbing isn't scaling into an advantage — it's financing a bet that requires the growth rate to hold. Carvana's growth rate wouldn't hold.
The Inventory Nobody Could Move
By mid-2022, used-car pricing across the industry was cooling from its pandemic peak, and the sell-side narrative shifted to "sector-wide normalization" rather than company-specific distress. That framing gave Carvana's own numbers less scrutiny than they deserved.
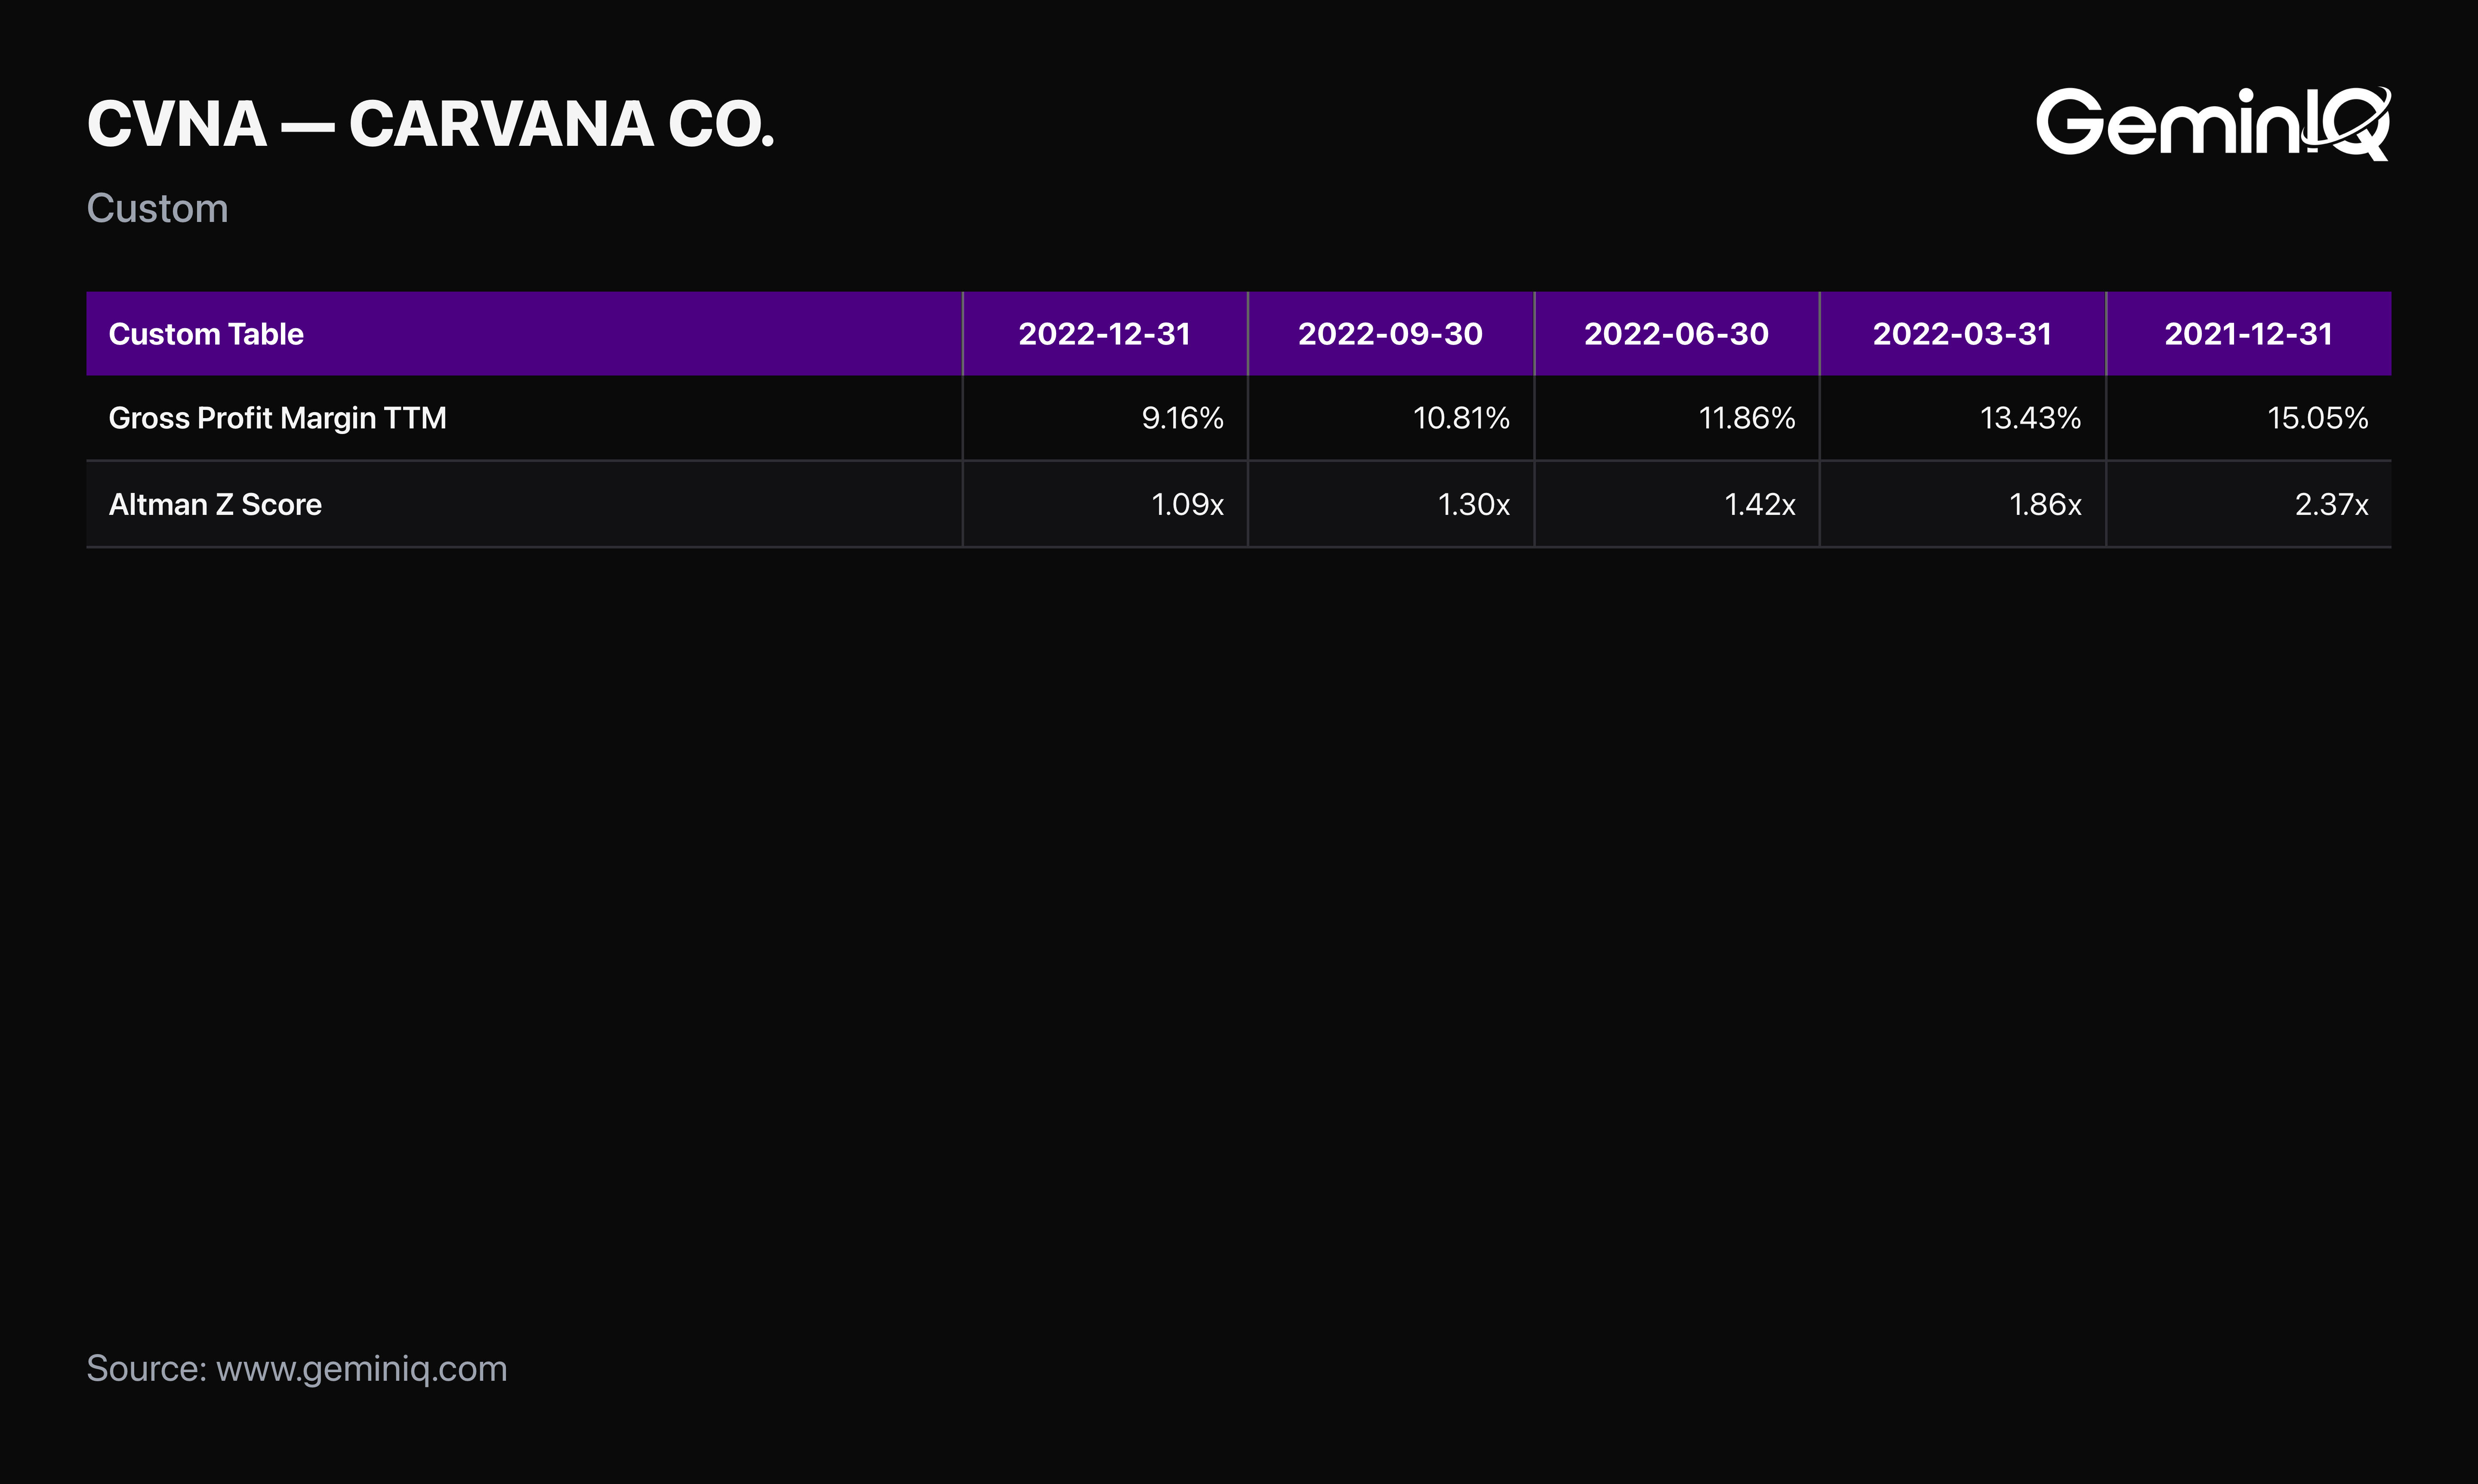
The Filing Data: Gross Profit Margin fell from 15.1% trailing-twelve-months in December 2021 to 13.4% in March 2022, 11.9% in June, 10.8% in September, and 9.2% by December 2022 — the low point in this entire record. Net Income (Loss) Attributable To Carvana Co. on a trailing basis worsened from -$757 Million in March 2022 to -$1.59 Billion by December 2022, while Free Cash Flow bottomed at -$3.35 Billion trailing-twelve-months in the March 2022 quarter. By December 2022, Retained Earnings (Accumulated Deficit) had reached -$2.08 Billion, and Total Shareholders' Equity turned negative for the first time in Carvana's public history, at -$1.05 Billion. The Altman Z-Score fell from 1.86 in March 2022 to 1.42 in June, 1.30 in September, and 1.09 by December — deep in the distress zone below the 1.81 threshold for five straight quarters. Carvana's stock closed those same four quarters at $23.86, $4.52, $4.06, and finally $0.95.
The market's own reaction lagged the filings by a step. The FY2021 10-K, filed February 24, 2022, was followed by a cumulative one-month return of +13.0% — the stock didn't even react immediately — before reversing into a cumulative three-month return of -69.6% and a twelve-month return of -94.9%. The September 2022 10-Q, filed November 3, 2022, was followed by a cumulative three-month return of -54.8%, after dipping as low as -71.8% two months in.
The Signal: Five consecutive quarters in Altman's distress zone, a first-ever negative equity print, and a gross margin cut nearly in half — none of that is a sector-wide repricing story. It's a single company's balance sheet buckling in plain sight, a full quarter before the worst of the stock's decline had even happened.
The Founders Bought In — Just Not at the Bottom
While the balance sheet cracked in full view, the people running the company were buying more of it. A common assumption among investors is that insider buying, especially from a company's own founders, is close to a reliable timing signal — when the people who know the business best start spending their own money, the bottom can't be far off. Carvana's own Form 4 record tests that assumption directly.
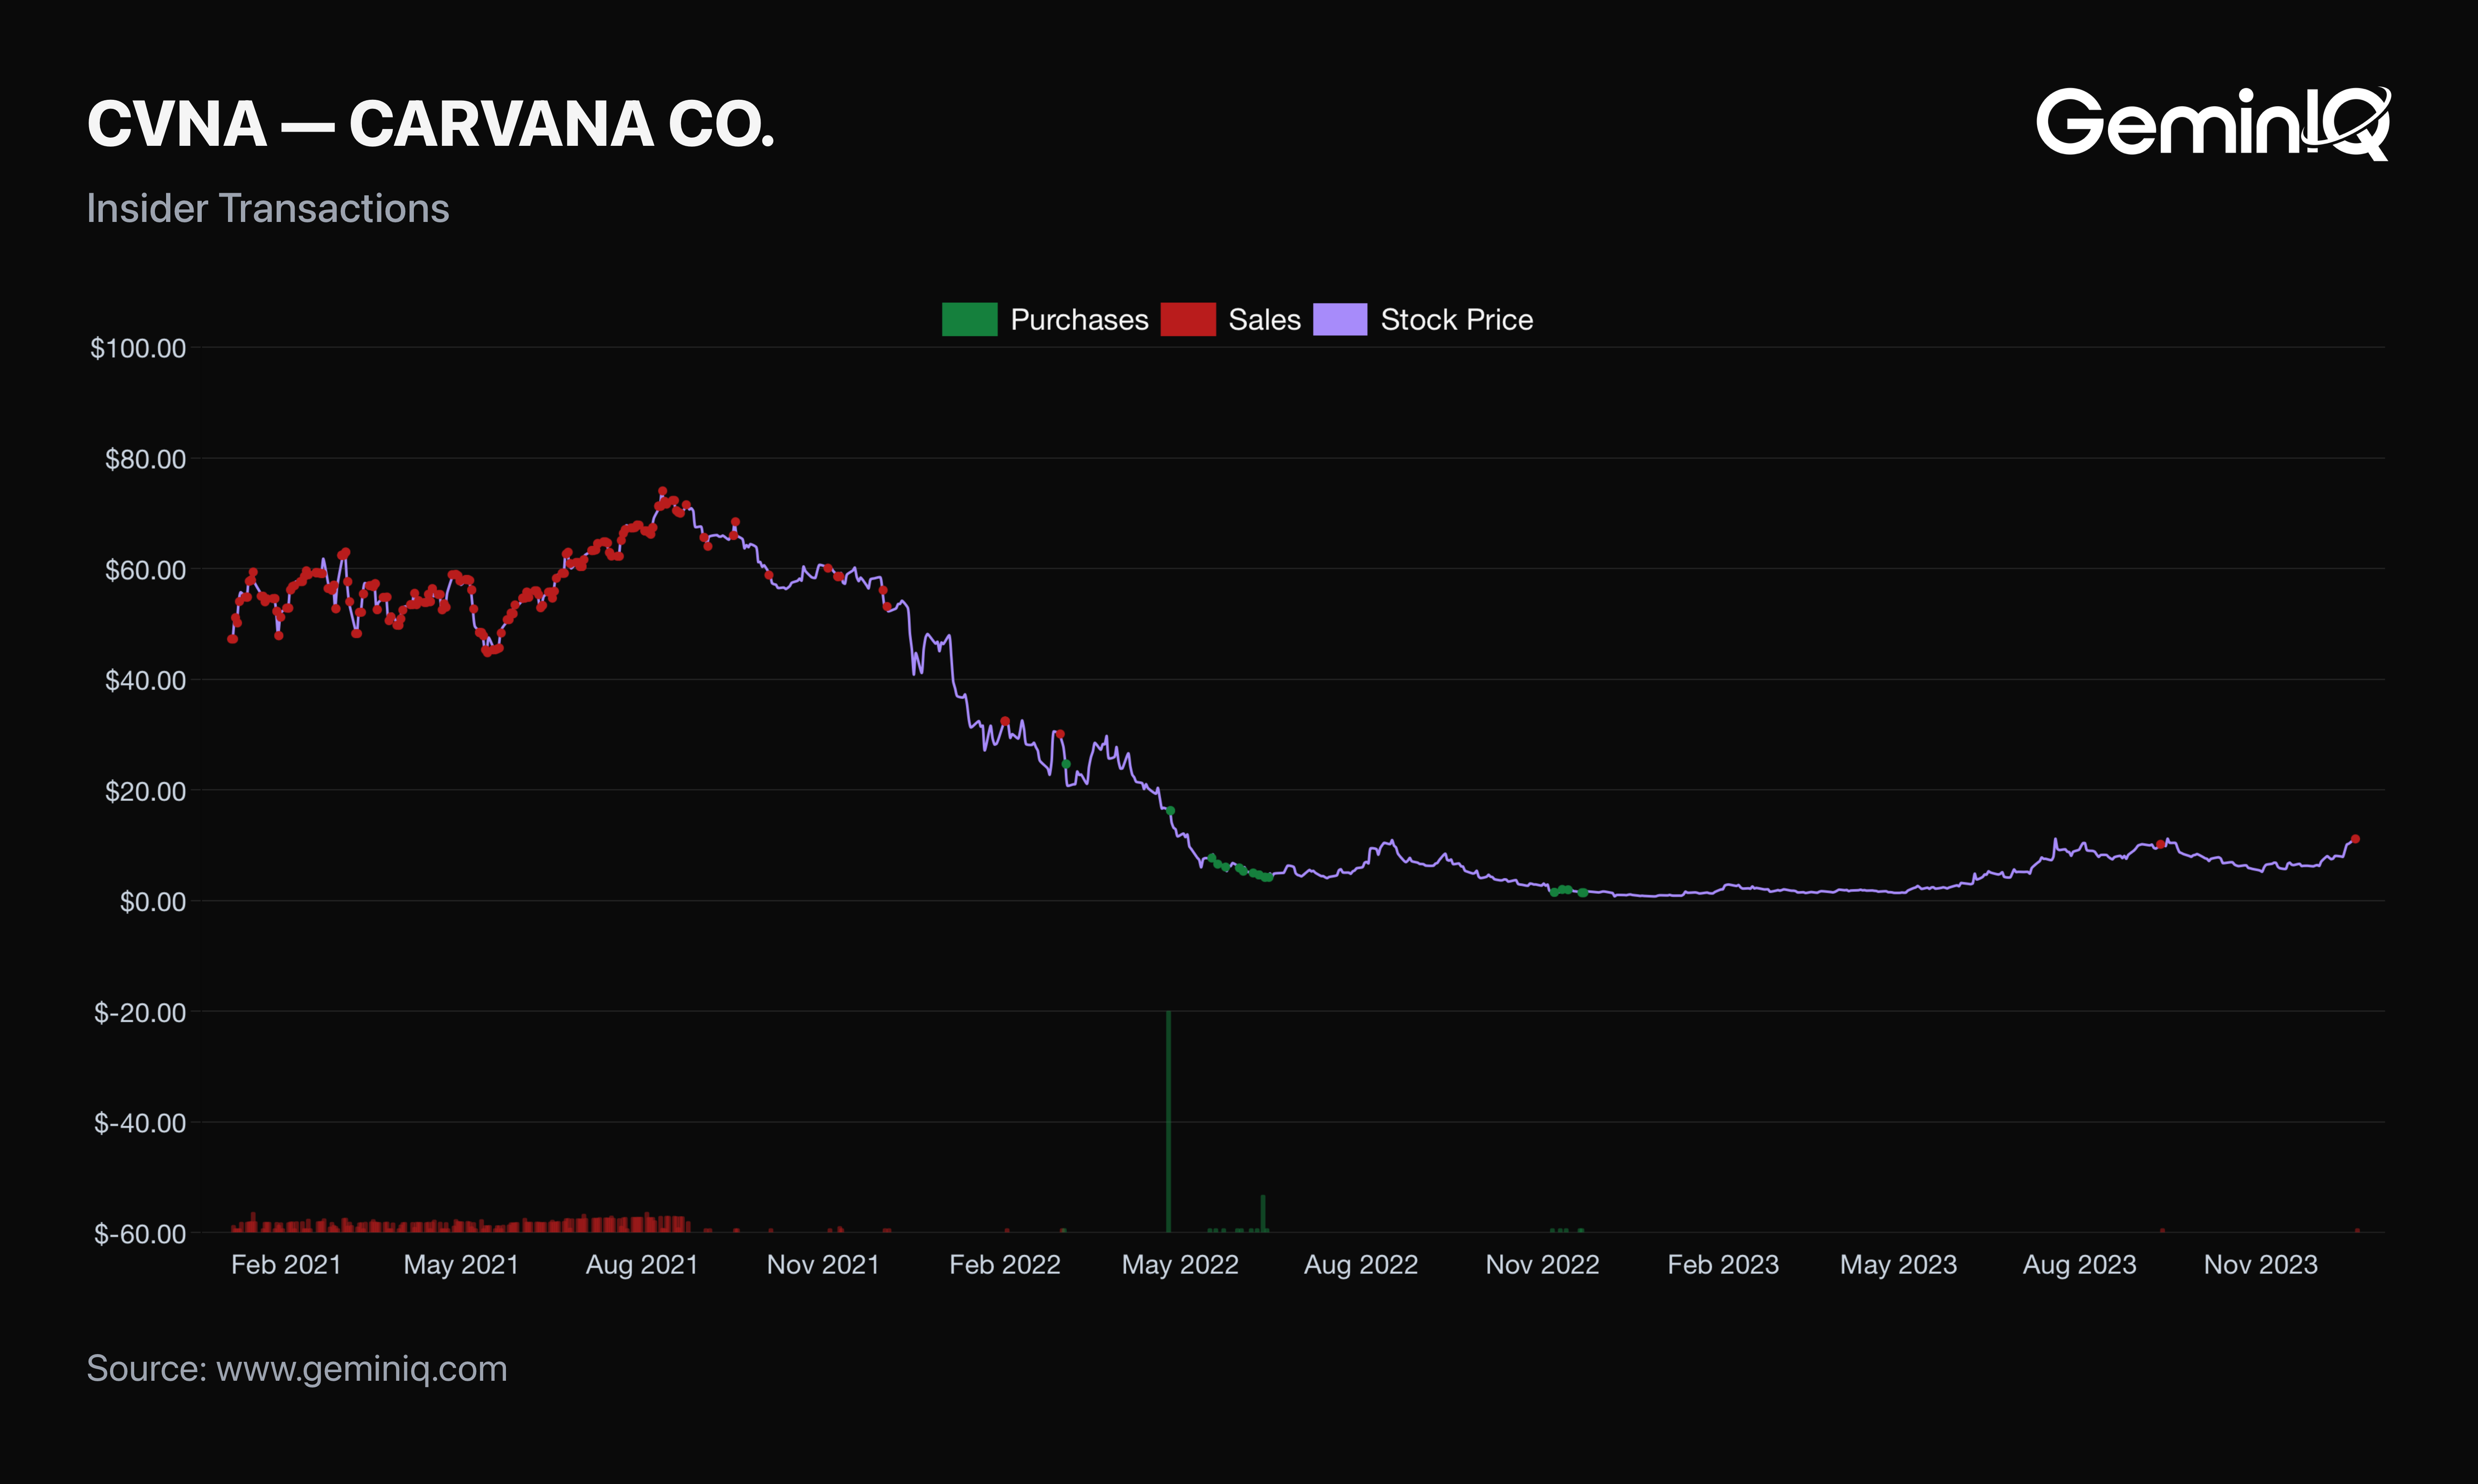
The Filing Data: On April 26, 2022, Chairman Ernest C. Garcia II (through Verde Investments) and CEO Ernest C. Garcia III together purchased 3,662,500 shares at $80.00 apiece — a combined $293.0 Million. Over the following seven weeks, Garcia II added two more blocks: 793,790 shares at $21.95 on June 10, and 1,191,468 shares at $20.74 on June 13, bringing the family's total committed capital across these three dates to $335.1 Million. No further purchase from either Garcia appears anywhere in the record after June 13, 2022. The stock kept falling — from that $20.74 final buy price down to $0.95 by the close of the December 2022 quarter, a further 95.4% decline after the family's last recorded purchase. A separate, smaller round of buying showed up that November from other officers and directors: Michael Maroone, Ira Platt, Thomas Taira, Gregory Sullivan, and Daniel Gill together purchased shares at prices between $6.86 and $11.13, a combined $2.68 Million — closer to the eventual low than the Garcias' buys, but still 7 to 12 times the $0.95 close the stock actually ended the quarter at. No insider purchases appear anywhere in the record for the entire 2023 recovery year; the next one on file is a March 2024 purchase at $76.68–$77.00, by which point the stock had already recovered roughly eighteenfold off its low.
Institutional and insider positioning data in GeminIQ reflects each entity's quarterly SEC filing cadence, not live holdings. On that basis, GeminIQ's Institutional Ownership data shows institutional holders trimming their position from 125.8 Million shares in September 2022 to 102.9 Million by September 2023 — reducing, not adding, through the trough and into the early rebound.
The Signal: The largest-dollar insider conviction in Carvana's history arrived six to eight months before the actual bottom and still absorbed another 95% decline. The buying closest to the real low came in smaller size, from directors rather than the founders, and even that missed by a wide margin. Cluster buying here reads as a signal of long-term conviction — not a timing tool, and not a call on the bottom.
The Quarter the Balance Sheet Reset
By early 2023, commentary on the stock's early rebound largely treated it as speculative froth sitting atop a company still burning cash — a bet on survival, not a read on the fundamentals actually turning.
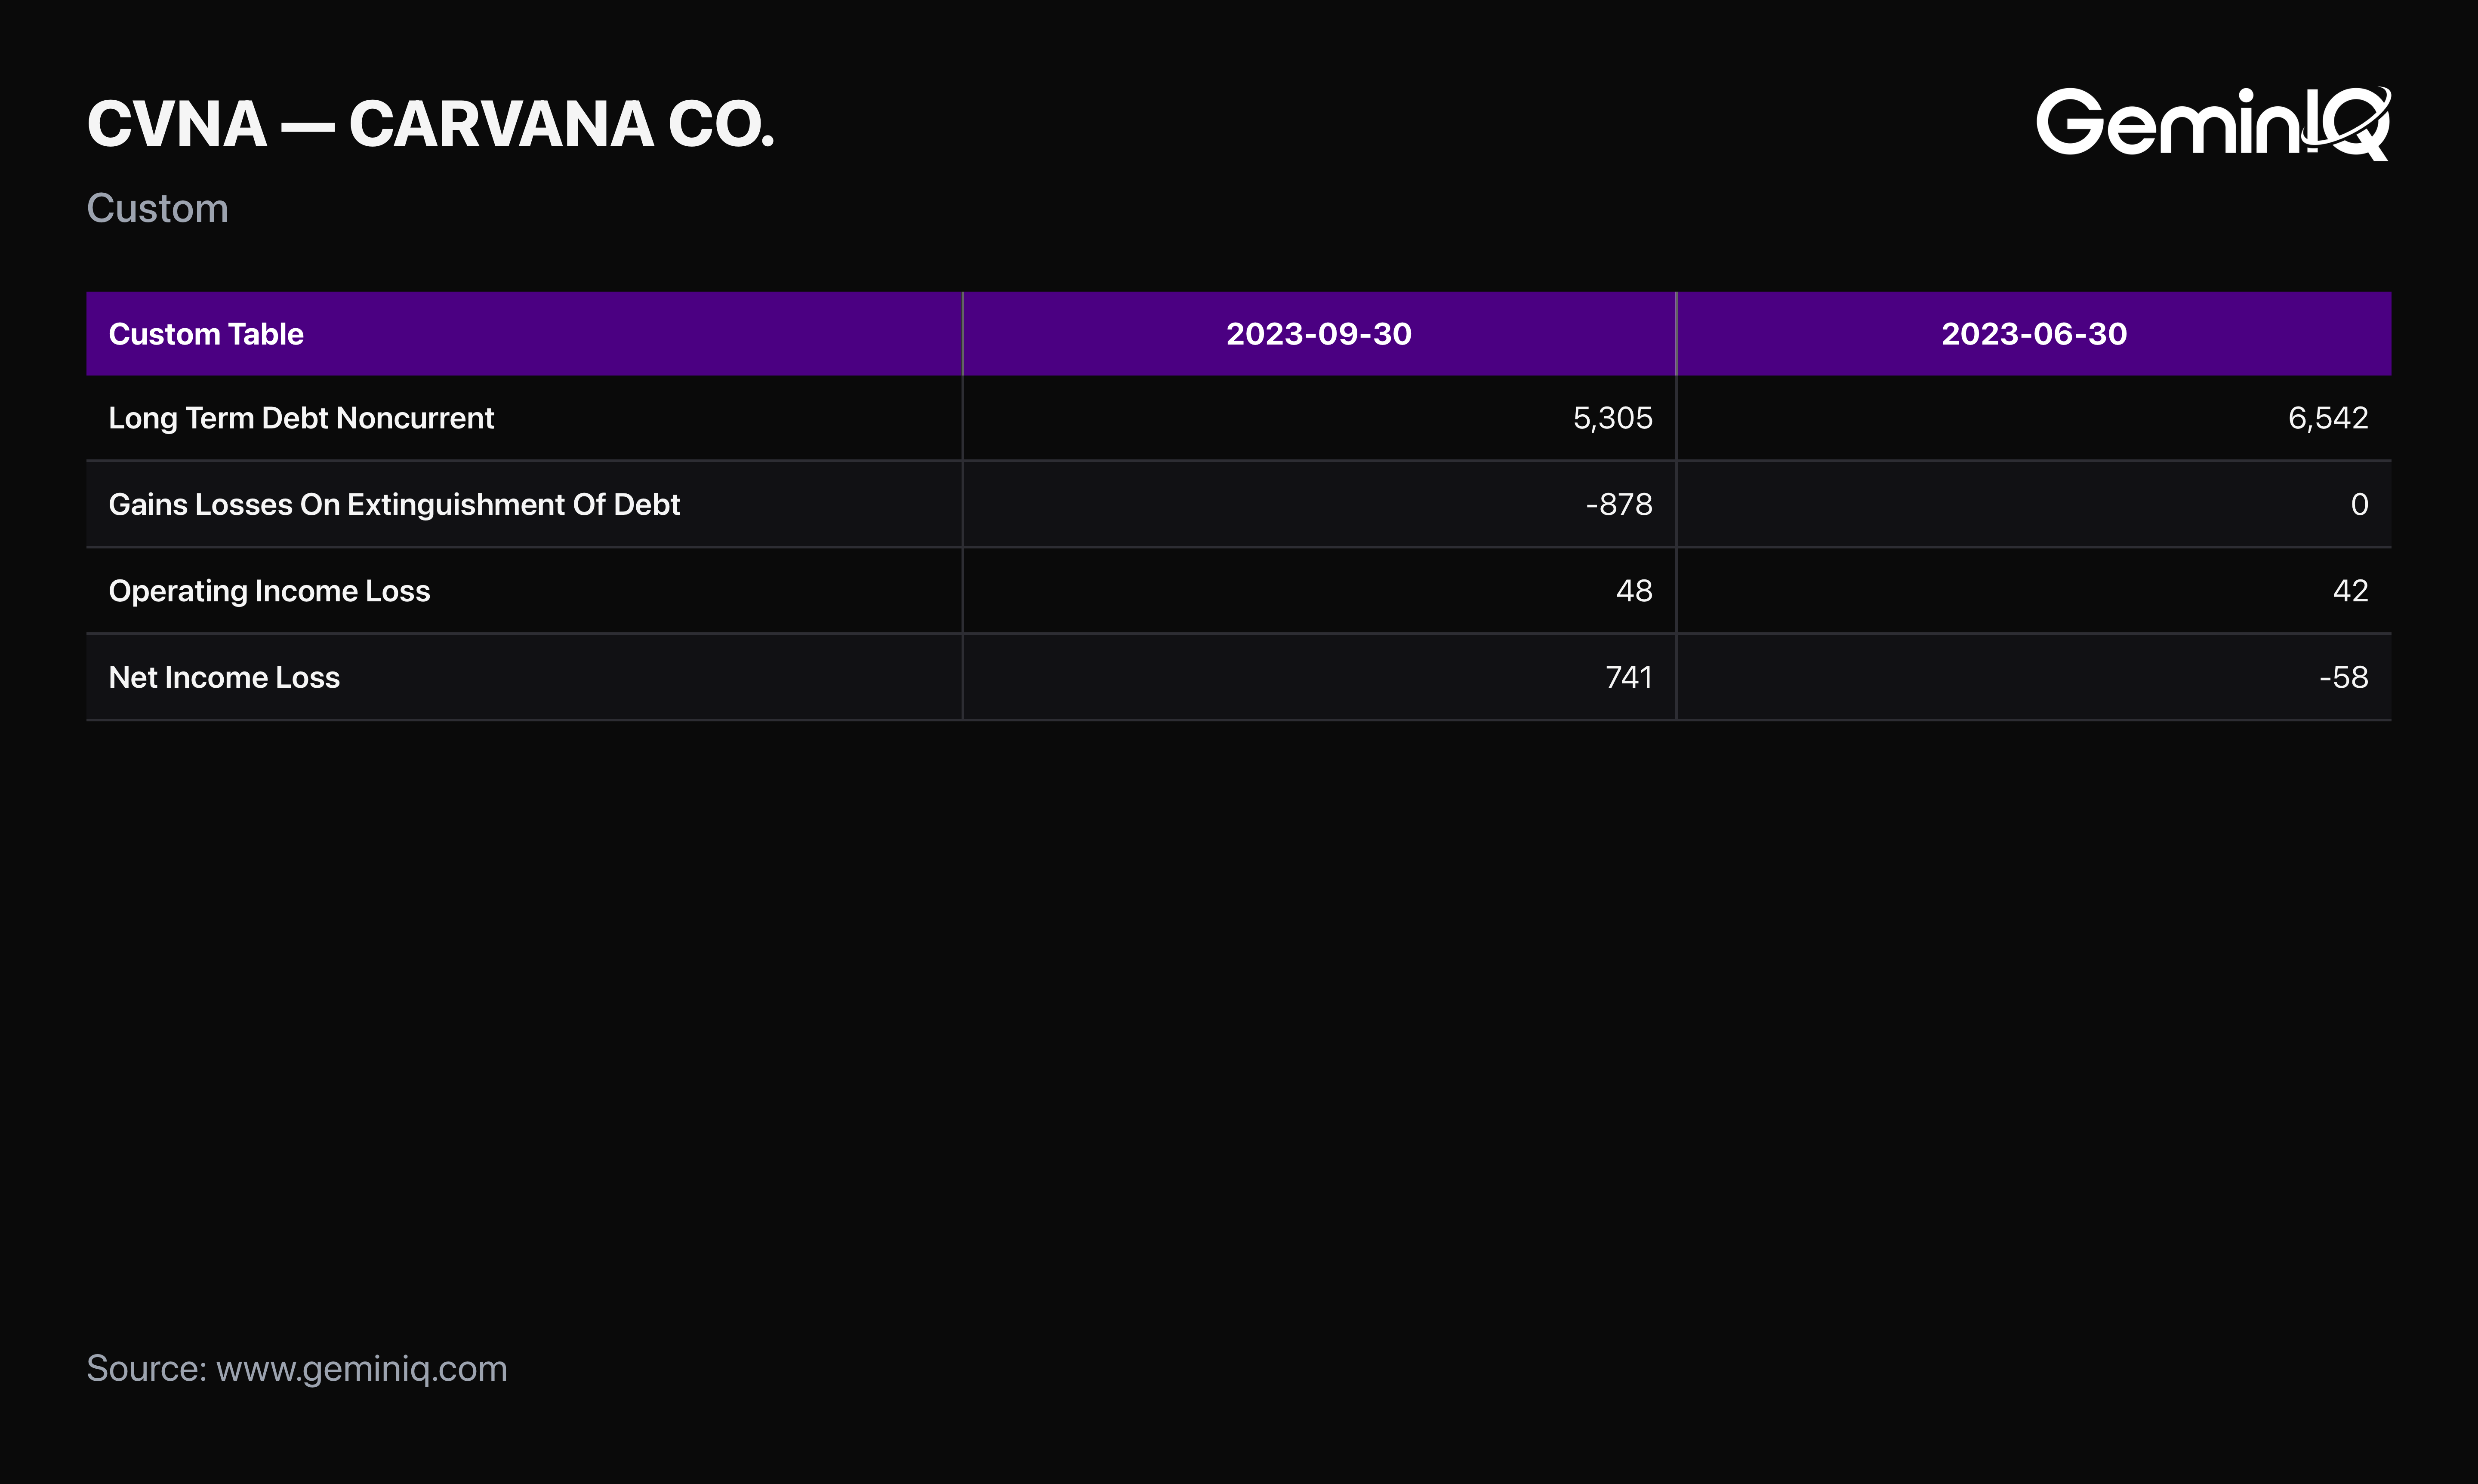
The Filing Data: Operating Income (Loss) read -$132 Million in the March 2023 quarter — the first quarter it appears as its own filed line item in Carvana's income statement. By June 2023, it turned positive for the first time on record, at $42 Million, and held positive again in September at $48 Million. Net Income (Loss) Attributable To Carvana Co. for that September quarter spiked to $741 Million — but that figure is not organic. The same 10-Q recorded a $878 Million Loss (Gain) On Debt Extinguishment, and Long-Term Debt, Excluding Current Portion fell from $6.54 Billion in June 2023 to $5.31 Billion in September — a $1.24 Billion reduction in a single quarter. Total Debt, GeminIQ's full calculated aggregate, fell from $7.90 Billion to $5.93 Billion over the same stretch.
The market didn't wait for the debt deal to start moving, and it didn't move cleanly, either. The FY2022 10-K, filed February 23, 2023, was followed by a cumulative return of -24.1% one month out and -11.0% two months out, before reversing to +4.2% by month three and accelerating to +89.2% by month four and +404.5% by month seven — the re-rating was already underway well before the September 2023 debt exchange closed. Yet the June 2023 10-Q — the filing that reported that first positive Operating Income (Loss) — was itself followed by a cumulative three-month return of -32.5%. Carvana's stock closed that June 2023 quarter at $5.18.
The Signal: The operating business turned a full quarter before the balance sheet got its dramatic, headline-grabbing fix — and the market punished the stock for three more months even after that operating turn was sitting in the filing. The fix that got the attention wasn't the one that mattered first.
The Efficiency Turn
A one-quarter debt exchange doesn't sustain Carvana's 89-fold recovery off a $0.95 low on its own. What follows in the filings is eleven consecutive quarters of the same signals moving the same direction, together.
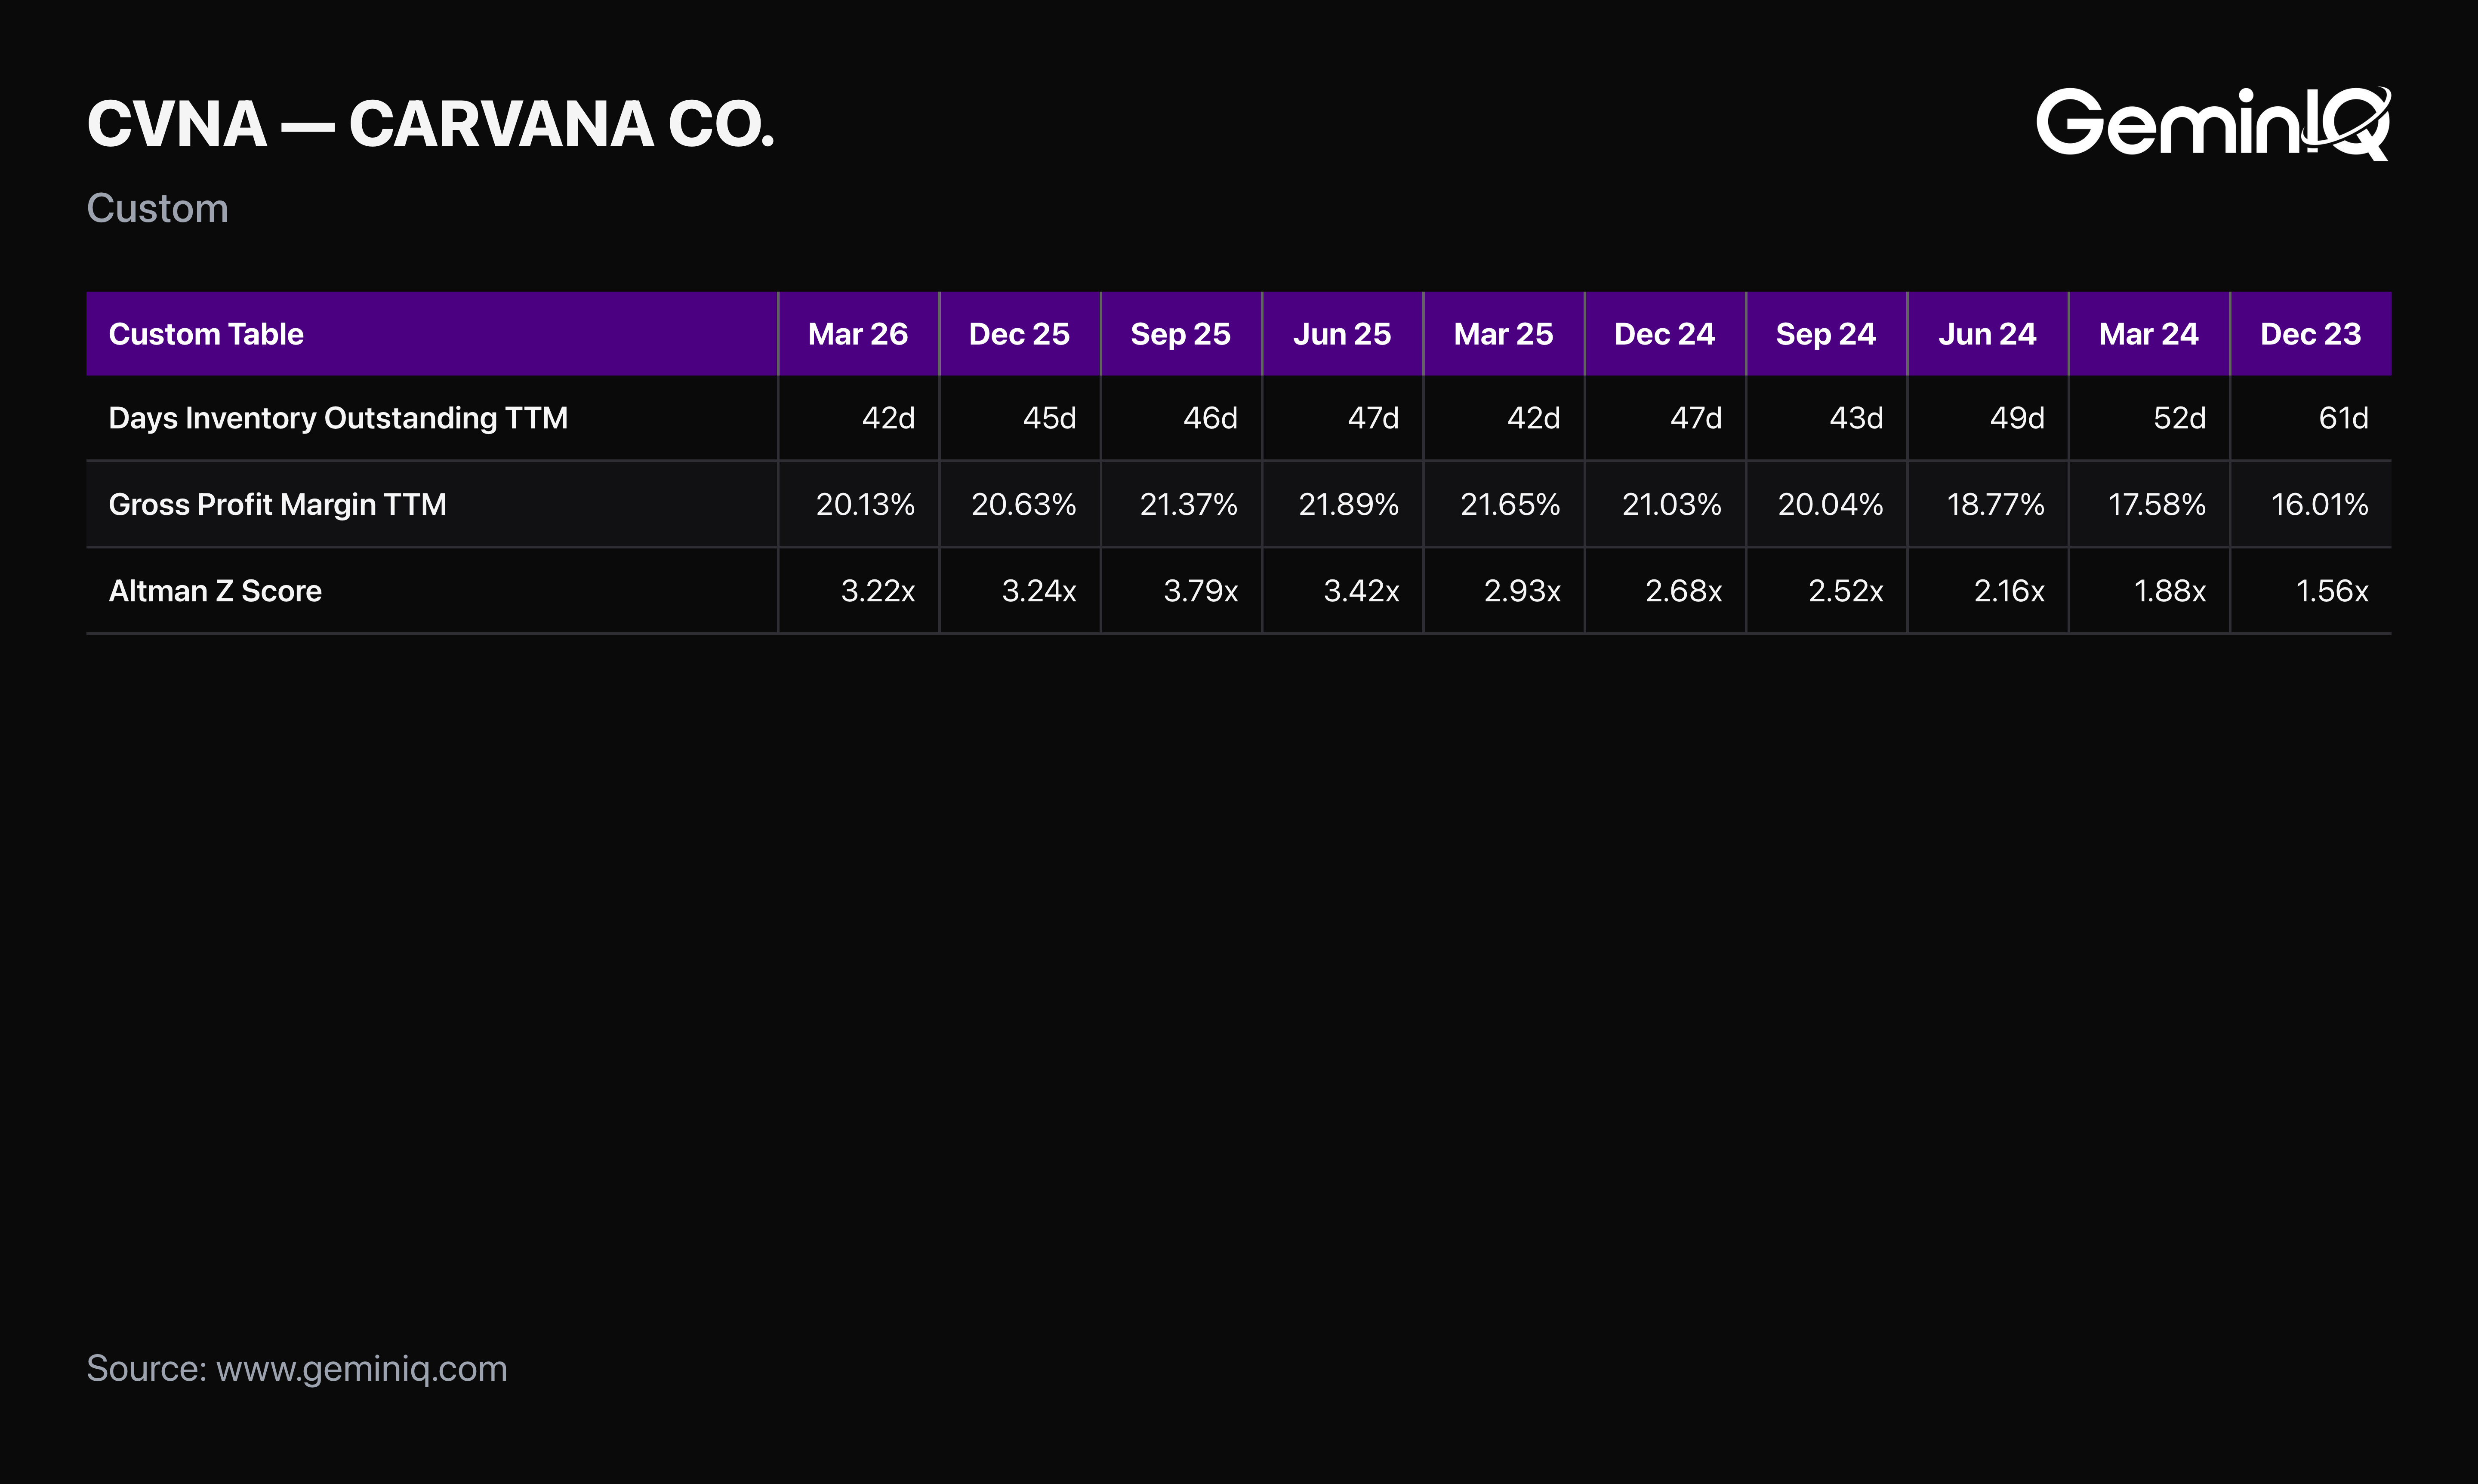
The Filing Data: Selling, General And Administrative Expenses fell from a peak of $727 Million in the March 2022 quarter to $433 Million by September 2023 — a 40.4% reduction — even as the business kept operating. Days Inventory Outstanding fell from 76.5 days in March 2023 to 61.0 days by December 2023, 52.2 days by March 2024, and 41.8 days by March 2025. Gross Profit Margin climbed from that 9.2% trough to 16.0% by December 2023 and 21.0% by December 2024 — more than double the crisis-era low and above every pre-crisis reading in this record. The Altman Z-Score climbed from its 1.06 trough in March 2023 to 1.88 by March 2024, 2.68 by December 2024, and 3.42 by June 2025 — the first quarter to clear the 2.99 safe-zone threshold — before reaching 3.79 by September 2025. Retained Earnings (Accumulated Deficit), which bottomed at -$2.29 Billion in June 2023, turned positive for the first time in the company's history by March 2026, at $241 Million.
The Signal: Every metric in this section moved the same direction, in the same order, quarter after quarter. A cost structure, an inventory cycle, and a solvency score improving together over eleven straight quarters is not a lucky earnings beat. It's a business that was rebuilt from the balance sheet up.
What the Filings Said Before the Market Knew
Stack the danger signals against the calendar, and the March 31, 2022 10-Q — filed May 10, 2022 — is the point where three of them sat in the same filing at once: Total Debt at $6.25 Billion, more than double its year-earlier level; an Interest Coverage Ratio of -2.60x; and Vehicle Inventory at a then-record $3.30 Billion against a Gross Profit Margin that had already fallen to 13.4% trailing-twelve-months from 15.2% two quarters earlier. Carvana's stock closed that quarter at $23.86 — down from its highs, but with another 96% of decline still ahead of it, a fall the market would take eight more months to finish pricing in.
The turn signals stacked on a different calendar, and the market was even slower to believe them. The June 30, 2023 10-Q — filed July 19, 2023 — was the first filing to show Operating Income (Loss) positive, at $42 Million, alongside a Days Inventory Outstanding already falling and a Gross Profit Margin that had climbed in three straight quarters. That is the exact quarter this record's operating turnaround becomes visible. The stock closed that quarter at $5.18 — and over the following three months, as that filing sat in front of anyone reading it, the stock fell another cumulative 32.5%. The balance-sheet fix that would draw the headlines — the $878 Million debt-extinguishment gain — was still three months away. The filings had the turn a full quarter before the market started believing it, and the market spent three more months disbelieving it after that.
Check Your Holdings
Neither half of this pattern requires Carvana specifically — both are checks anyone can run against their own portfolio inside GeminIQ. Pull up Calculated Metrics for any company you hold and track the Interest Coverage Ratio and Altman Z-Score across four or five consecutive quarters rather than as a single snapshot; a coverage ratio that's gone negative while debt is still climbing, or a Z-Score that's fallen below the 1.81 distress threshold, is the same combination that sat in Carvana's filings months before the worst of its decline. Then open Financial Statements and watch Operating Income (Loss) specifically, separate from Net Income (Loss) — a swing from negative to positive on the operating line is a cleaner signal of an actual business turn than a net income number that a one-time gain or charge can distort in either direction, exactly as the debt-extinguishment gain did here. Finally, check Insider Transactions for cluster buying, but treat the price paid as a data point, not a floor. Carvana's own founders bought in size and still weren't done watching the stock fall for another seven months.
Wall Street's data. Main Street's price.
Institutional terminals charge thousands a year for as-filed accuracy. GeminIQ gives you the same thing for a fraction of the cost: financials built directly from raw SEC EDGAR filings, not third-party APIs, with full XBRL traceability back to the original 10-K or 10-Q. No normalized guesswork, just calculated metrics, charts, screeners, and watchlists built on numbers exactly as the company reported them. Start researching now at GeminIQ.com.
All financial figures in this article are drawn from Carvana Co.'s 10-K and 10-Q filings, filed 2017–2026 and publicly available on SEC EDGAR.
Disclaimer: The content in this blog is for educational and entertainment purposes only and does not constitute financial, legal, or tax advice. Investing involves risk, including the loss of principal. The views expressed are my own and not intended as financial advice or a guarantee of future performance.