
Coca-Cola Q1 2026 10-Q: The 13-Year Revenue Illusion

By Chad Hartman
Published · Last updated
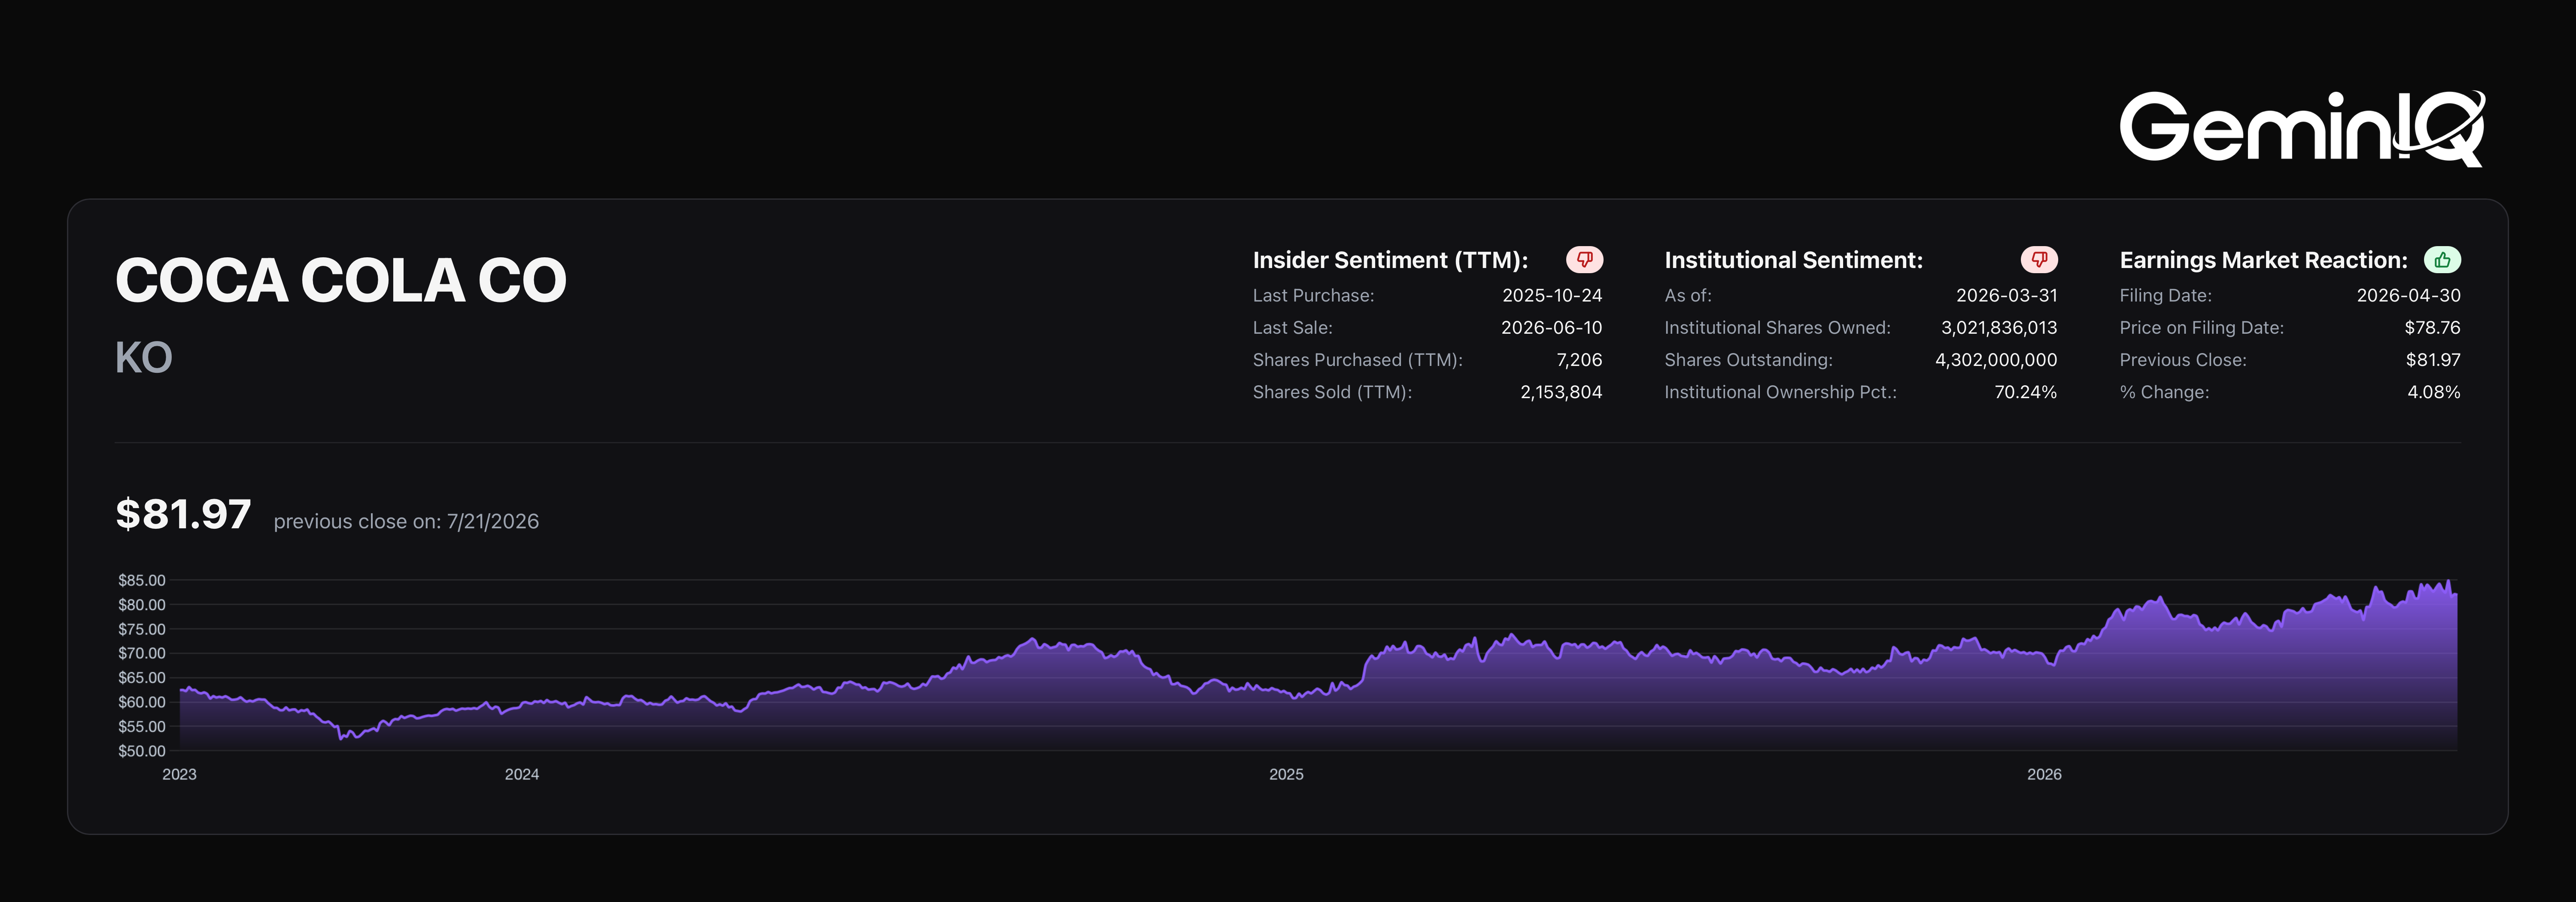
Coca-Cola Company ($KO) just dropped its Q1 FY2026 10-Q (filed April 30, 2026). Pull up a standard screener and the stock looks like dead money: revenue has grown a cumulative 2.6% since 2012, barely distinguishable from flat once you account for over a decade of inflation. The raw filing data tells a different story. Coca-Cola spent that same period deliberately shedding its capital-intensive bottling business, and the margin engine that replaced it hasn't stopped running.
| Field | Value |
|---|---|
| Ticker | $KO |
| Filing | Q1 FY2026 10-Q |
| Filed | April 30, 2026 |
| Period End | April 3, 2026 |
| Operating Margin (TTM) | 29.3% |
| Revenue Growth (2012–TTM) | +2.6% |
The Margin Engine Keeps Running
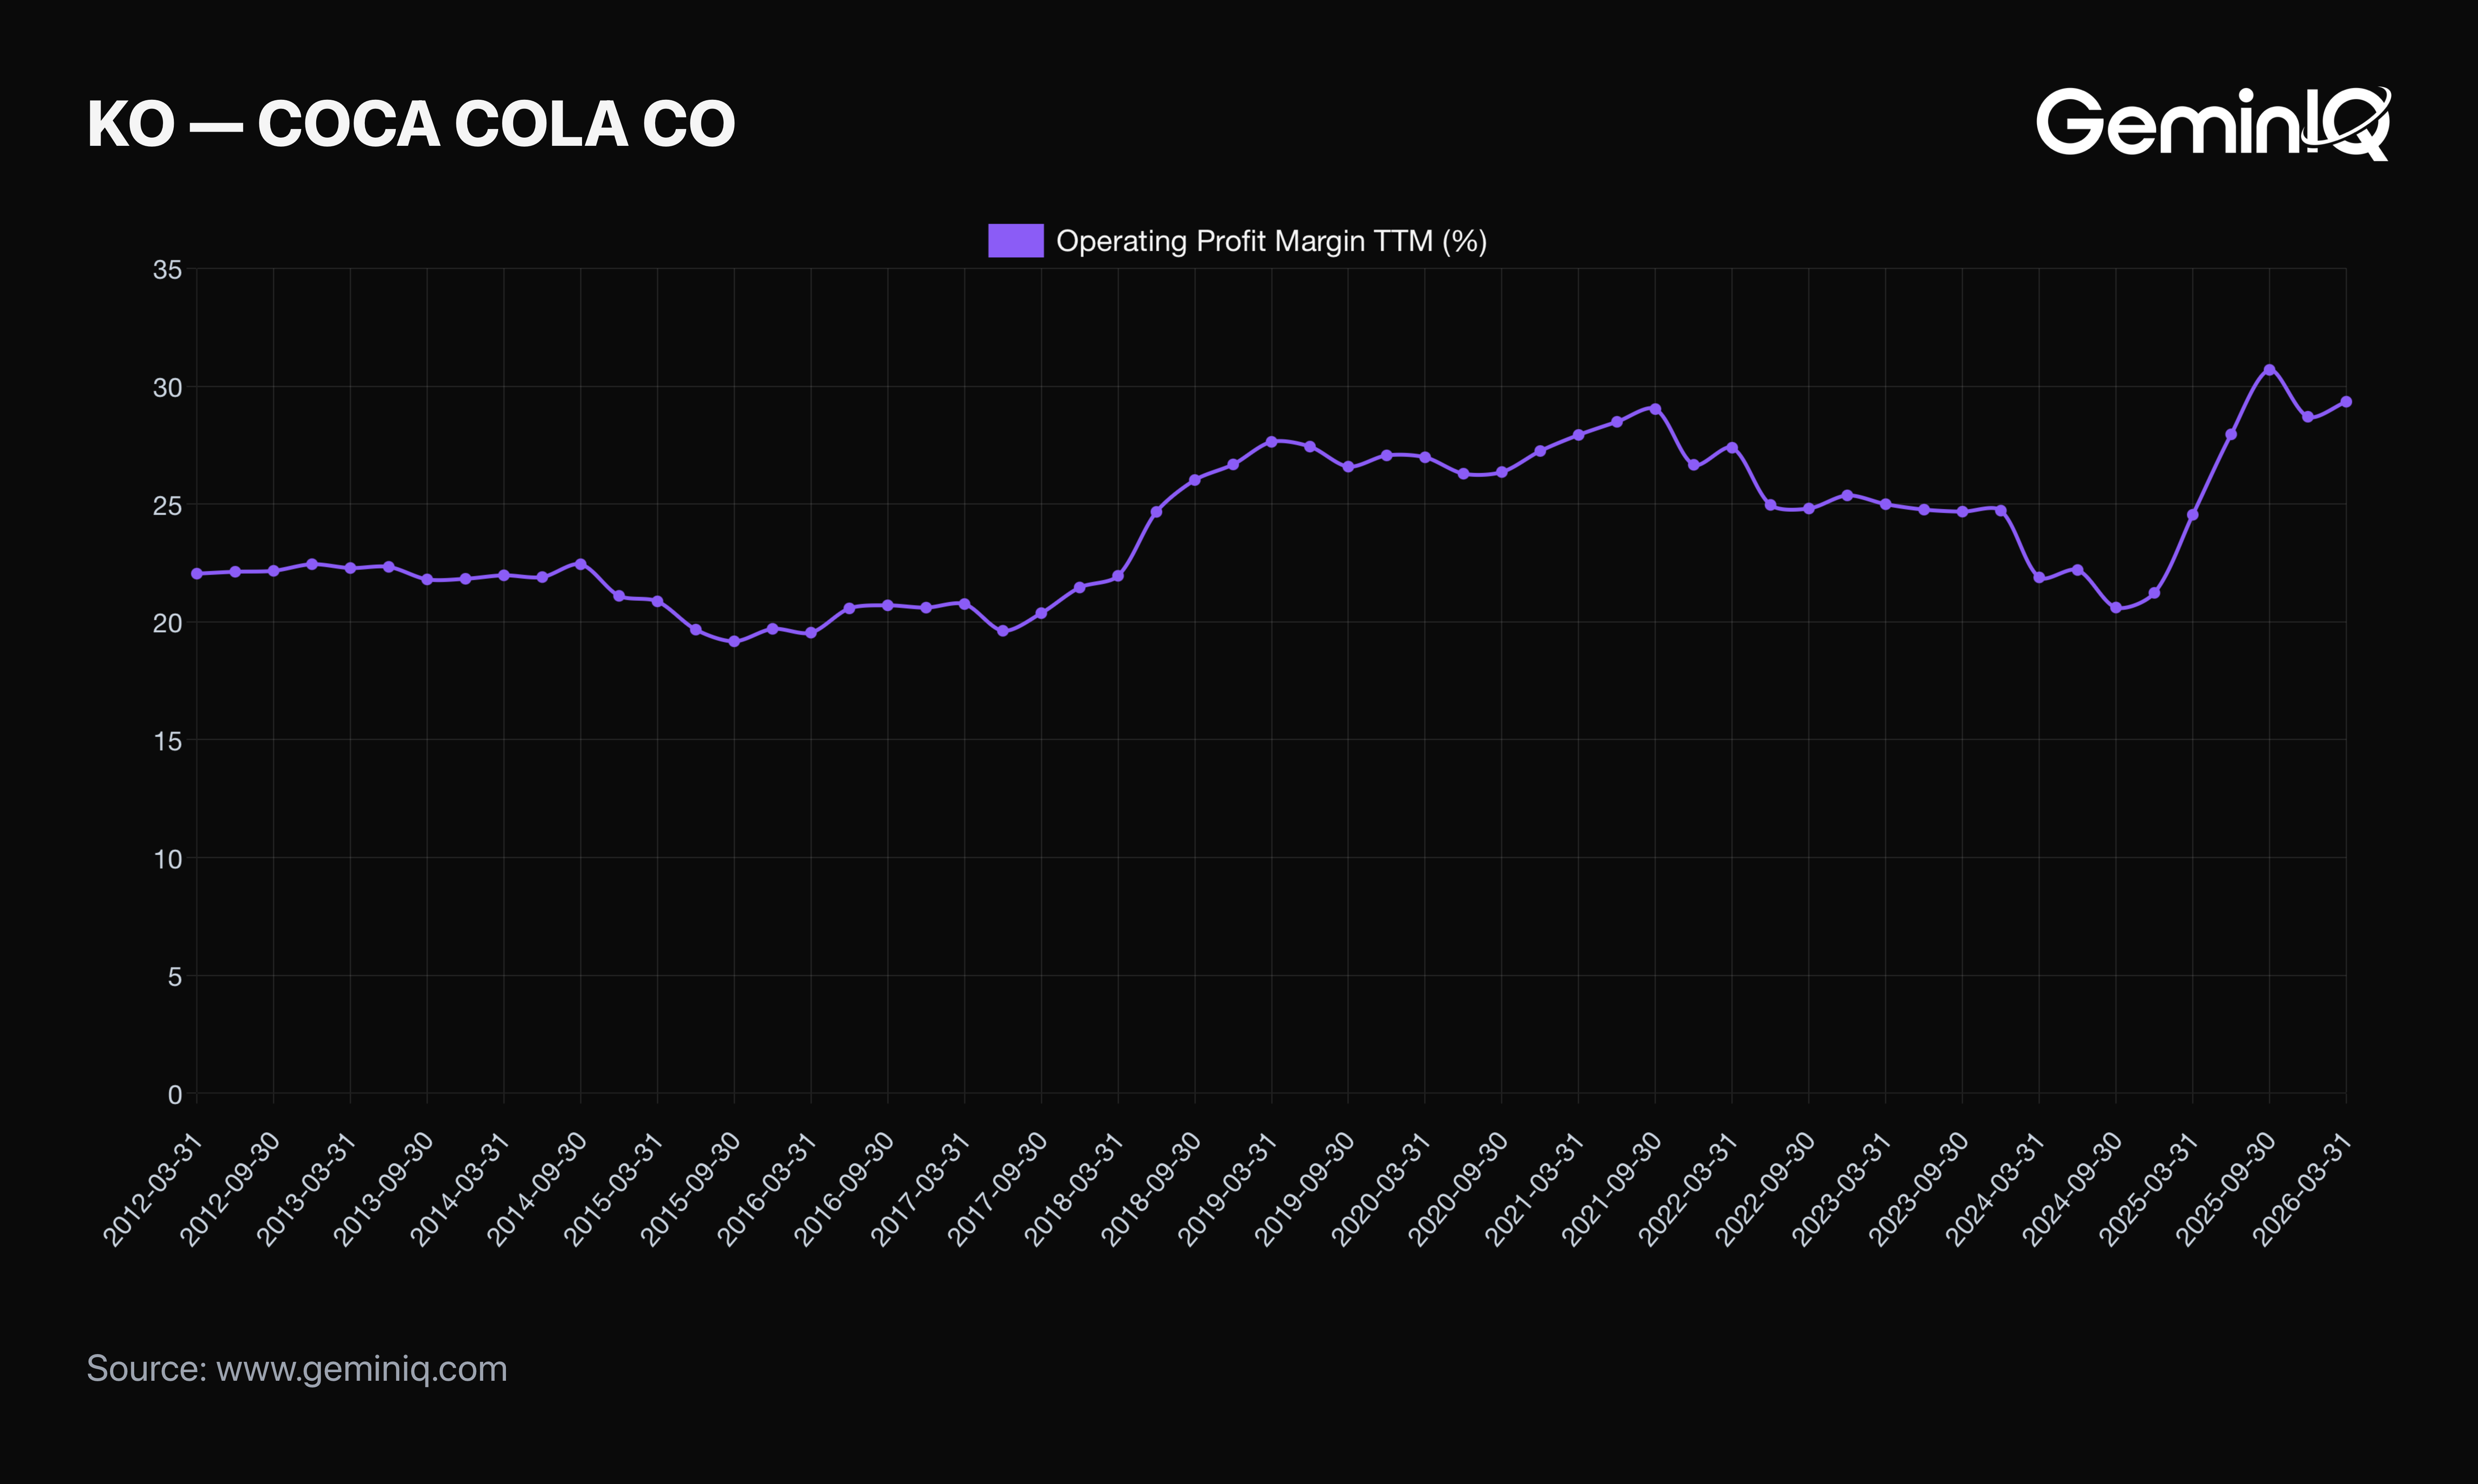
Thirteen years of near-zero revenue growth would sink most companies' margins. Coca-Cola's went the other way.
The Data: TTM revenue sits at $49.28 Billion, against $48.02 Billion in 2012 — a cumulative gain of 2.6% across more than thirteen years. Over that same window, TTM Operating Income climbed from $10.78 Billion to $14.46 Billion, and Operating Margin (TTM) expanded from 22.4% to 29.3%. Gross Margin (TTM) currently sits at 61.7%.
The GeminIQ Edge: A revenue-only screen flags this as a growth-stalled business and moves on. Pulling Calculated Metrics alongside the raw Income Statement shows the margin expansion has been sustained and gradual across more than a decade, not a single strong quarter — the kind of pattern that's much harder to explain away as noise.
The Asset Dump Continues
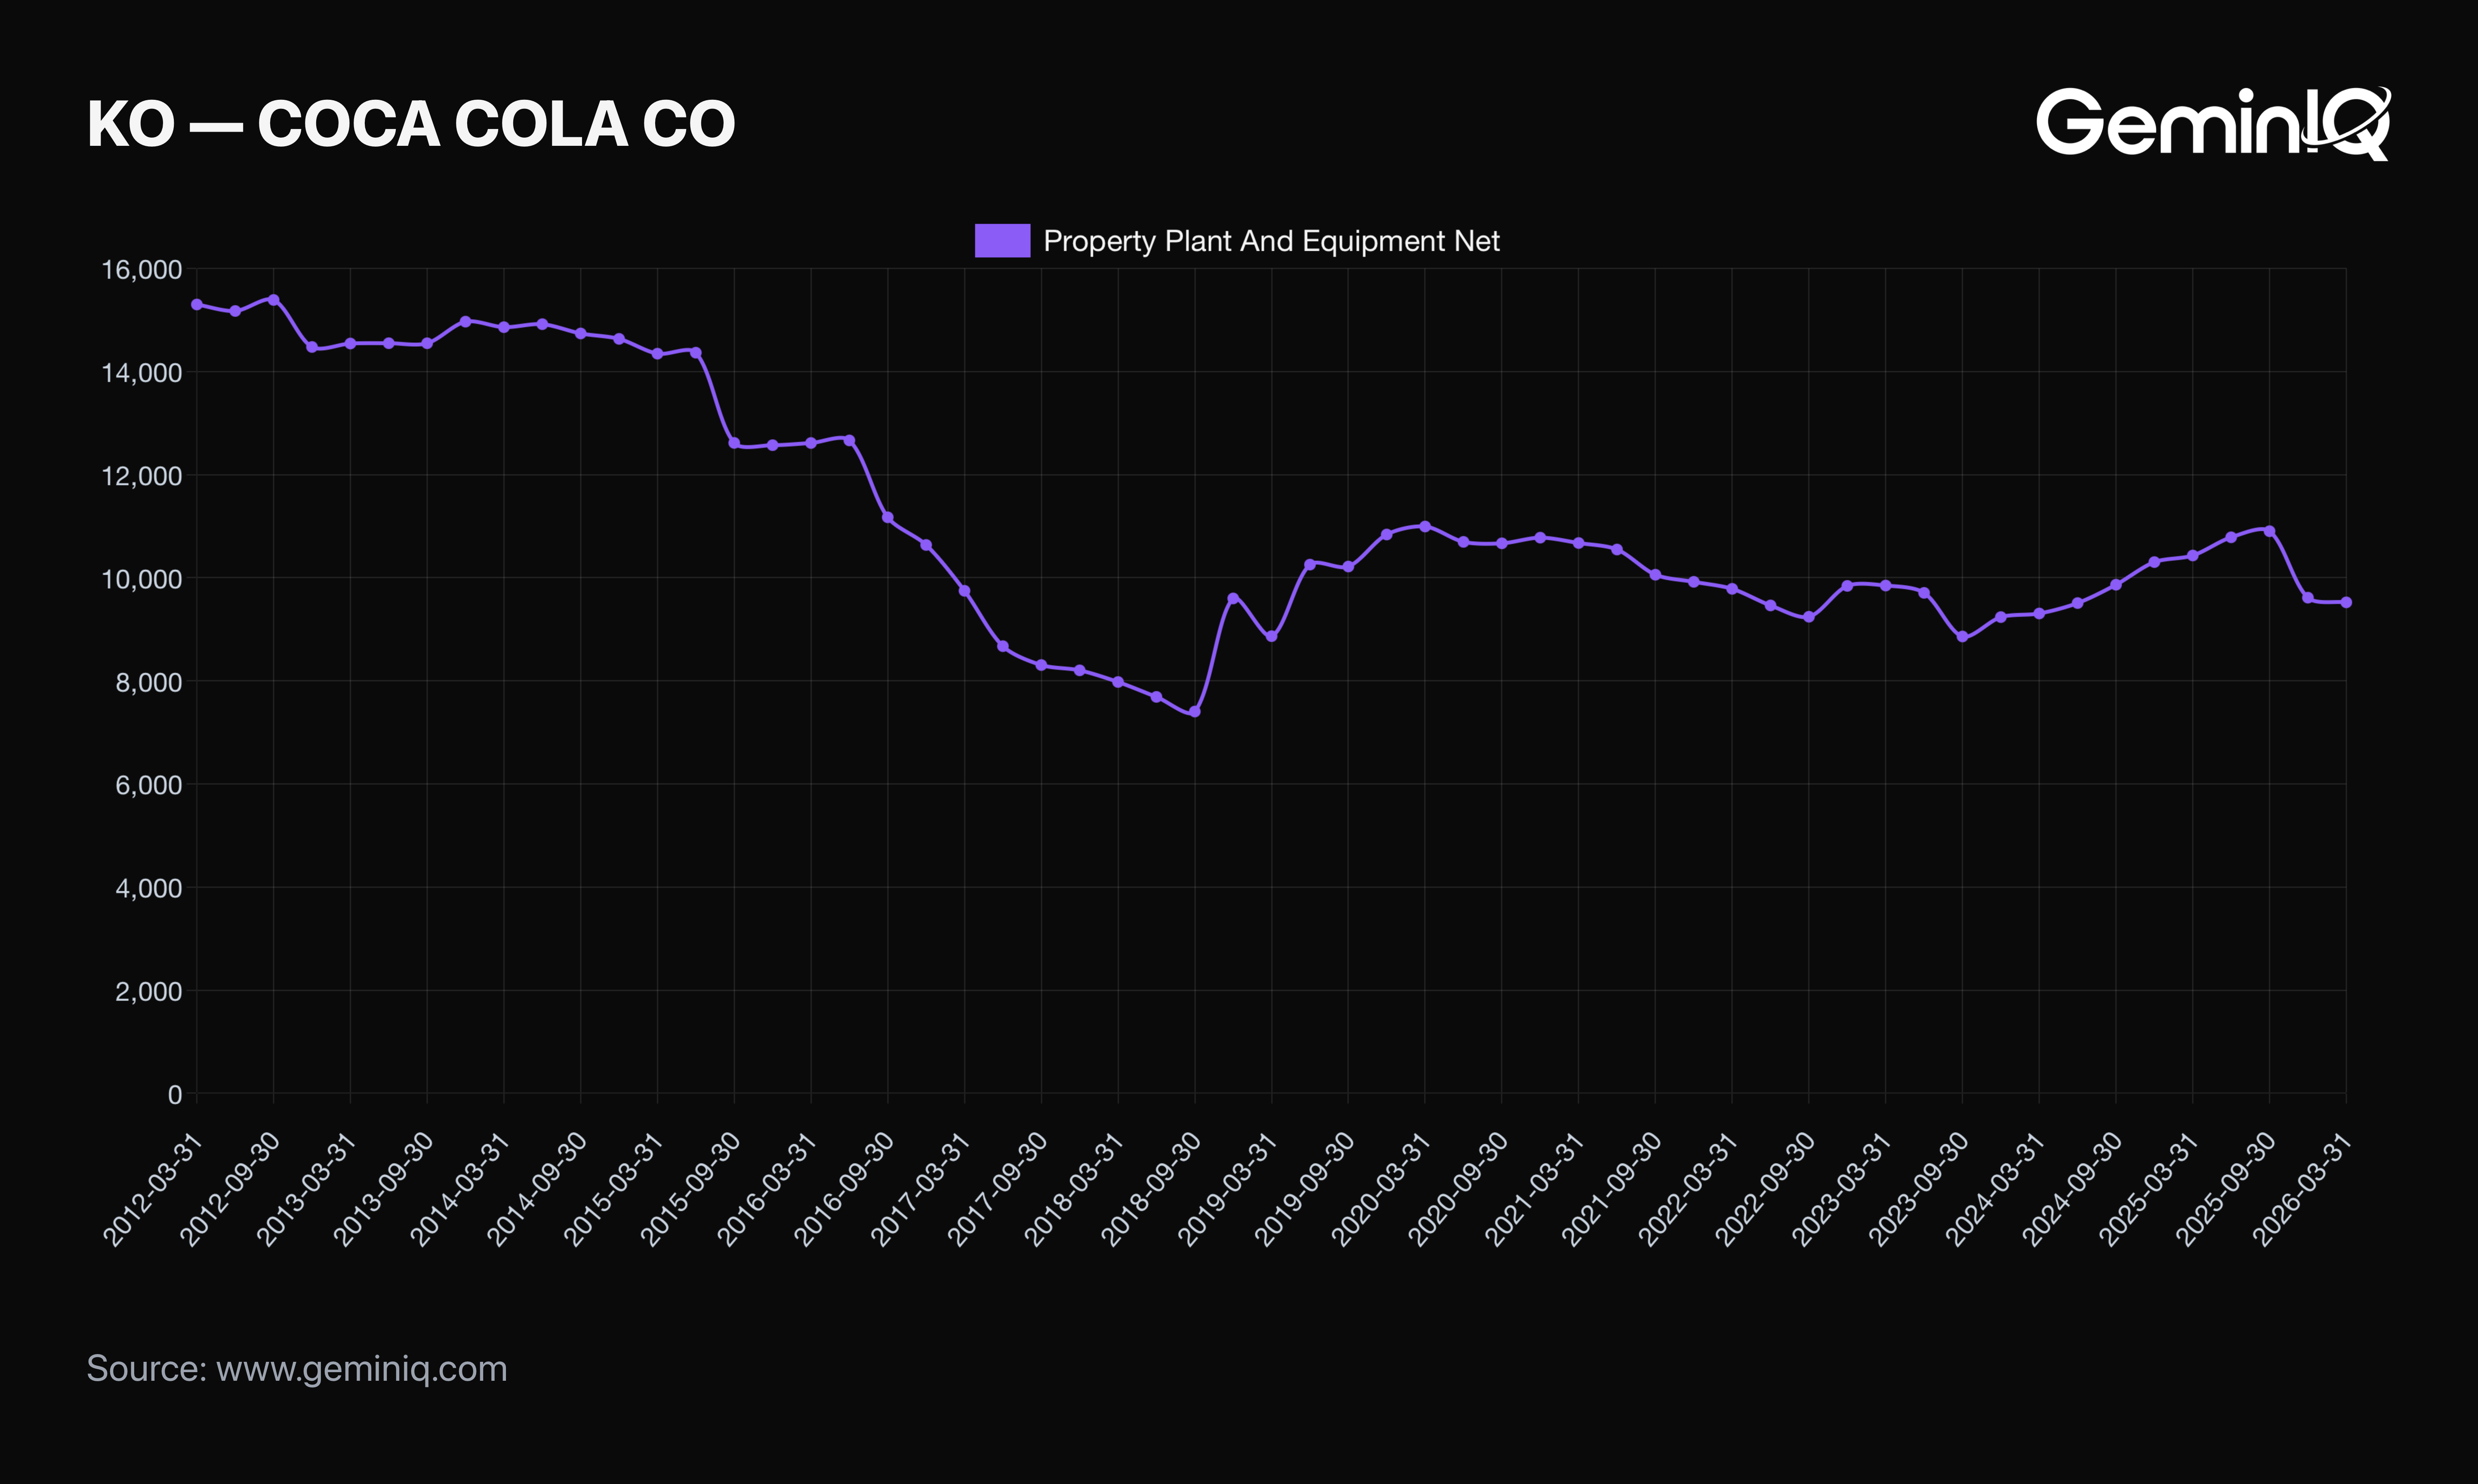
The margin expansion isn't an accounting trick. It traces directly to a deliberate shift in what kind of company Coca-Cola chose to be.
The Data: Coca-Cola's Property, Plant, and Equipment (net) has fallen from $14.48 Billion in 2012 to $9.52 Billion as of this filing — a reduction of roughly 34%. The decline reflects the company's long-running refranchising strategy: selling capital-intensive bottling operations to become primarily a brand owner and concentrate manufacturer.
The GeminIQ Edge: Pulling the historical Financial Statements balance sheet trend shows this wasn't a one-time divestiture but a sustained, multi-year asset reduction running in parallel with the margin expansion above — the same strategic decision showing up on two different statements.
The Debt Figure That Needed Correcting
Not every number in this filing was straightforward to pull, and this one is worth flagging directly rather than quietly fixing in the background.
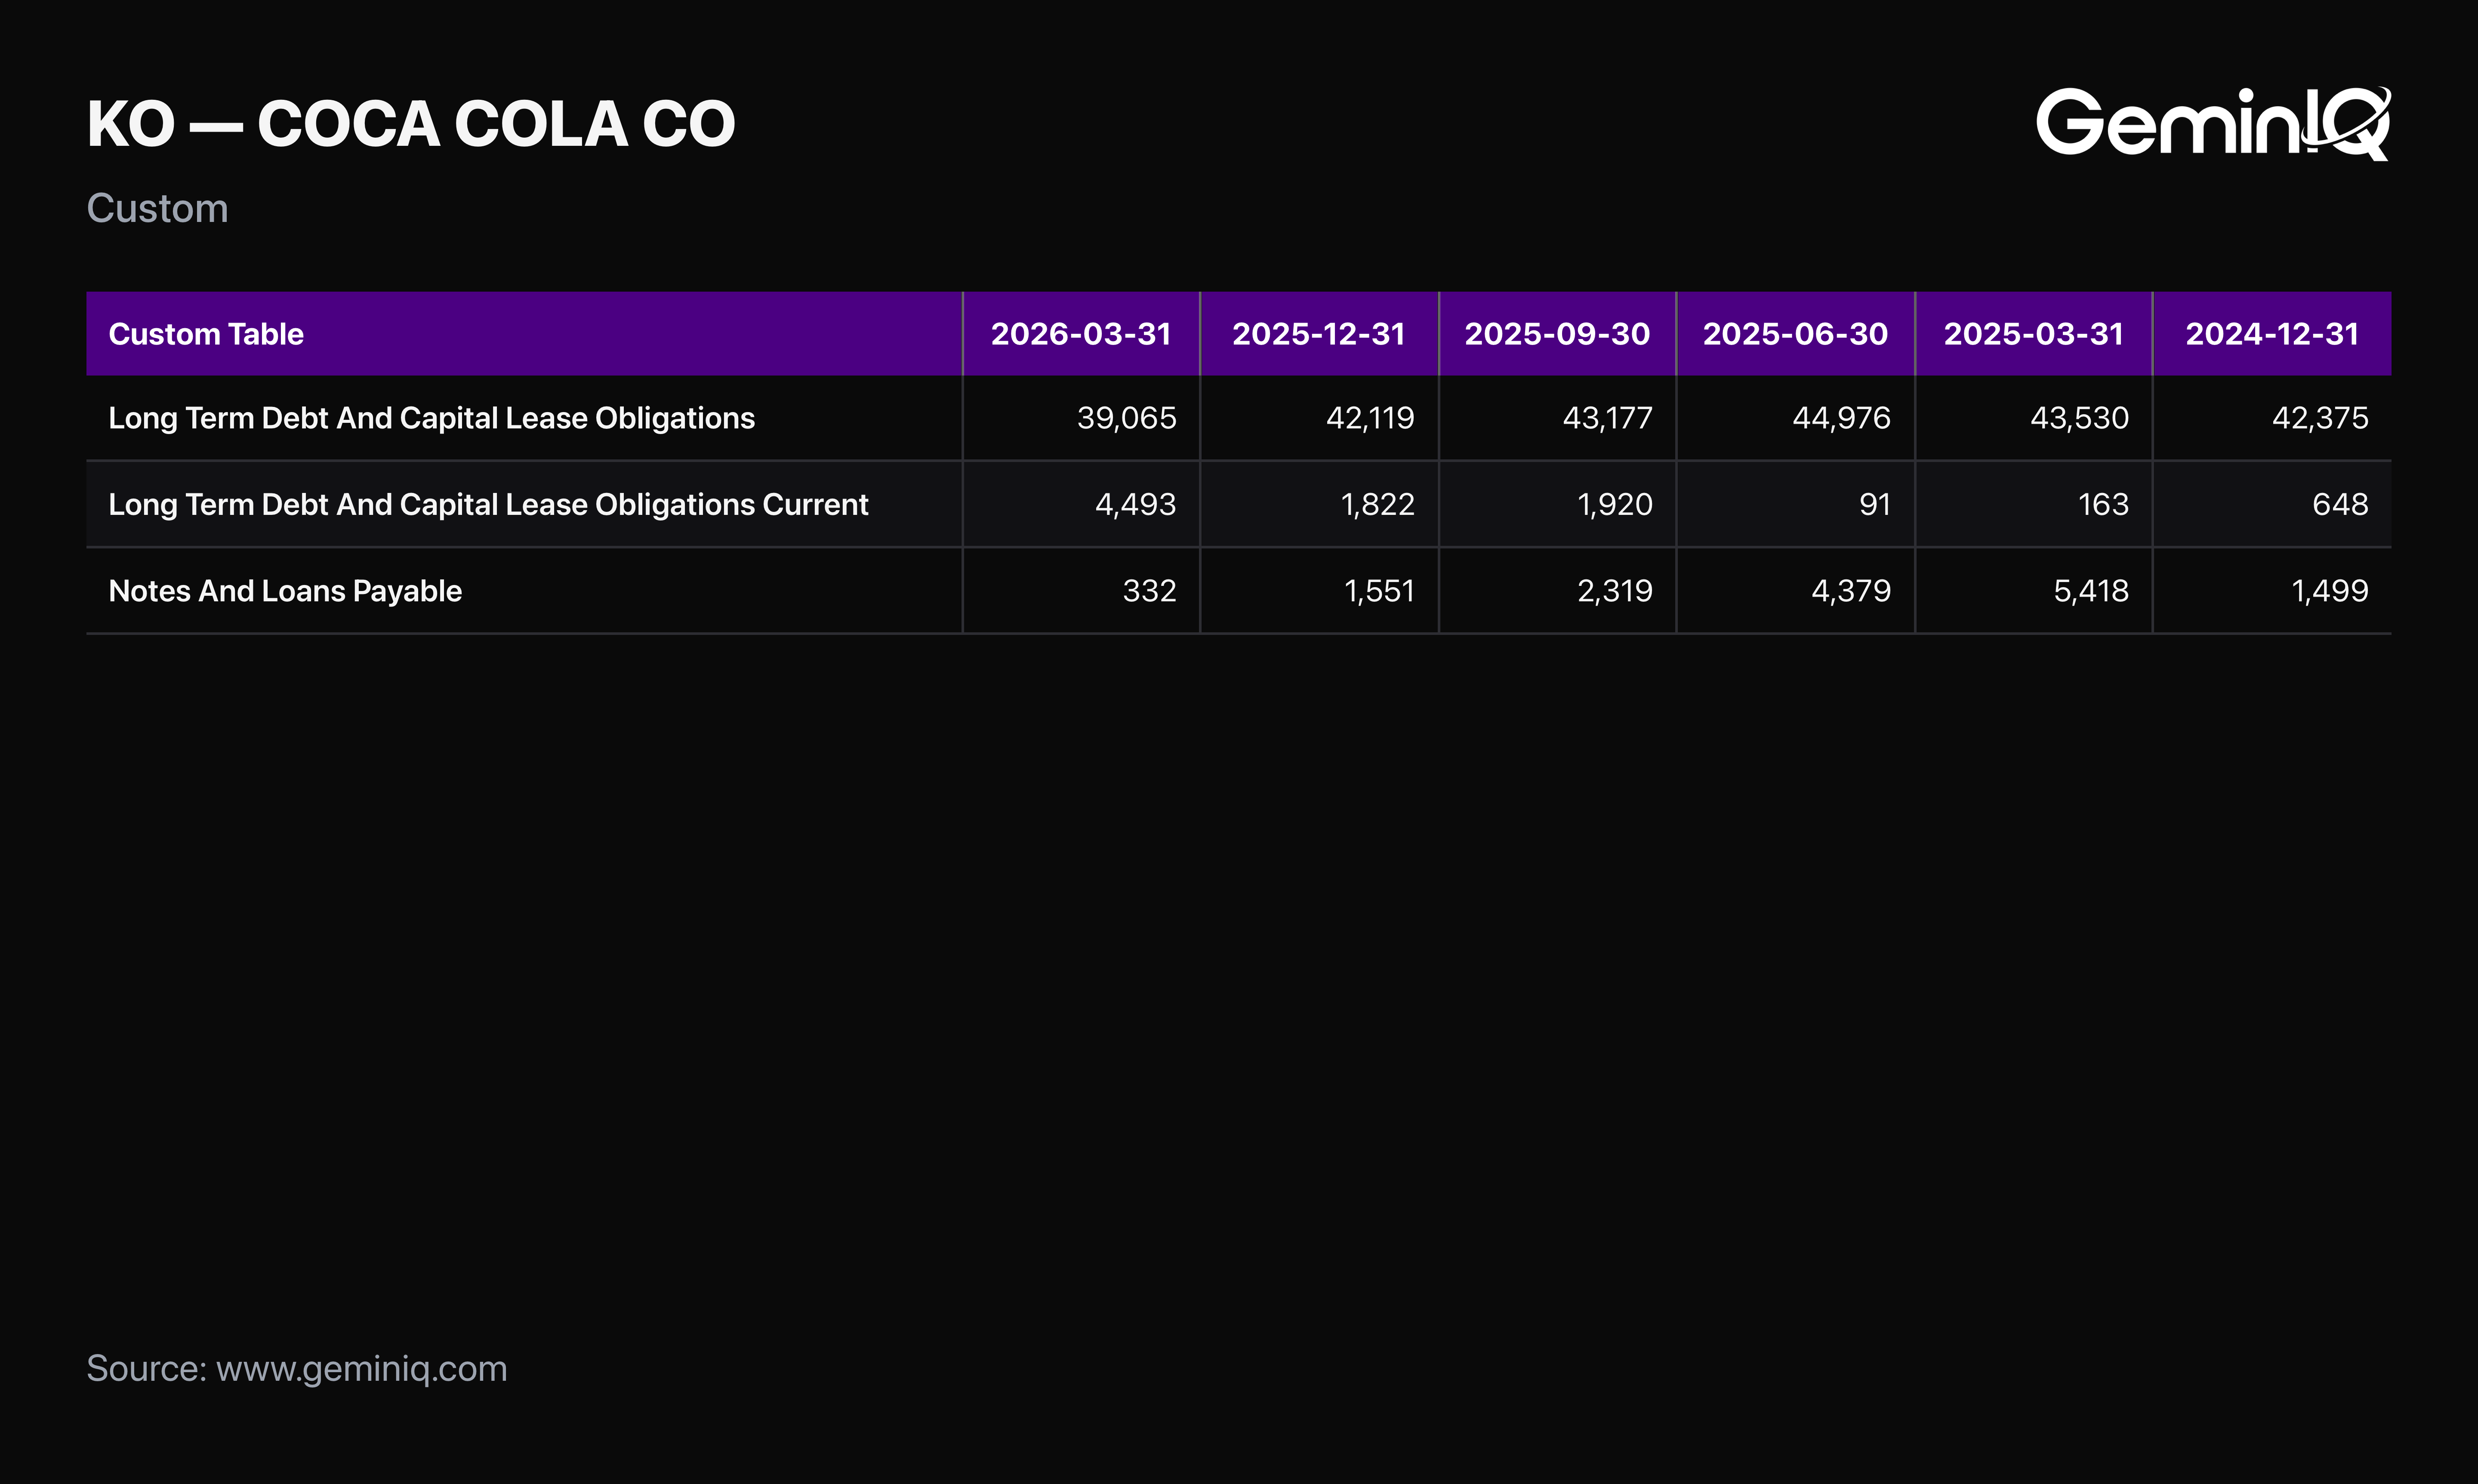
The Data: Coca-Cola's Total Debt sits at $43.89 Billion as of this filing — $39.07 Billion in Long-Term Debt, plus $4.49 Billion in current maturities and $332 Million in short-term notes and loans payable. Netted against cash, Net Debt comes to roughly $32.9 Billion.
The GeminIQ Edge: Coca-Cola reports its current debt maturities and short-term notes under combined line items rather than the more commonly used tag names, which is exactly the kind of company-specific labeling that a naive aggregation misses entirely. Pulling every debt-related line individually from the raw Financial Statements, rather than trusting a single pre-aggregated "total debt" figure, is the only way to catch a gap like this.
Smart Money and the Insider Record
Two different signals around Coca-Cola worth checking separately rather than folding into one story.
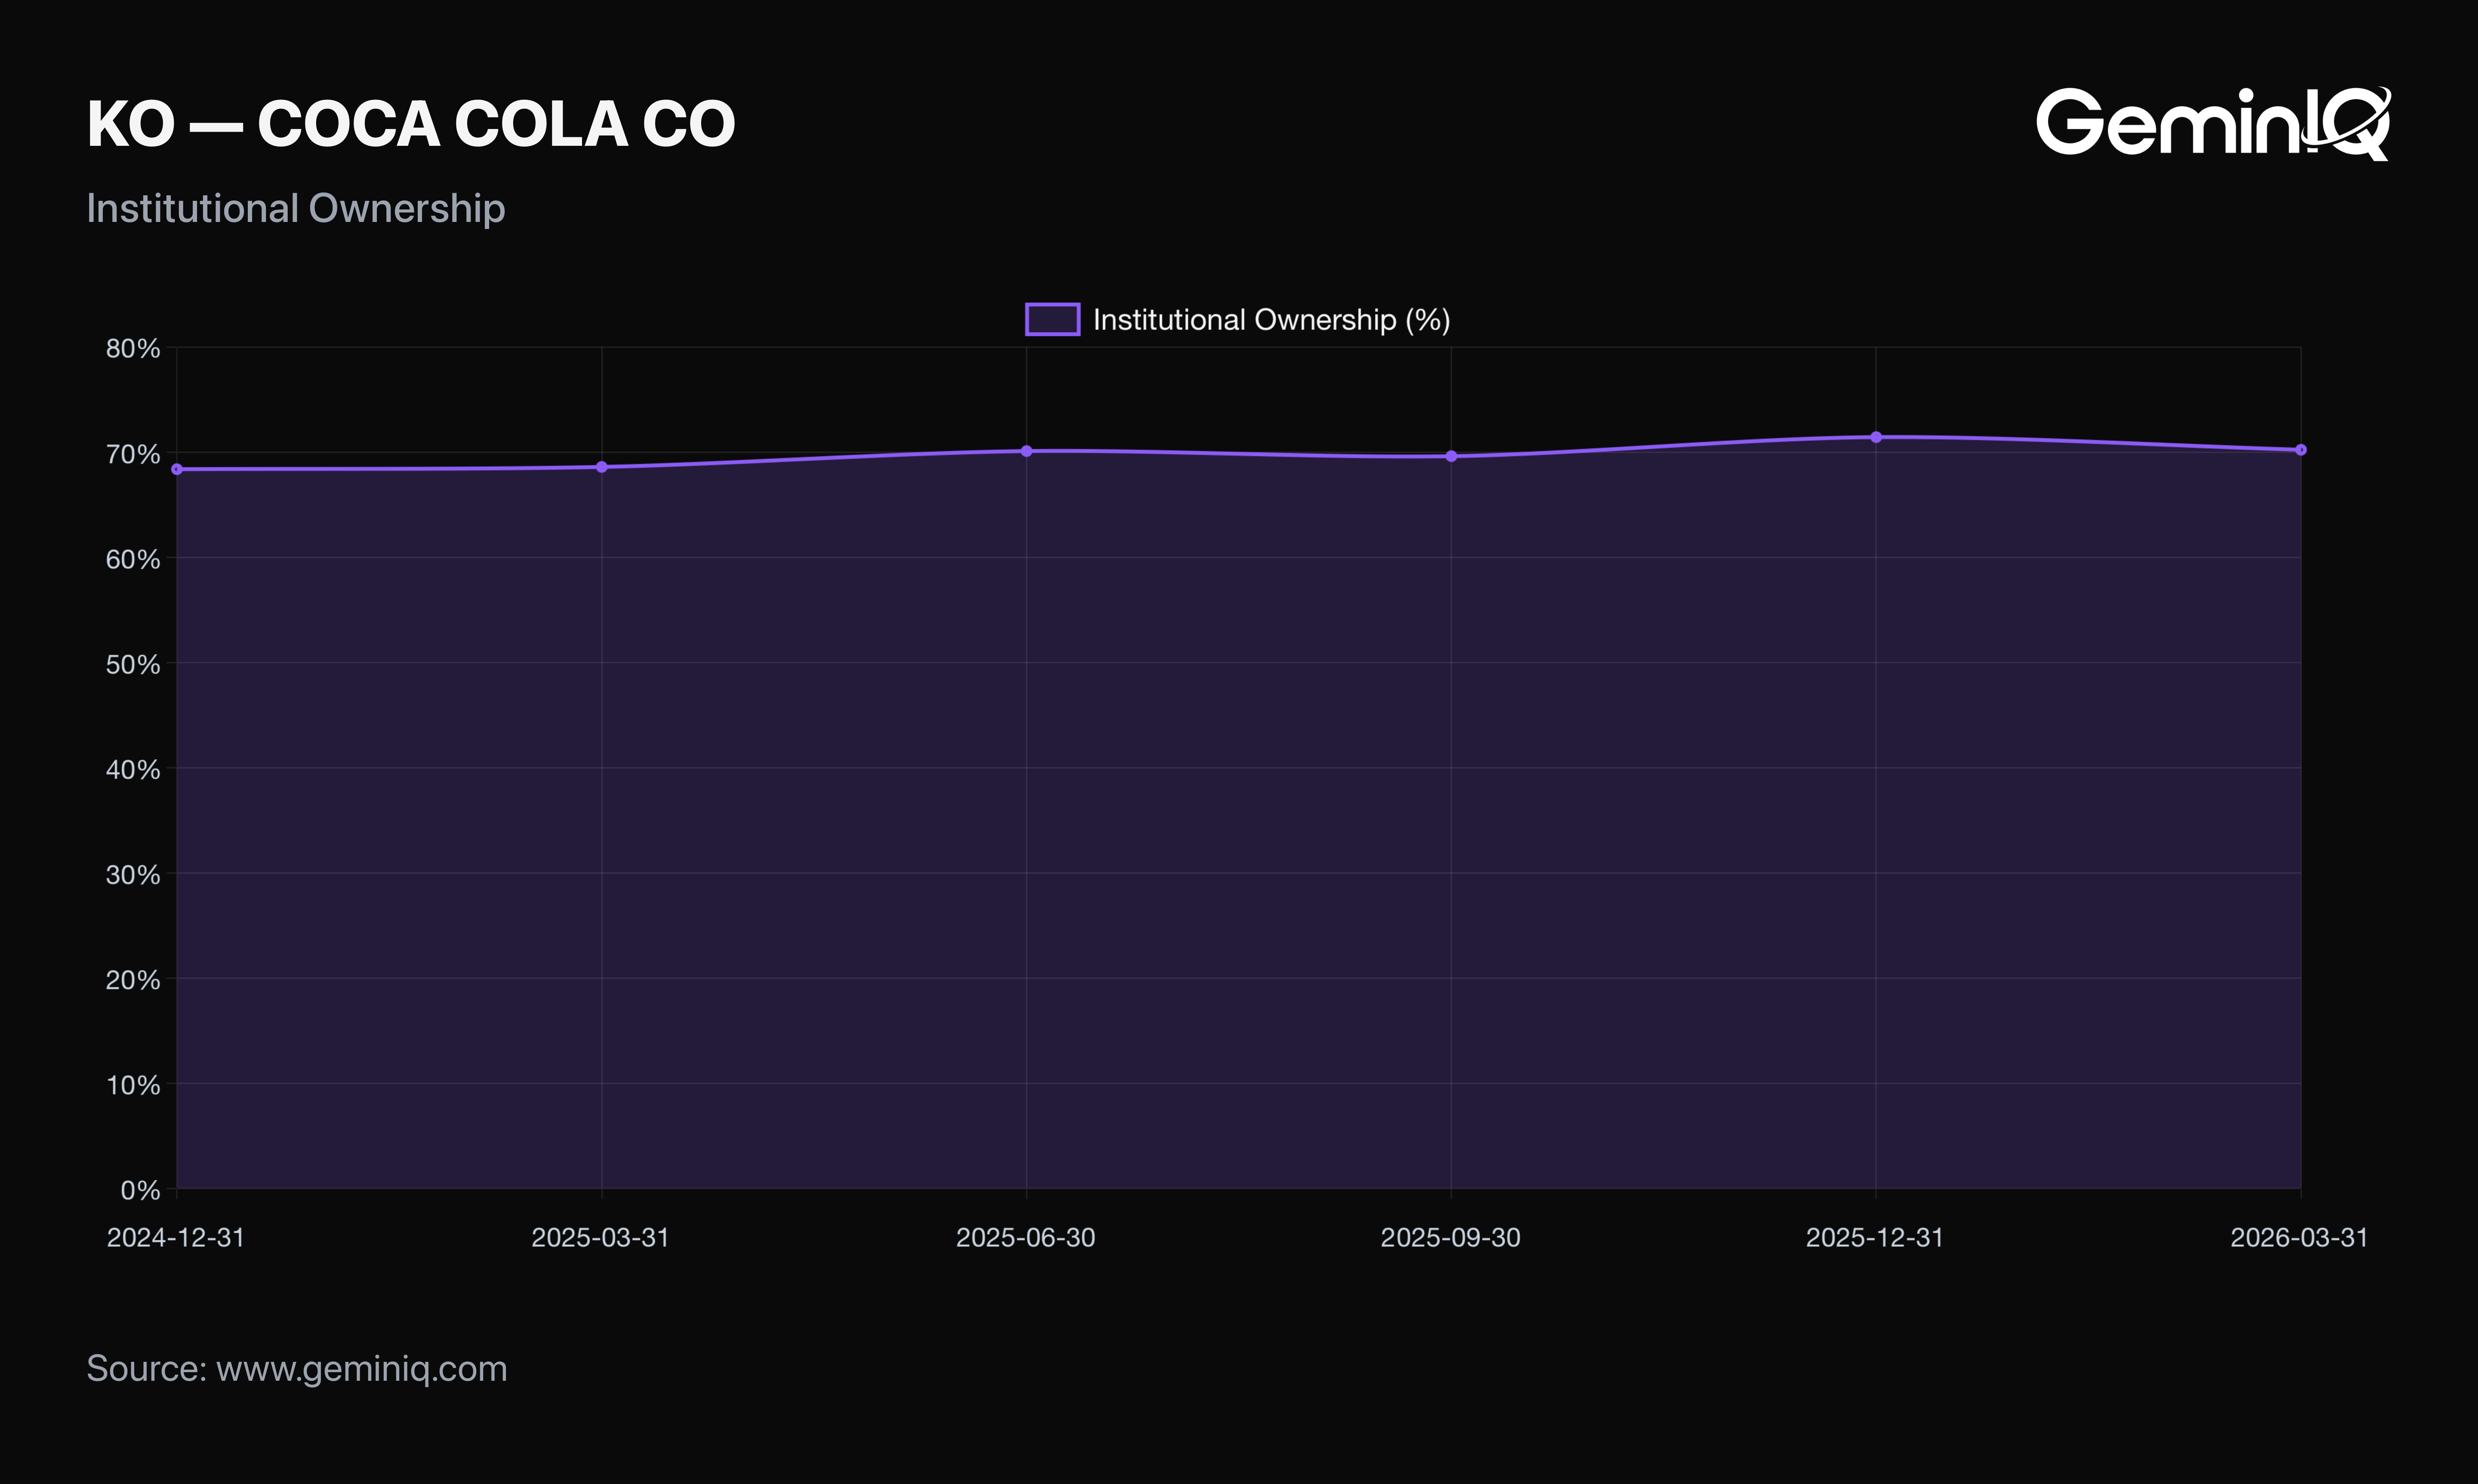
The Data: Institutional Ownership has climbed modestly, from 68.4% in December 2024 to 70.2% as of the most recent 13F (March 2026, filed with the standard lag). Insider Transactions show a heavily sale-weighted record: 376 sales against 36 purchases in the available history.
The GeminIQ Edge: Neither figure tells a dramatic story on its own, and that's worth saying plainly rather than manufacturing tension that isn't there. A steady, unremarkable institutional base and a sale-heavy insider pattern are what you'd expect from a mature, widely-held dividend compounder, not a signal in either direction.
Frequently Asked Questions
What does GeminIQ's data show about Coca-Cola's revenue growth?
Coca-Cola's TTM revenue has grown just 2.6% cumulatively since 2012 ($48.02 Billion to $49.28 Billion), effectively flat once inflation is considered over more than thirteen years.
How has Coca-Cola's operating margin changed despite flat revenue?
Operating Margin (TTM) has expanded from 22.4% in 2012 to 29.3% as of the Q1 FY2026 10-Q, driven by the company's shift away from capital-intensive bottling operations toward a brand-and-concentrate business model.
What is Coca-Cola's actual total debt?
As of the Q1 FY2026 10-Q, Coca-Cola's Total Debt is $43.89 Billion: $39.07 Billion in Long-Term Debt, $4.49 Billion in current maturities, and $332 Million in short-term notes and loans payable.
When did Coca-Cola last file its 10-Q, and what period does it cover?
Coca-Cola's most recent filing is a Form 10-Q filed April 30, 2026, covering the fiscal quarter ended April 3, 2026 (Q1 FY2026).
Wall Street's data. Main Street's price.
Institutional terminals charge thousands a year for as-filed accuracy. GeminIQ gives you the same thing for a fraction of the cost: financials built directly from raw SEC EDGAR filings, not third-party APIs, with full XBRL traceability back to the original 10-K or 10-Q. No normalized guesswork, just calculated metrics, charts, screeners, and watchlists built on numbers exactly as the company reported them. Start researching now at GeminIQ.com.
All financial figures cited in this article reference The Coca-Cola Company's Q1 FY2026 10-Q (filed April 30, 2026, period ending April 3, 2026). All SEC filings are publicly available at SEC EDGAR.
Disclaimer: The content in this blog is for educational and entertainment purposes only and does not constitute financial, legal, or tax advice. Investing involves risk, including the loss of principal. The views expressed are my own and not intended as financial advice or a guarantee of future performance.