
Companies That Restated Financials: What Followed

By Chad Hartman
Published · Last updated
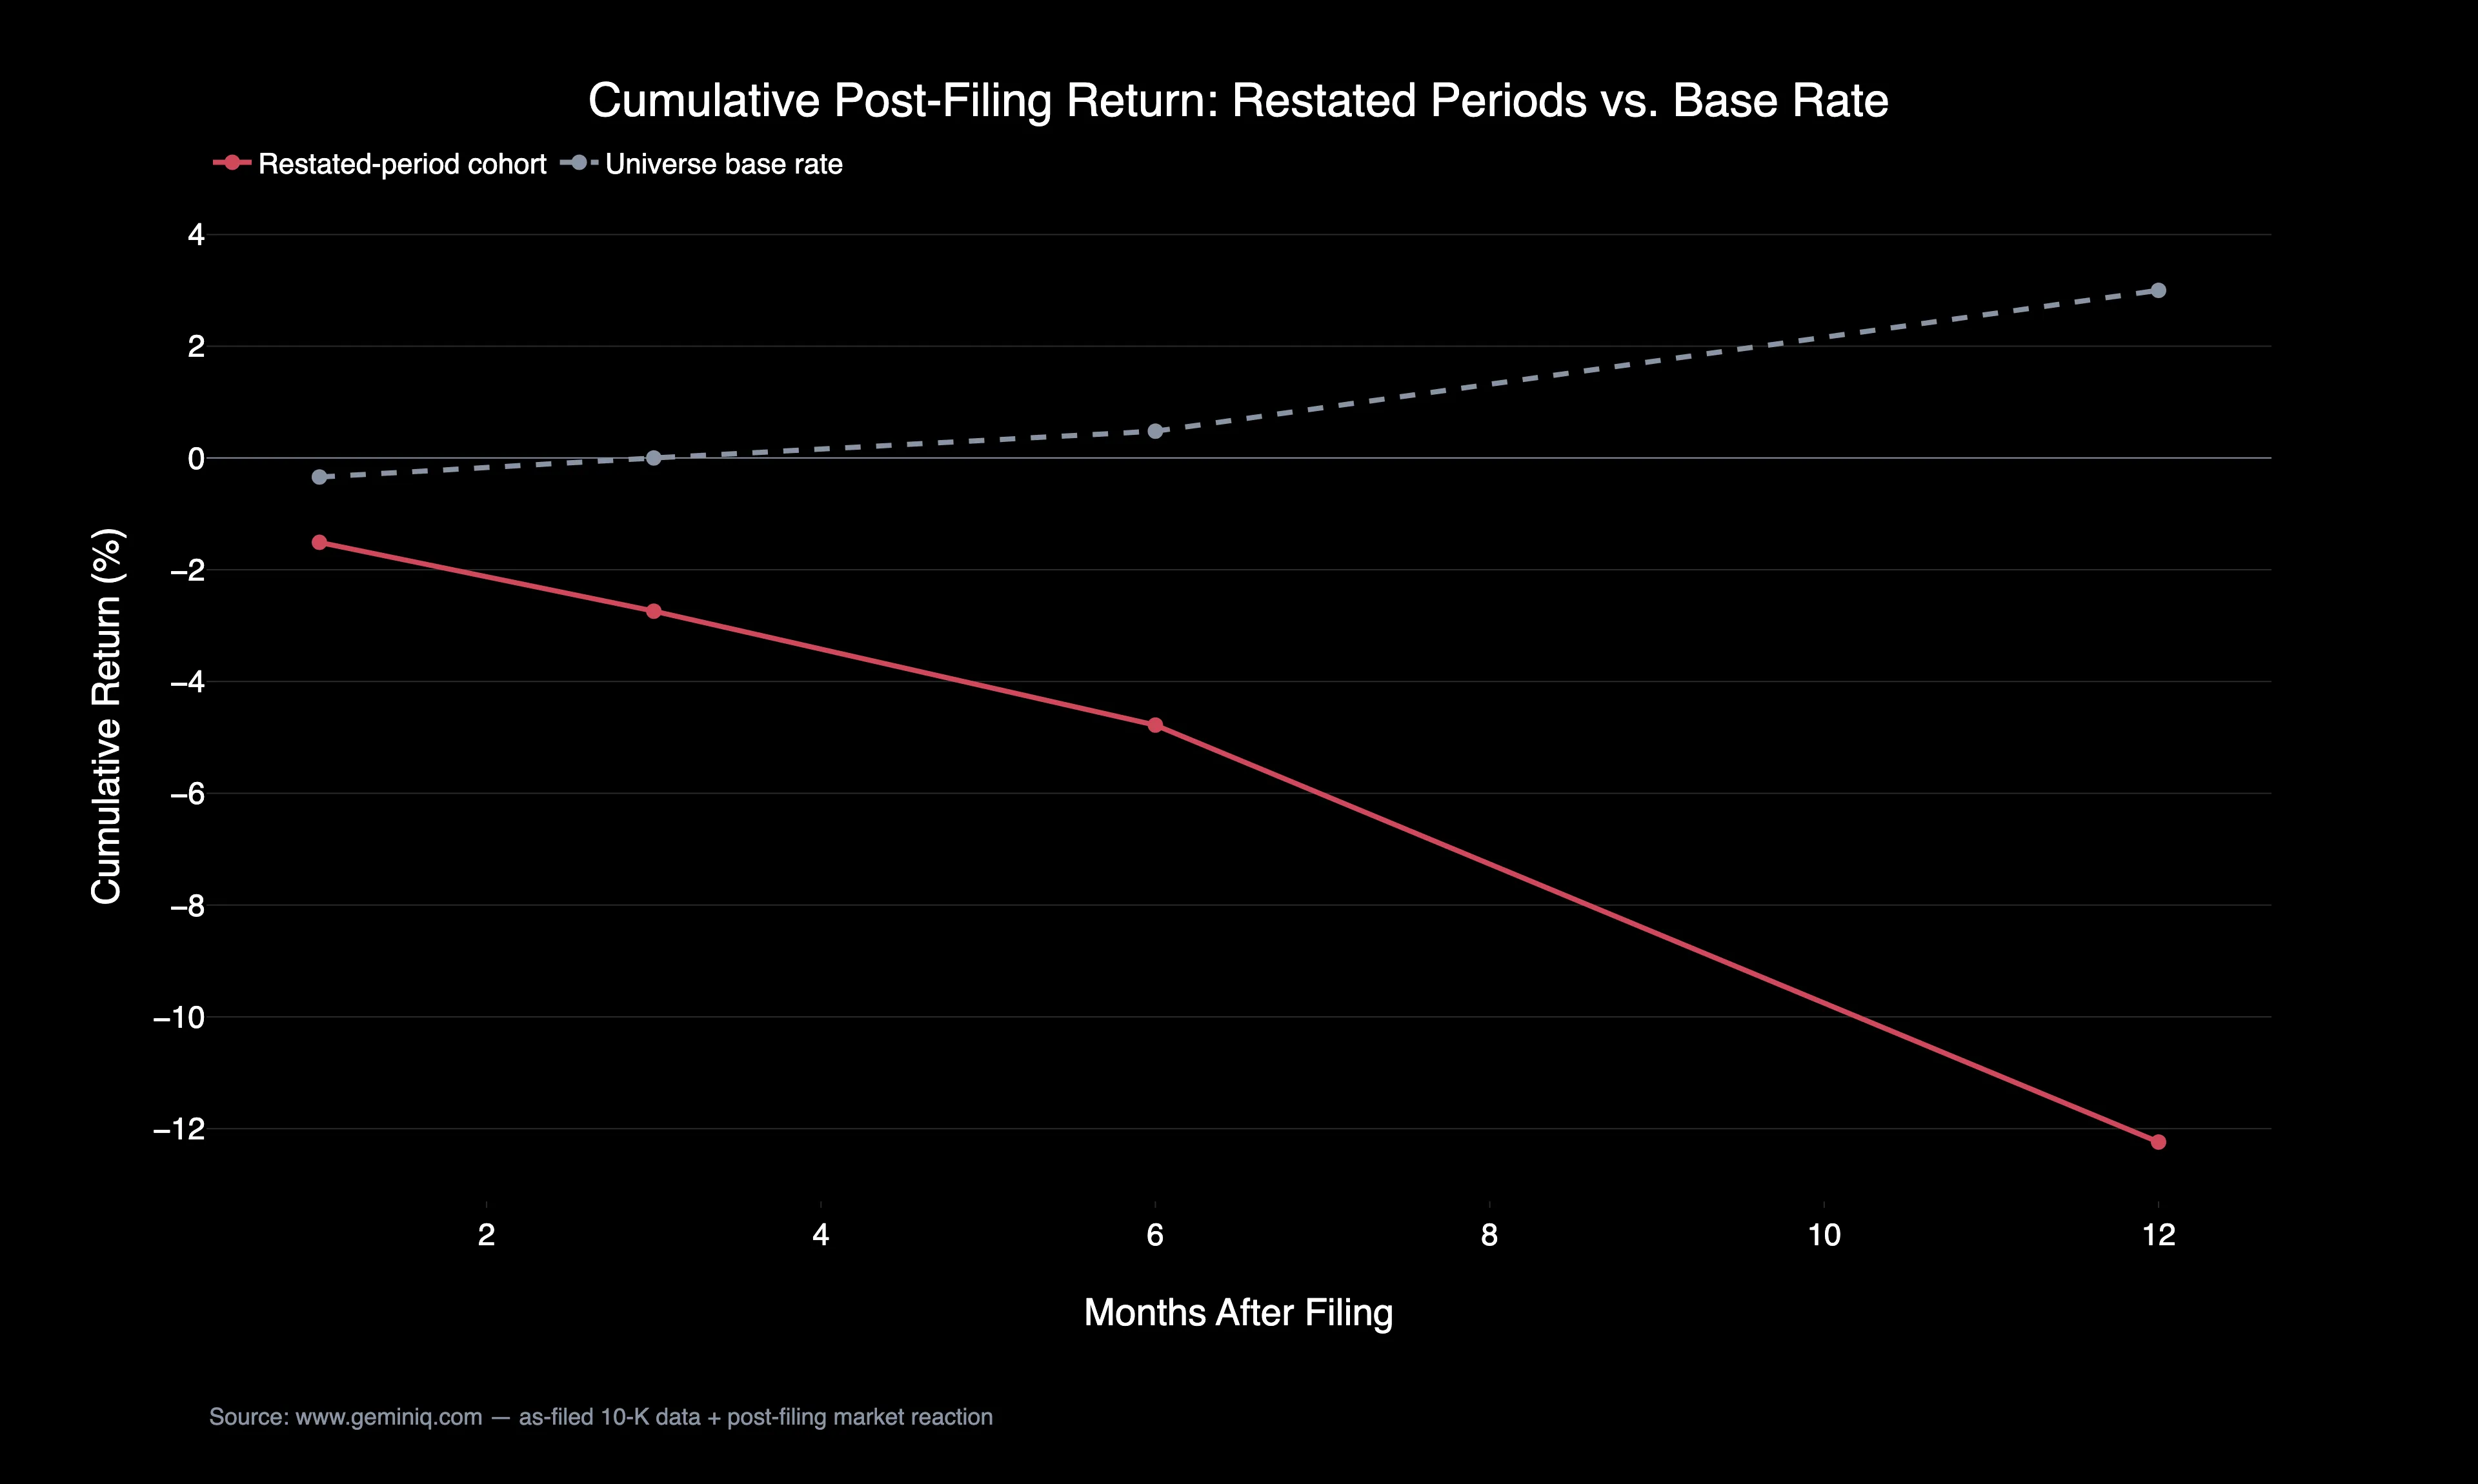
Emergent BioSolutions filed a restated period in fiscal 2022, and the twelve months that followed produced a cumulative return of -84.9%. That is an extreme case, but not an isolated one: across GeminIQ's full as-filed universe, the twelve months following a flagged restated period returned a median of -12.24%, against a +3.00% median for the broader filing universe over the same forward window — a gap of over 15 percentage points that widens the further out the window runs.
This study reads GeminIQ's as-filed annual filing universe, flagging restated periods directly in the arithmetic of each company's own quarterly-versus-annual revenue reconciliation. That is the same contamination-detection logic built for GeminIQ's revenue deceleration research, used here rather than any external restatement database. 95,653 annual filings make up the base universe, of which 3,157 carry the restatement flag, drawn from 3,997 distinct companies across the full historical record. This is a historical association measured over the sample window, not a forecast for any individual company.
The Pattern
A restated period is detectable before the market necessarily reacts to it as one, because the underlying arithmetic — a fiscal year's reported total that doesn't reconcile cleanly against the sum of its own quarters — is visible in the filing data itself, independent of whether the company used the word "restatement" in its own disclosure. The safer framing is association, not prediction: restated periods in this sample were followed by materially weaker returns over the subsequent year, not caused by the restatement flag itself, and plenty of individual companies in the flagged cohort recovered. But the base-rate gap is wide enough, and holds at every checkpoint from one month out to twelve, to be worth screening for directly.
The Data
| Forward Window | Restated-Period Cohort (median) | Universe Base Rate (median) | Excess |
|---|---|---|---|
| 1 month | -1.51% | -0.34% | -1.17 pts |
| 3 months | -2.74% | 0.00% | -2.74 pts |
| 6 months | -4.78% | +0.48% | -5.25 pts |
| 12 months | -12.24% | +3.00% | -15.24 pts |
Every checkpoint is measured against the broader universe base rate over the same window, not against zero, and every column is drawn from between 1,364 and 1,498 flagged filings — comfortably above the 200-filing floor this kind of comparison requires. The gap is not a one-quarter artifact; it widens steadily from the first month post-filing through the full year, consistent with a restated period being a genuine, persistent signal rather than a brief overreaction that fades.
The Ranking
Restricted to restated-period filings from companies with over $50 million in trailing annual revenue — filtering out micro-cap and shell-company noise — the ten steepest 12-month post-filing declines in GeminIQ's data are:
| Rank | Company | Ticker | Fiscal Year Flagged | 12-Month Forward Return |
|---|---|---|---|---|
| 1 | Exela Technologies, Inc. | XELA | 2021 | -99.4% |
| 2 | Skillz Inc. | SKLZ | 2020 | -87.2% |
| 3 | Cardlytics, Inc. | CDLX | 2021 | -86.7% |
| 4 | New Fortress Energy Inc. | NFE | 2024 | -86.0% |
| 5 | Emergent BioSolutions Inc. | EBS | 2022 | -84.9% |
| 6 | Accuray Inc | ARAY | 2025 | -84.6% |
| 7 | Owlet, Inc. | OWLT | 2020 | -83.8% |
| 8 | Onity Group Inc. | ONIT | 2013 | -83.4% |
| 9 | Katapult Holdings, Inc. | KPLT | 2020 | -82.7% |
| 10 | Purple Innovation, Inc. | PRPL | 2020 | -79.0% |
The Extremes
Exela Technologies carries a restated-period flag in two separate fiscal years in GeminIQ's data — 2020 and 2021 — with 12-month forward returns of -70.5% and -99.4% respectively, the kind of repeat appearance that separates a company working through a one-time accounting issue from one with a more persistent problem. Skillz Inc., flagged in fiscal 2020, returned -87.2% over the following year. Neither case proves the restatement itself caused the decline — both companies faced other well-documented business pressures over the same period — but both are visible in the filing arithmetic well before either became a widely covered story.
The Method
A period is flagged as restated when GeminIQ's contamination-detection logic finds the fiscal-year annual figure doesn't reconcile against the sum of the company's own reported quarters for that year, benchmarked against that specific company's own historical median quarterly share of its annual total. This is the same detection built for GeminIQ's revenue deceleration research. Post-filing returns are cumulative from each filing's own filed date and are never compounded or added across checkpoints; the 12-month figure is read directly from the filing's own twelfth-month cumulative return column, not derived by summing the shorter windows. Returns behind every checkpoint in this study are winsorized at the 1st and 99th percentile before medians are computed, so a handful of extreme filings do not carry the result. Full methodology is covered in How GeminIQ Builds Filing Data Studies.
Check Your Holdings
Pull up any position's as-filed quarterly revenue on GeminIQ and check whether the four quarters actually sum to the reported annual total — a mismatch is a filing-level fact anyone can verify directly against the company's own numbers, independent of whether a restatement has been publicly announced. Running that reconciliation is a method, not a prediction: it flags what's worth a closer look, not what to buy or sell.
Frequently Asked Questions
How can a financial restatement be detected directly from filing data?
By checking whether a fiscal year's reported annual figure reconciles against the sum of that company's own four reported quarters. GeminIQ flags a period as restated when that arithmetic doesn't hold, benchmarked against the company's own historical quarterly pattern — independent of whether the company used the word "restatement" in its own disclosure.
What happens to a stock's returns after a restated filing?
In GeminIQ's data, the twelve months following a flagged restated period returned a median of -12.24%, against +3.00% for the broader filing universe over the same window — a gap that widens steadily from one month out to twelve.
Does a restatement always predict a stock decline?
No — this is a historical association measured across the sample, not a forecast for any individual company. Plenty of individual companies in the flagged cohort recovered, and the restatement itself does not cause the decline; both often trace to the same underlying business pressures.
How many restated filings does this study cover?
3,157 flagged restated periods out of 95,653 annual filings in the base universe, drawn from 3,997 distinct companies across GeminIQ's full historical record.
Wall Street's data. Main Street's price.
Institutional terminals charge thousands a year for as-filed accuracy. GeminIQ gives you the same thing for a fraction of the cost: financials built directly from raw SEC EDGAR filings, not third-party APIs, with full XBRL traceability back to the original 10-K or 10-Q. No normalized guesswork, just calculated metrics, charts, screeners, and watchlists built on numbers exactly as the company reported them. Start researching now at GeminIQ.com.
All figures are drawn from each company's as-filed 10-K filings, publicly available on SEC EDGAR. Post-filing market reaction is measured from each filing's filed date. Restatement detection methodology is described above.
Disclaimer: The content in this blog is for educational and entertainment purposes only and does not constitute financial, legal, or tax advice. Investing involves risk, including the loss of principal. The views expressed are my own and not intended as financial advice or a guarantee of future performance.