
Costco Stock Analysis (2026): How 3.8% Margin Earns 33% ROIC

By Chad Hartman
Published · Last updated
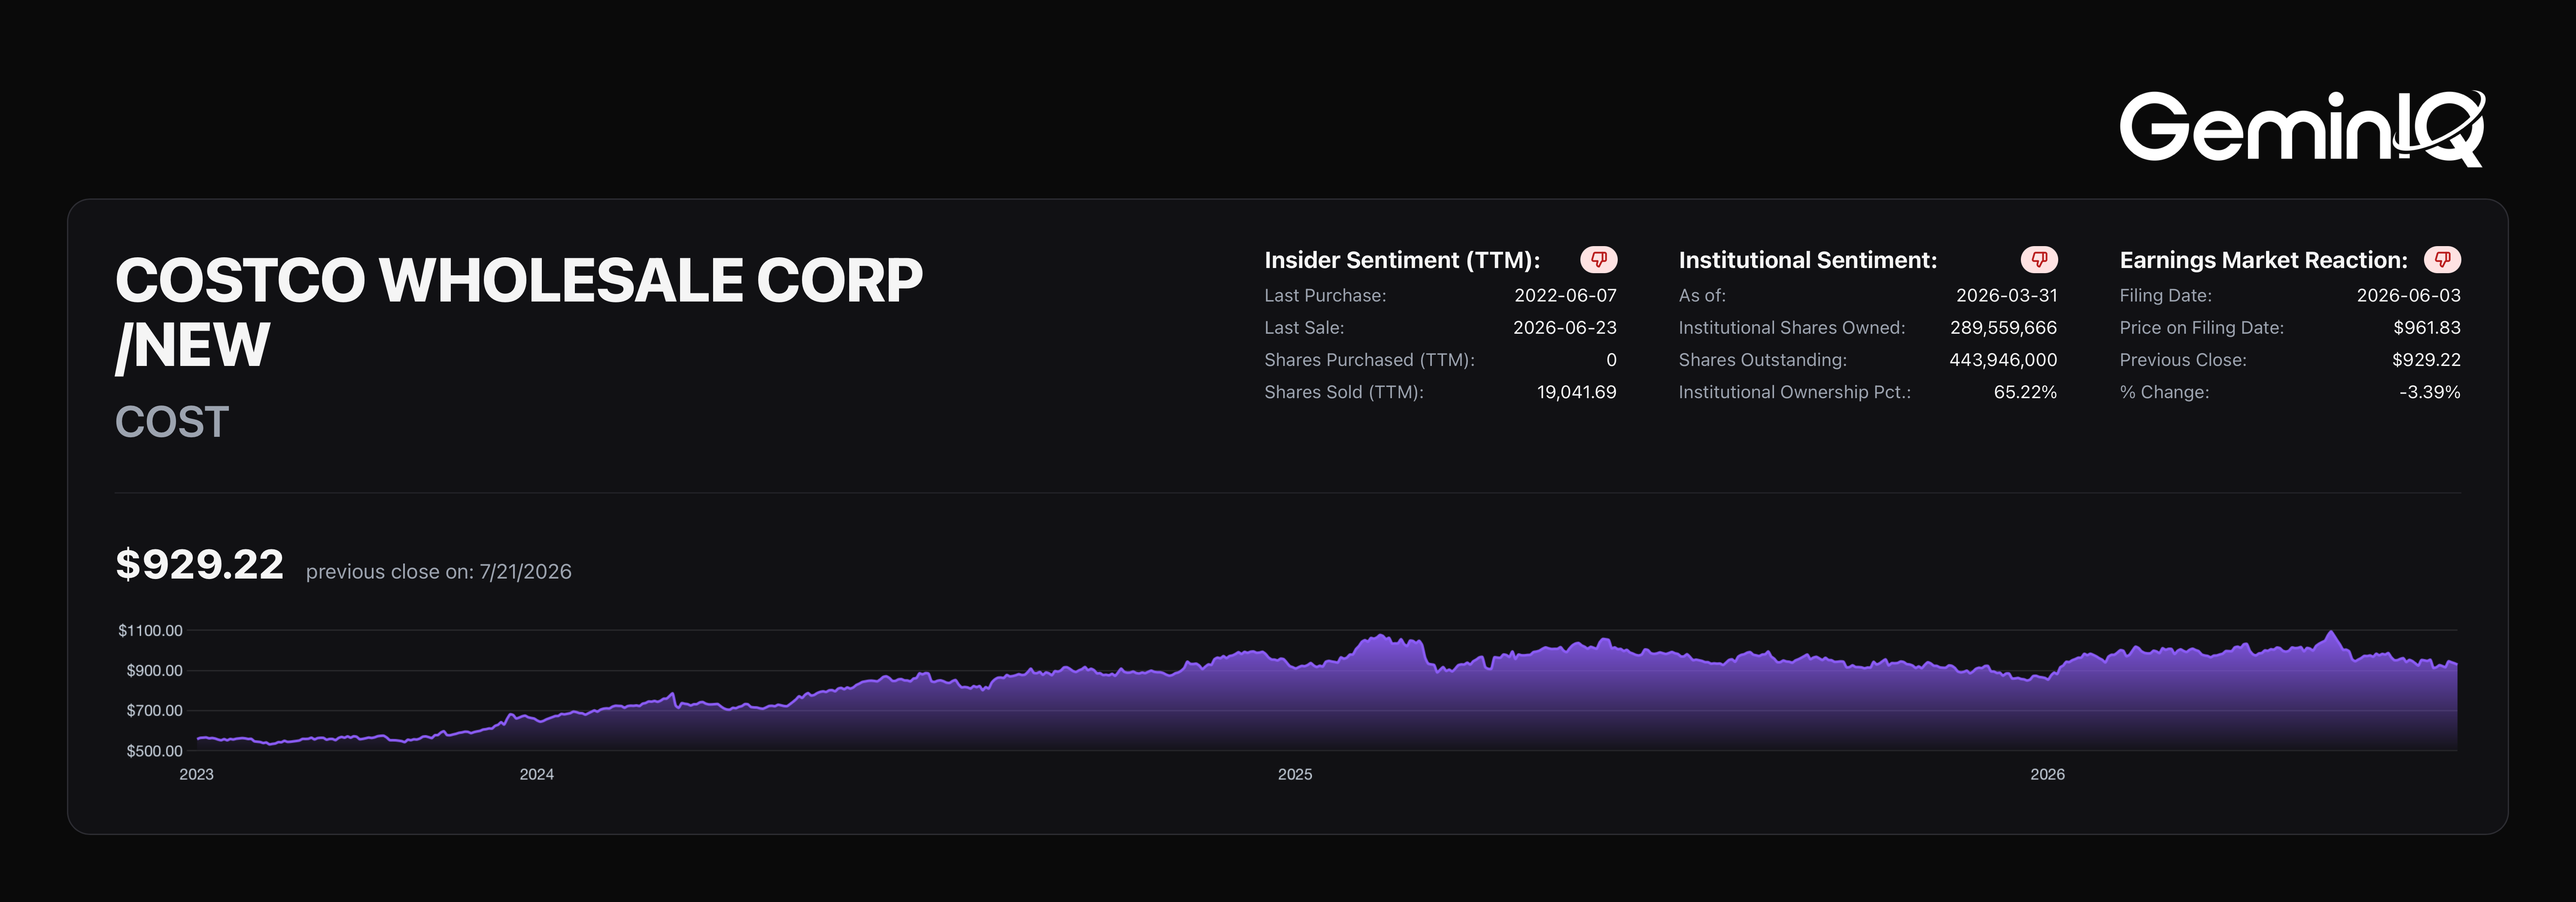
Costco Wholesale Corporation ($COST) just dropped its Q3 FY2026 10-Q (filed June 3, 2026). The surface-level headlines look identical to every other quarter: thin margins, same-store sales chatter, and the usual argument over whether a 50.8x P/E makes sense for a grocer. Every financial commentator frames Costco as a "low-margin retailer" trading at an irrational premium. The raw filing data tells a more interesting story — and this quarter, that includes catching our own platform citing a stale number.
| Field | Value |
|---|---|
| Ticker | $COST |
| Filing | Q3 FY2026 10-Q |
| Filed | June 3, 2026 |
| Period End | May 10, 2026 |
| ROIC (TTM) | 33.4% |
| Gross Margin (TTM) | 12.88% |
The 12.9% Gross Margin "Trap"
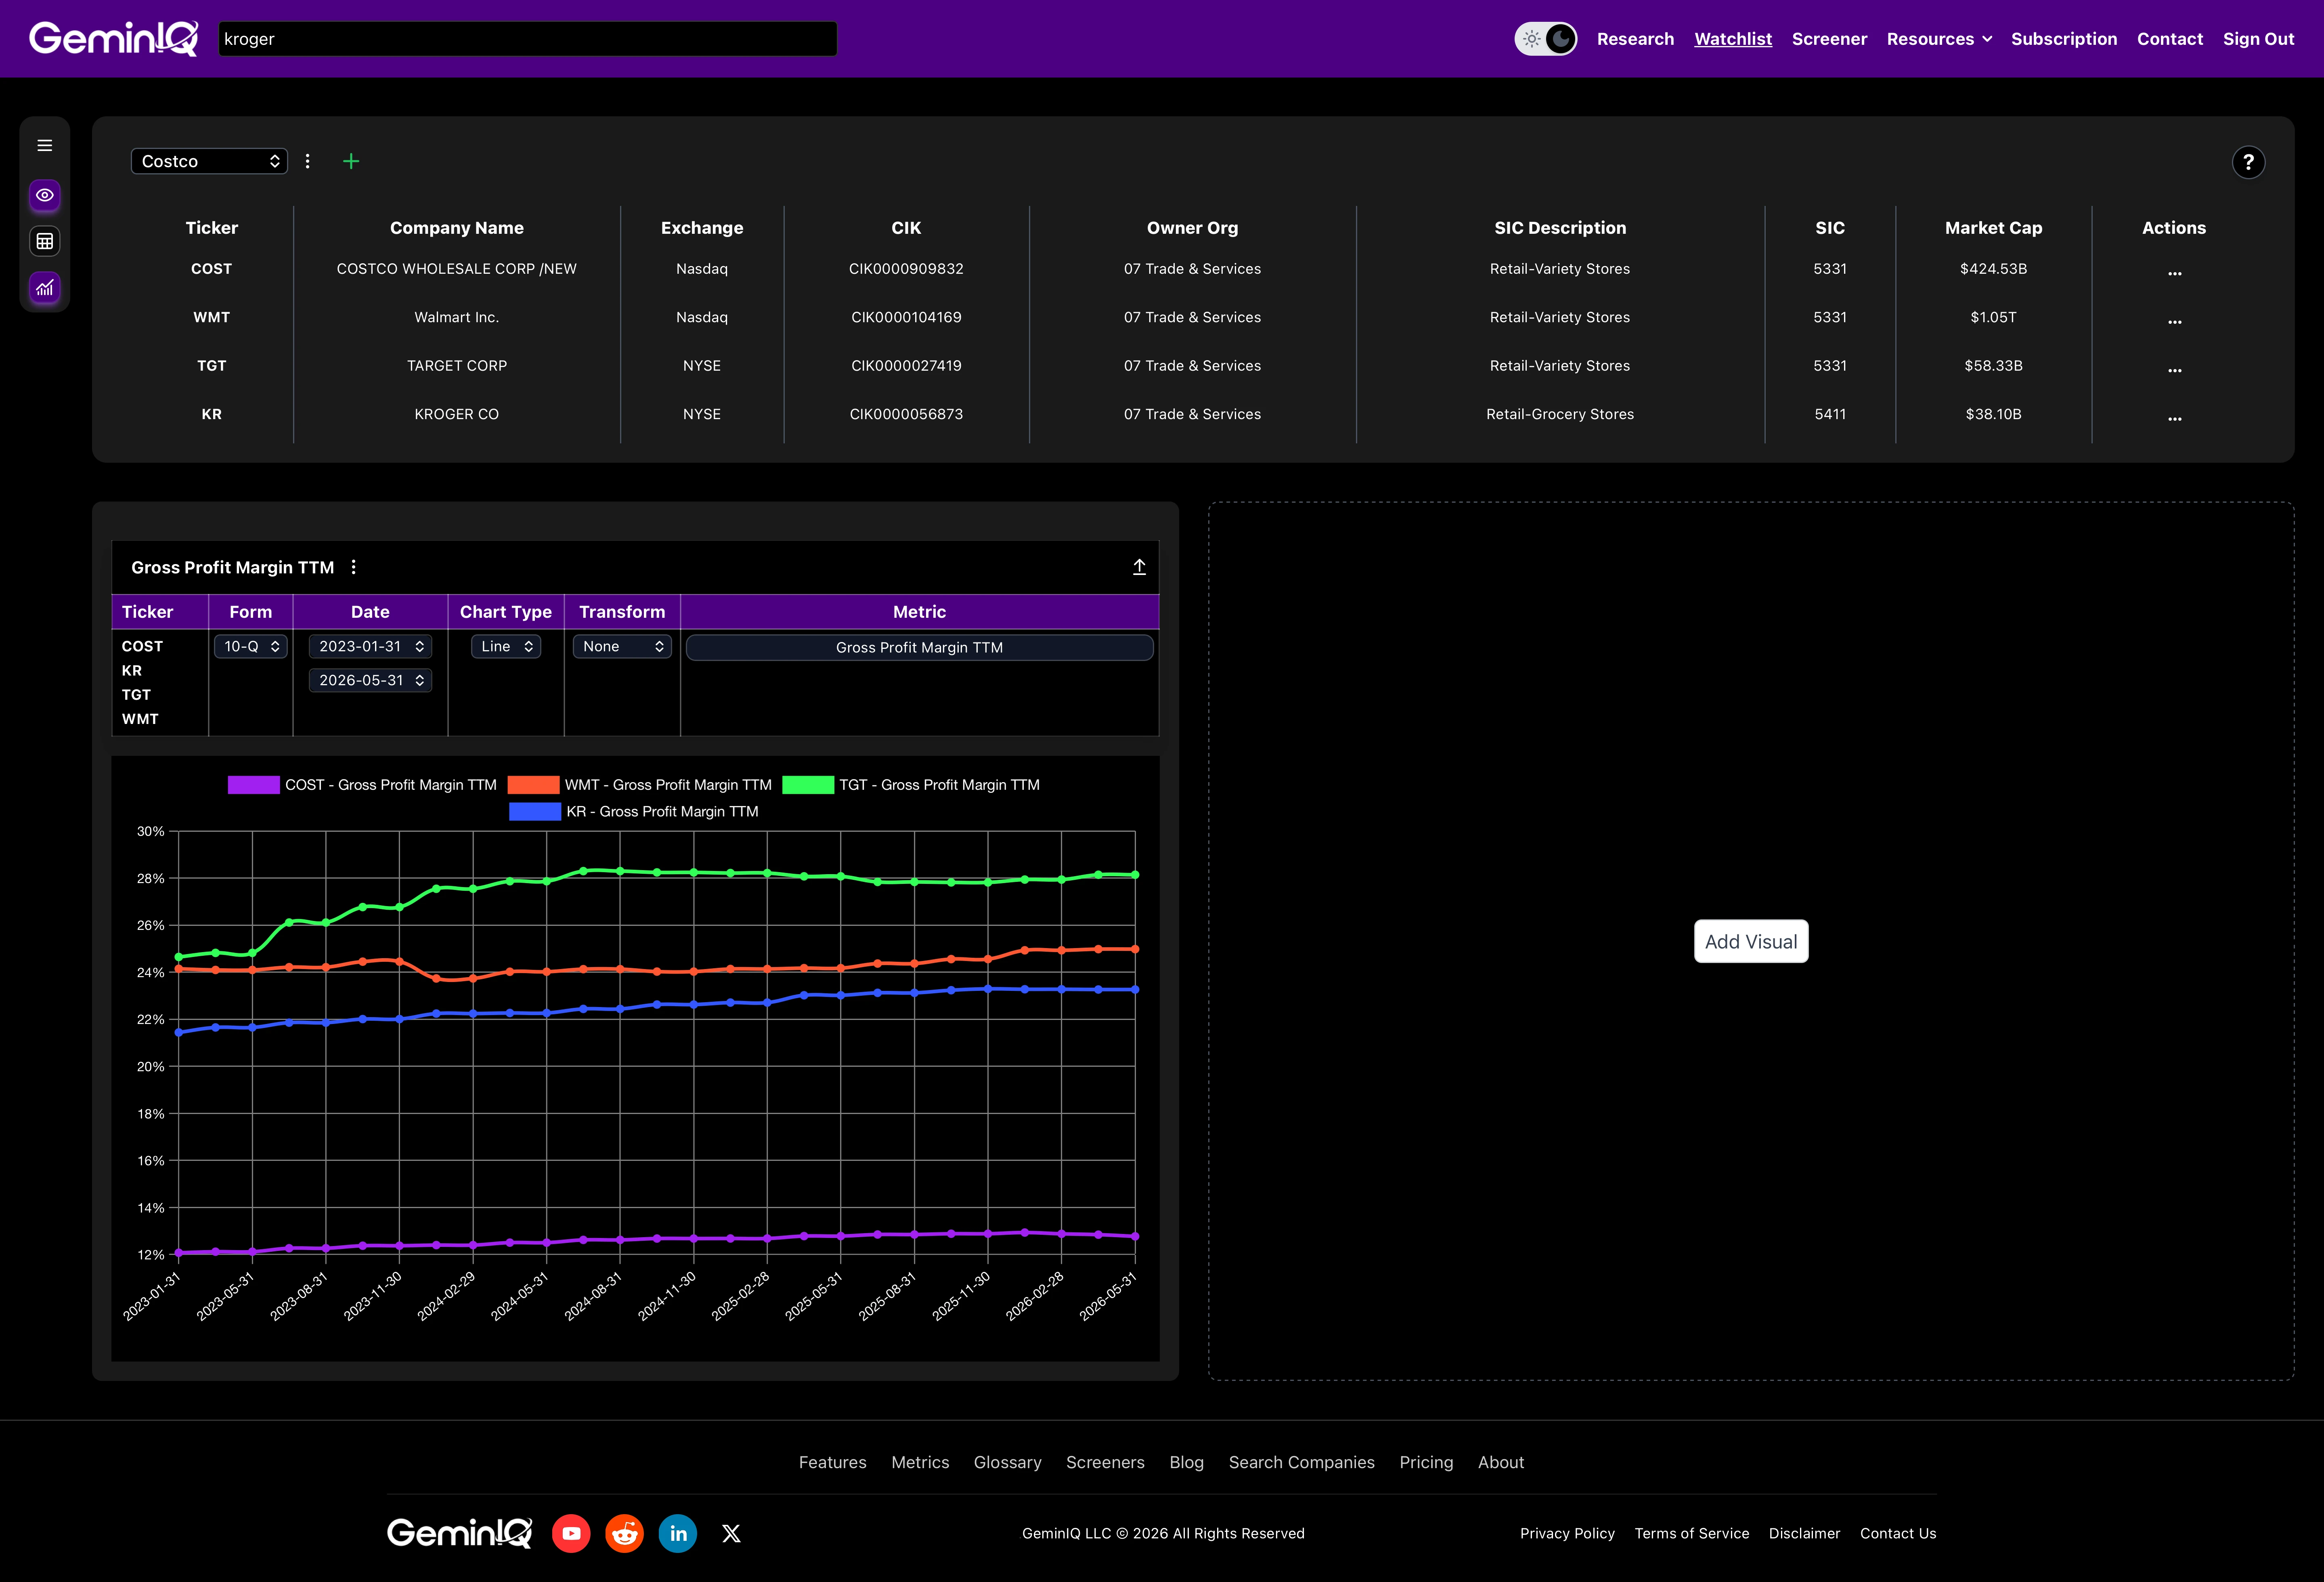
Screen Costco against any other major retailer and it looks structurally broken. GeminIQ's Calculated Metrics show Walmart running a 24.98% TTM gross margin, Target at 28.14%, and even a notoriously thin-margin grocer like Kroger clearing 23.18%. Costco posts 12.88% gross margin TTM — less than half of any of them.
The Data: On the Q3 FY2026 10-Q, Costco posted a TTM operating margin of just 3.82% on 12.88% gross margin — a spread that would sink most retailers but funds one of the highest capital-efficiency engines in the S&P 500, covered next.
The GeminIQ Edge: A standard screener flags this as a red flag. Pulling the raw Income Statement quarter by quarter via GeminIQ's Custom Table shows Costco is intentionally running the thinnest possible gross margin. This isn't weakness — it's the moat. Management prices merchandise near breakeven specifically to drive the number that actually matters: membership renewals. The merchandise business is a loss leader for the real product.
The ROIC Reality Check
Here's where it gets uncomfortable in a useful way. Our last teardown of this ticker cited a 42.68% Return on Invested Capital. That number was wrong, and here's exactly why, because burying it would defeat the point of this whole platform.
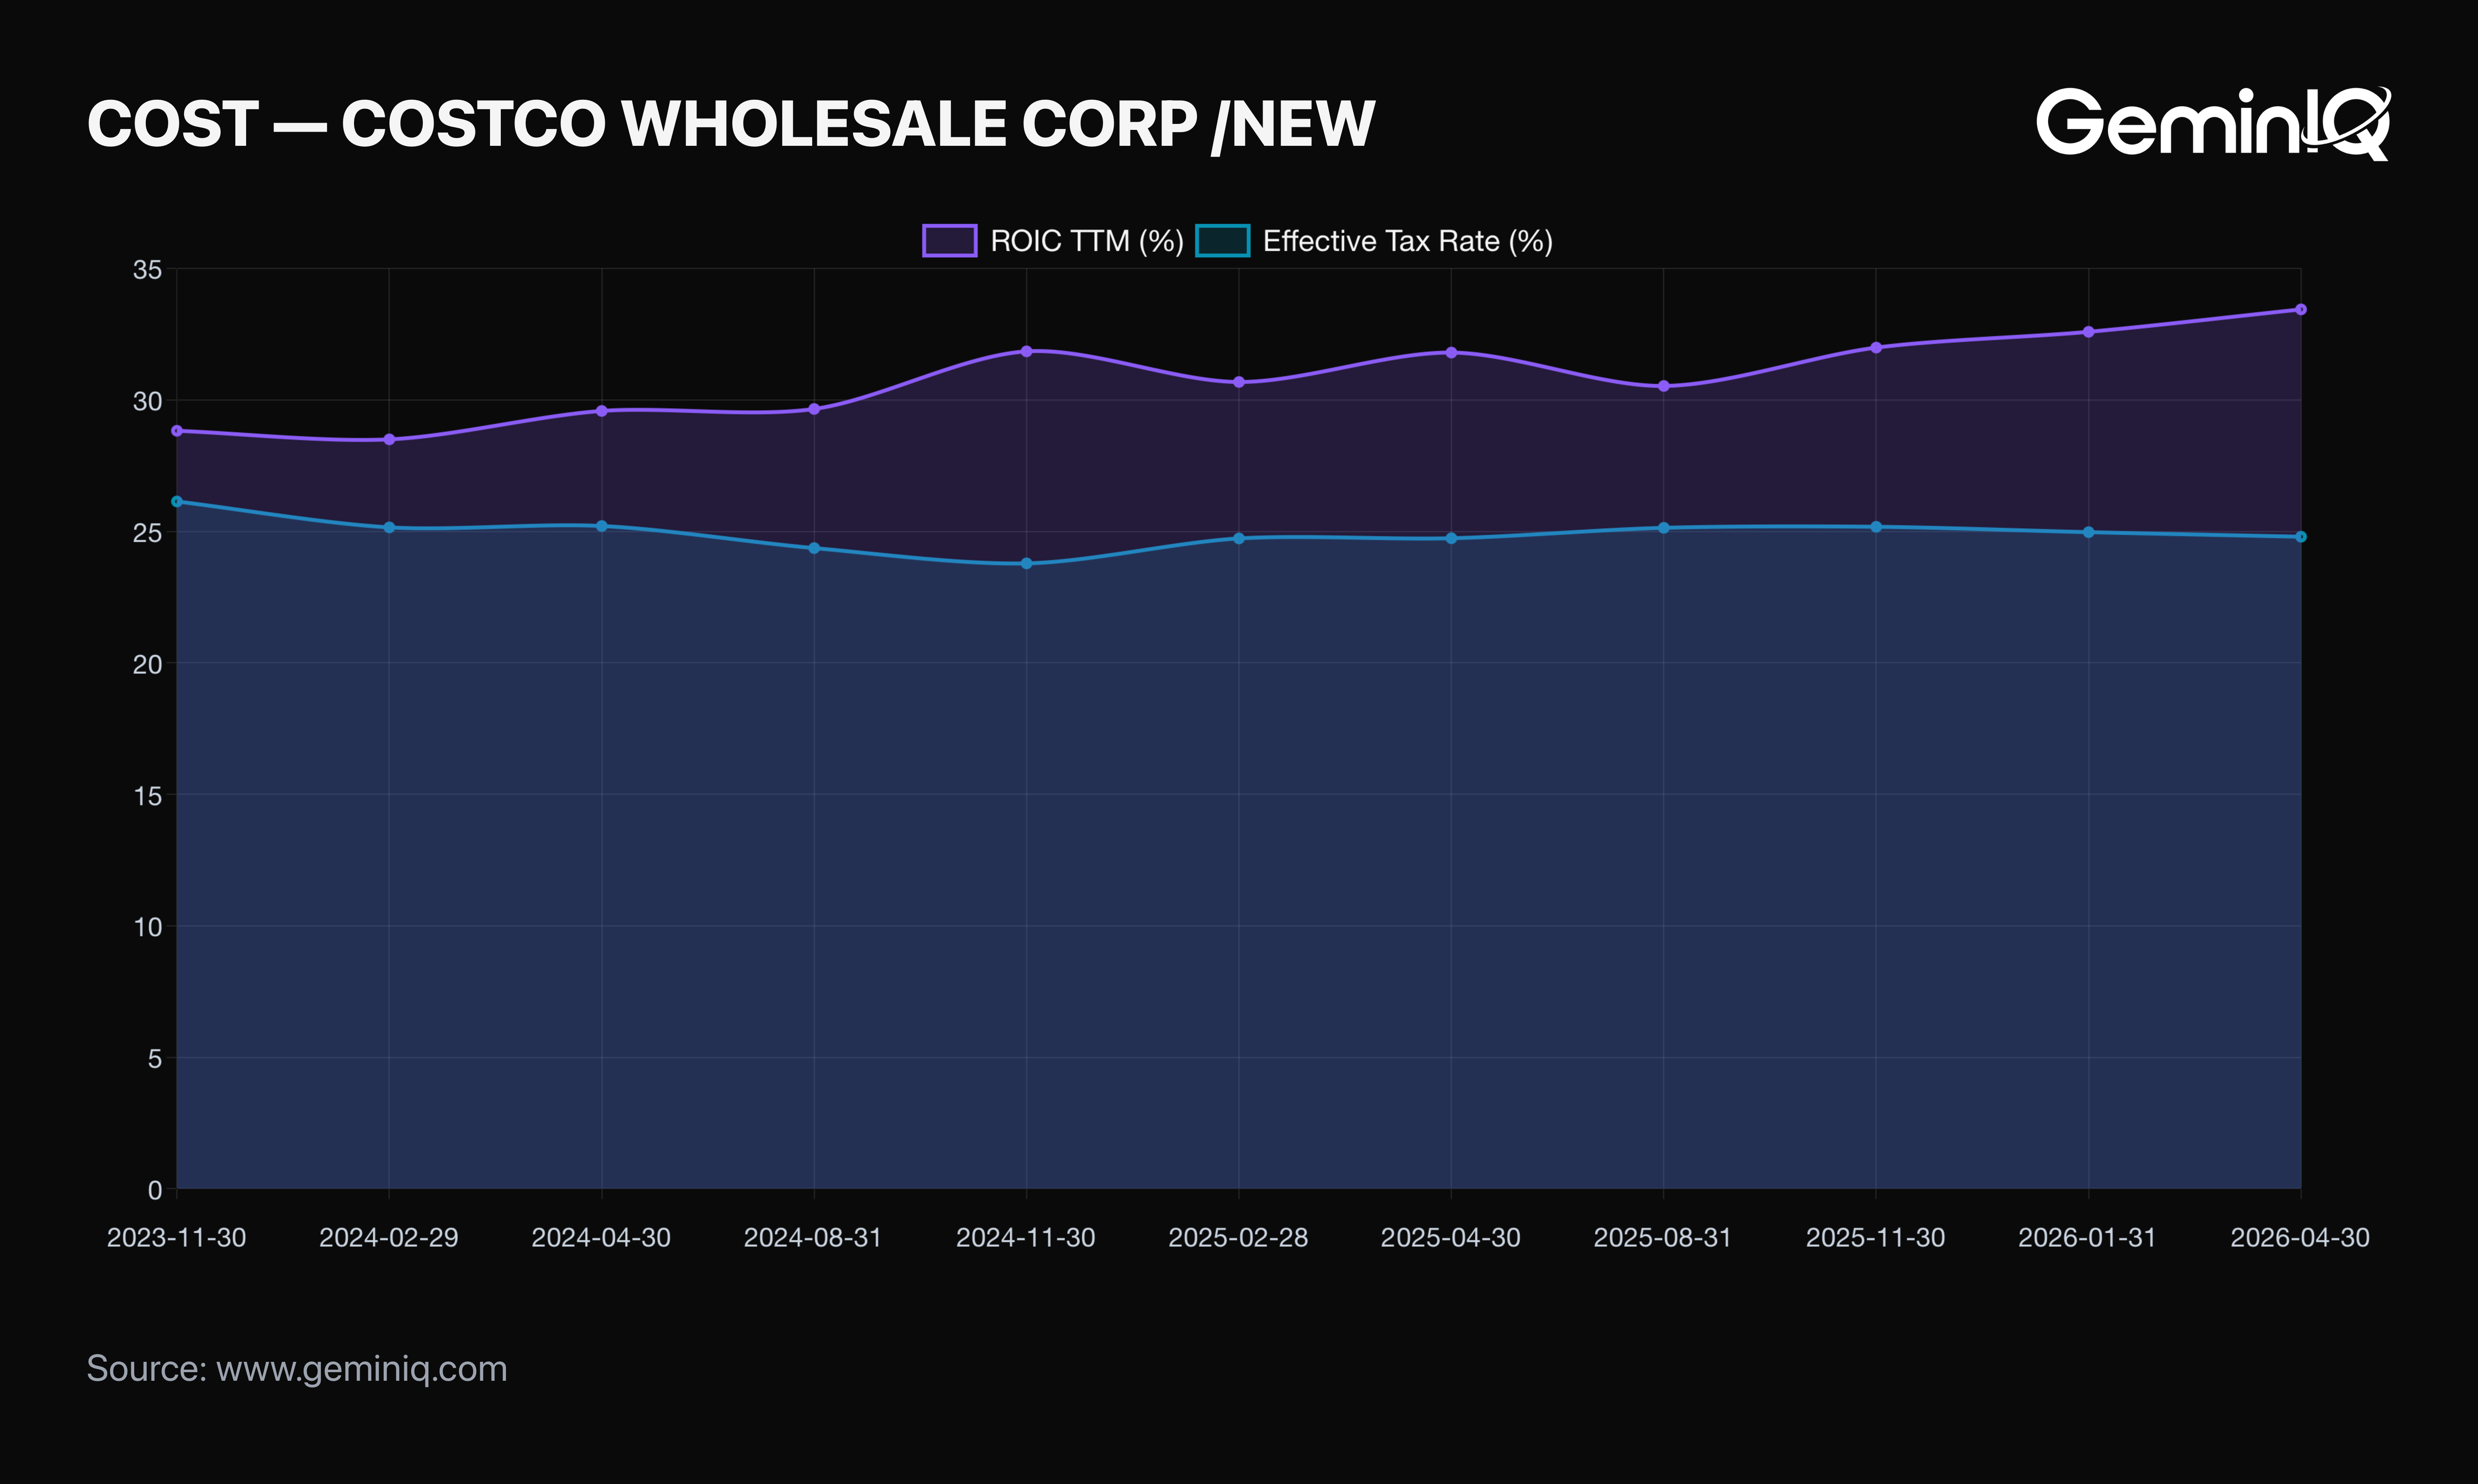
The Data: ROIC depends on NOPAT, which depends on the effective tax rate. Cross-checking Costco's filed tax provision against pretax income puts the real trailing effective rate at 24.8%, not the flat 21% a quick calculation reaches for. The full chain: TTM EBIT of $11.23 Billion, taxed at 24.8%, produces NOPAT of $8.44 Billion against Average Invested Capital of $25.24 Billion — a Return on Invested Capital of 33.4% TTM, roughly 9 percentage points below the figure we previously published, and up steadily from 28.8% in November 2023.
The GeminIQ Edge: The gap traced back to a resolver issue: Costco began tagging its pretax income line with an atypical XBRL concept that didn't match our tax-rate lookup, so the calculation fell back to a flat 21% statutory assumption. Worth being precise about how much that actually explains, because it is far less than it looks. Holding EBIT and invested capital fixed, swapping 24.8% back to 21% lifts ROIC only to 35.1% — under two points. The remaining seven points came from the denominator: reproducing 42.68% requires an invested capital base near $19.78 Billion, against the $25.24 Billion the filings actually support. The tax rate was the visible error. The capital base was the expensive one. We catch both by cross-referencing Calculated Metrics against raw filed figures rather than trusting a single derived output — the same discipline we'd expect a reader to apply to any platform's number, including ours. 33.4% ROIC on a 3.82% operating margin is still an exceptional result. It's just the accurate one.
The $3.2 Billion Float
So where does 30%+ ROIC come from on a near-breakeven merchandise business? The balance sheet answers directly.
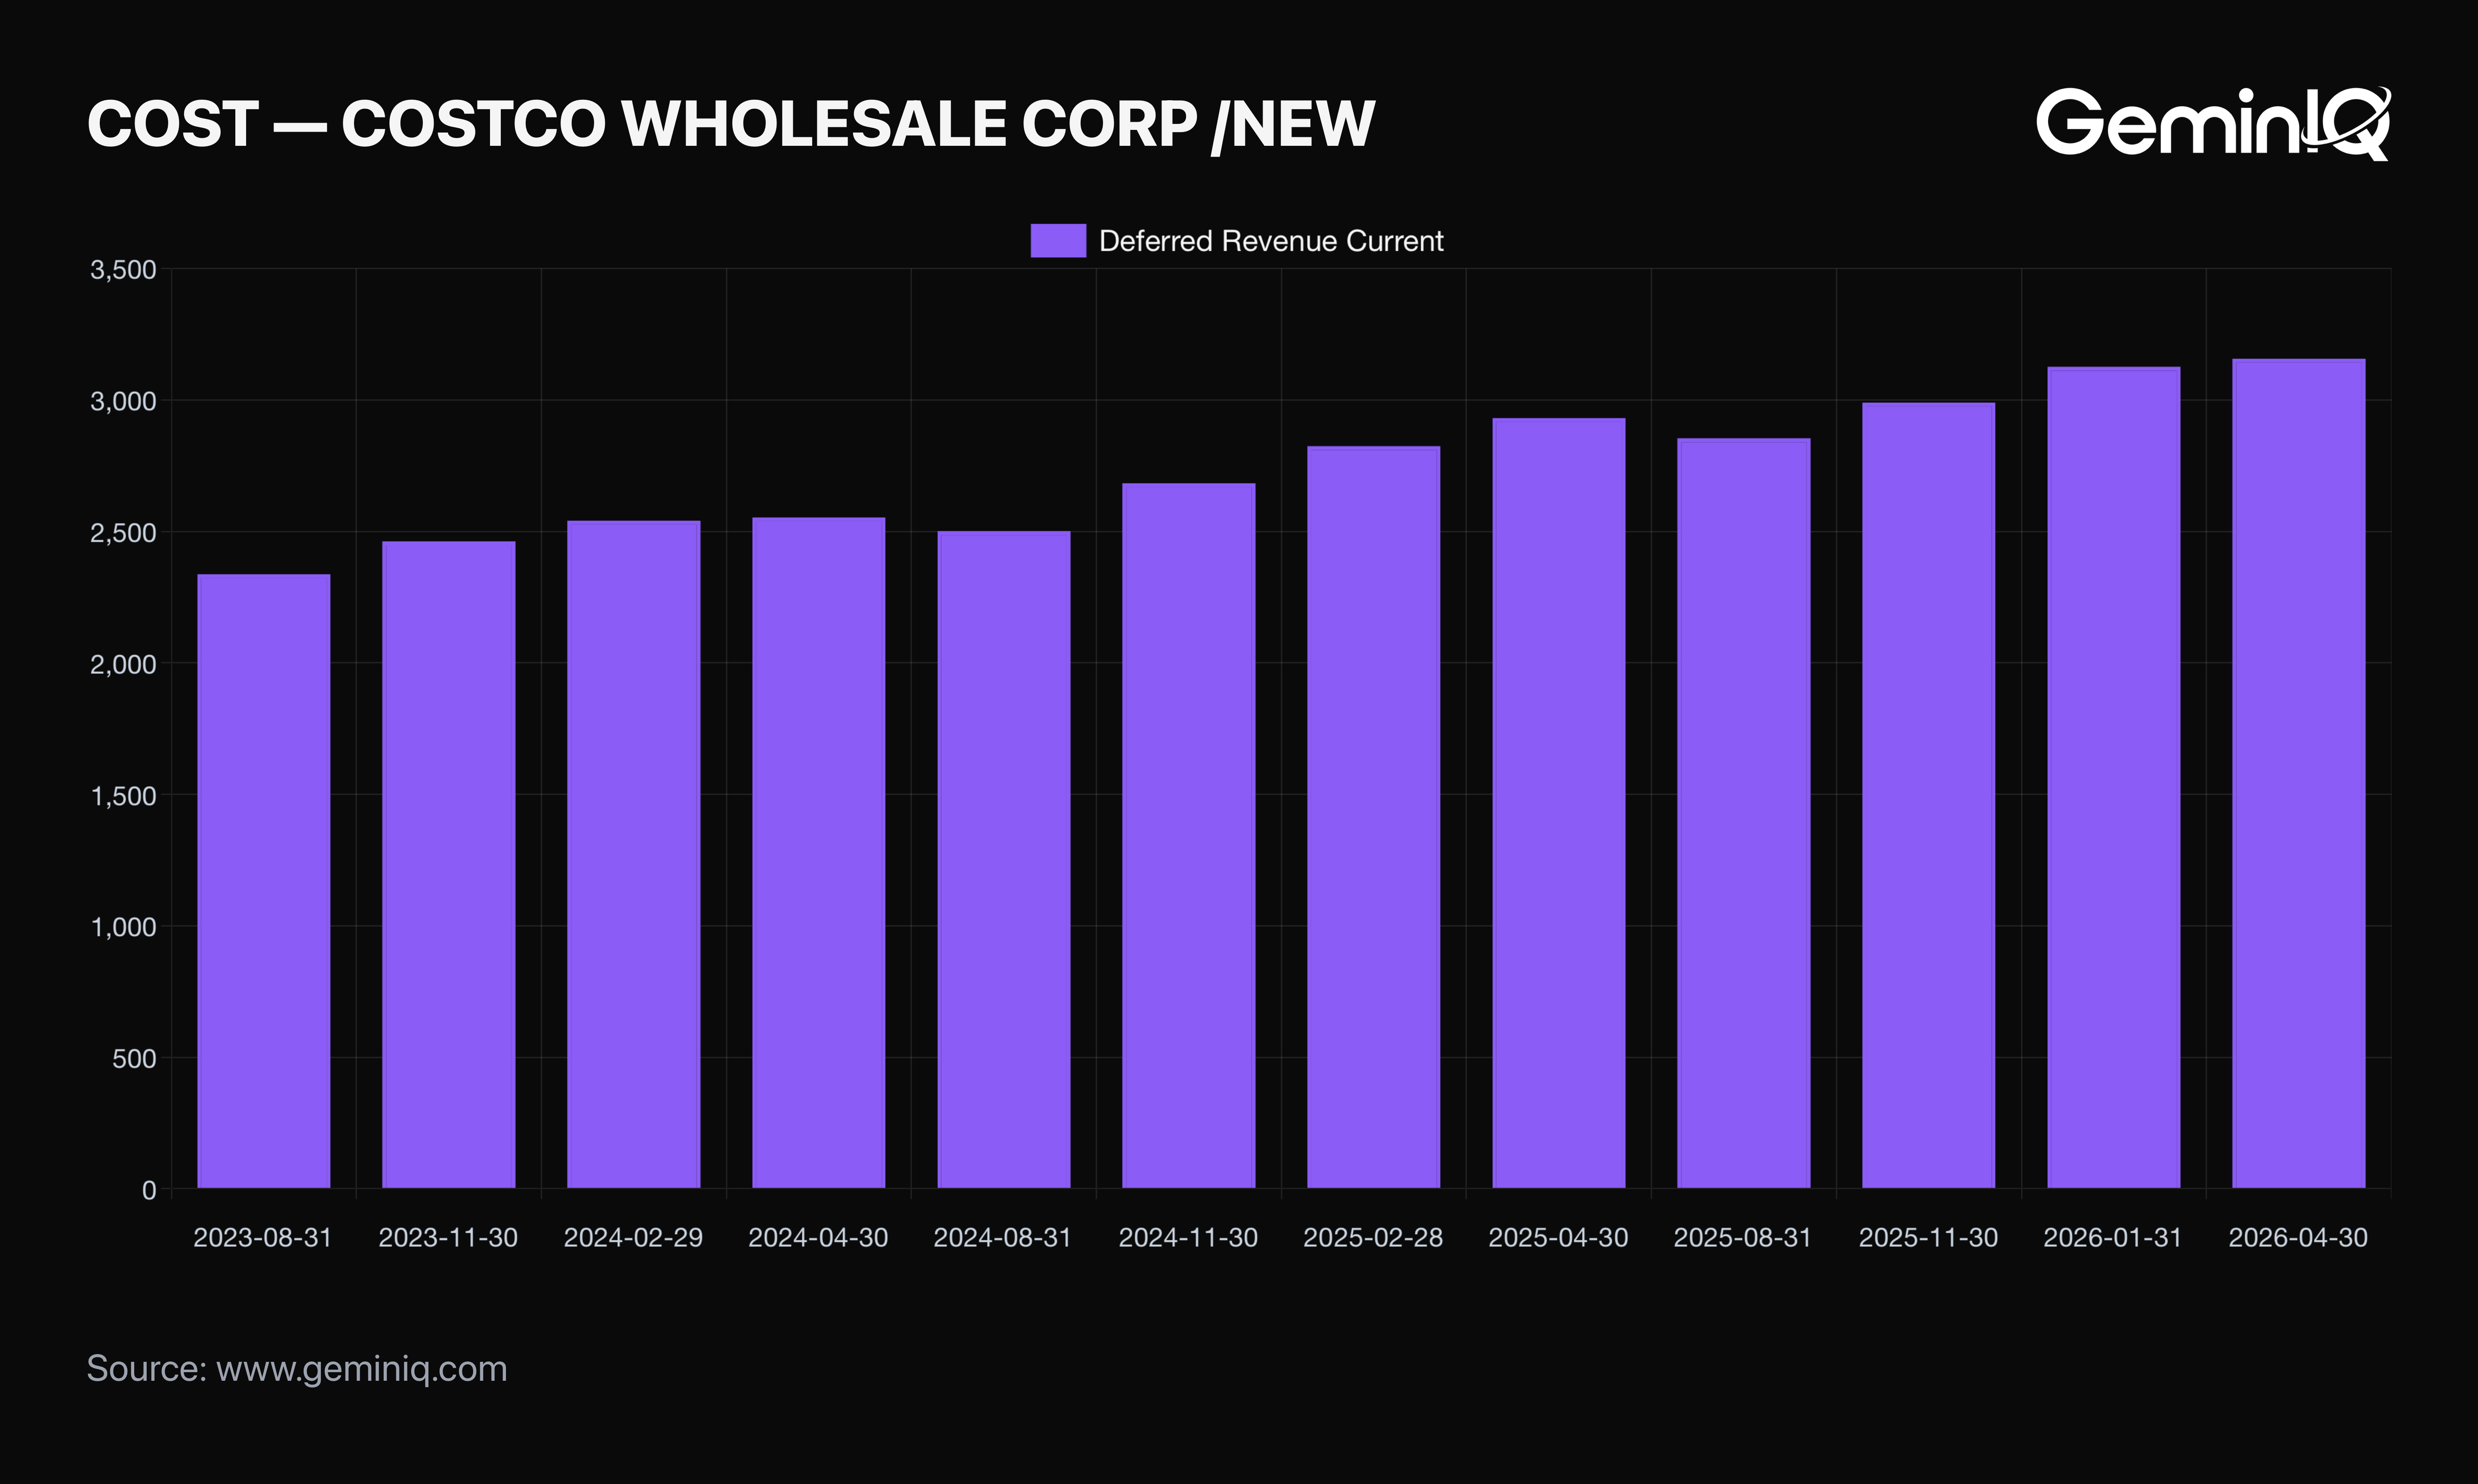
Scroll to the liabilities section of the 10-Q and there's a line most retail investors skip past: Deferred Membership Fees. This is the annual membership payment members have already paid, in cash, upfront, that Costco hasn't yet recognized as revenue. In accounting terms, it's a liability. In economic terms, it's free capital.
The Data: Deferred Membership Fees have grown from $2.337 Billion in August 2023 to $3.157 Billion in the current filing — up 35% in under three years. The only interruptions come in the fiscal fourth quarter each year, when the renewal cycle resets — $2.501 Billion in August 2024 and $2.854 Billion in August 2025 both dipped below the prior quarter before resuming.
The GeminIQ Edge: Most financial sites never surface deferred membership fees as a distinct line. Auditing the raw Balance Sheet quarter over quarter via GeminIQ's Financial Statements shows the float compounding in real time. It's the same mechanism Buffett describes when he praises insurance float — members are Costco's policyholders, and they keep sending bigger checks.
The Cash Machine
The float doesn't just sit on the balance sheet. It shows up in how completely accounting profit turns into actual cash.
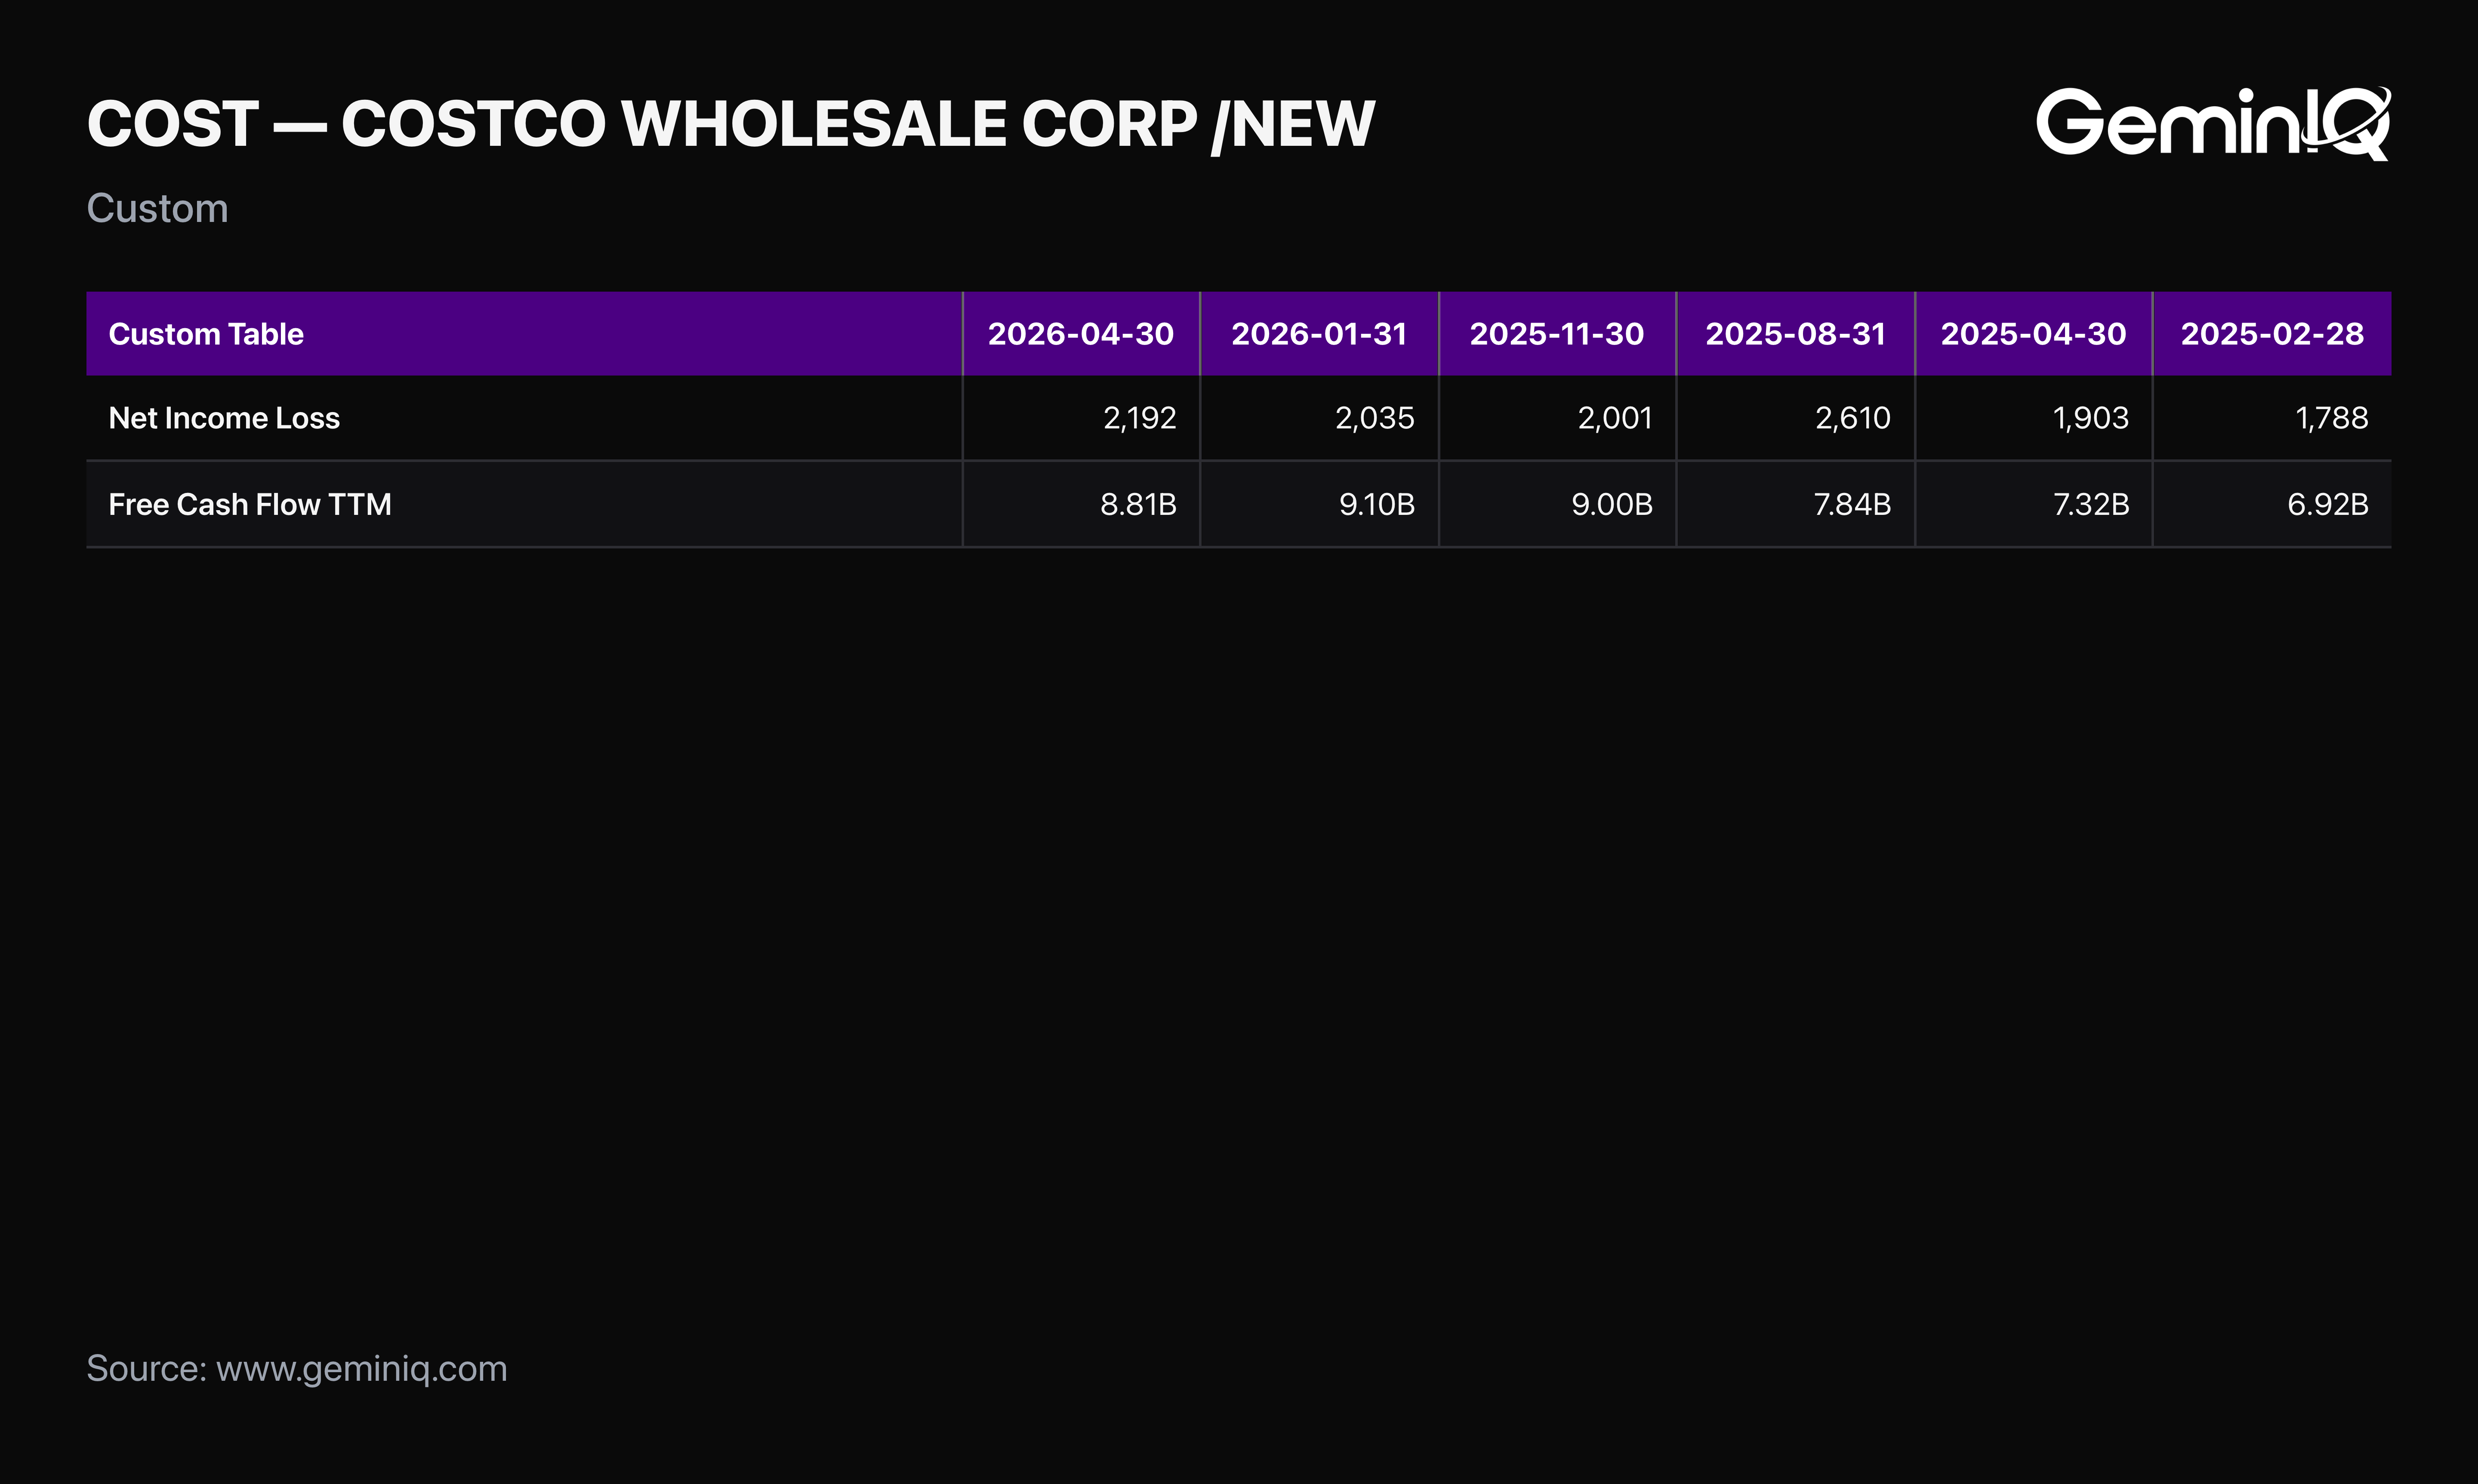
The Data: Costco converts TTM net income of $8.838 Billion into $8.806 Billion of Free Cash Flow — a 99.6% conversion rate.
The GeminIQ Edge: Retailers typically convert 60-70% of net income to free cash flow, because CapEx and inventory builds eat the difference. Pulling Operating Cash Flow against CapEx via GeminIQ's Financial Statements shows Costco clearing a full dollar of cash for every dollar of accounting profit — while still funding warehouse expansion out of the same line. The float and the payables terms cover what CapEx would otherwise take out.
Smart Money Diverging
A good teardown doesn't skip the reality check. What are the people running Costco, and the institutions that own it, actually doing with their money?
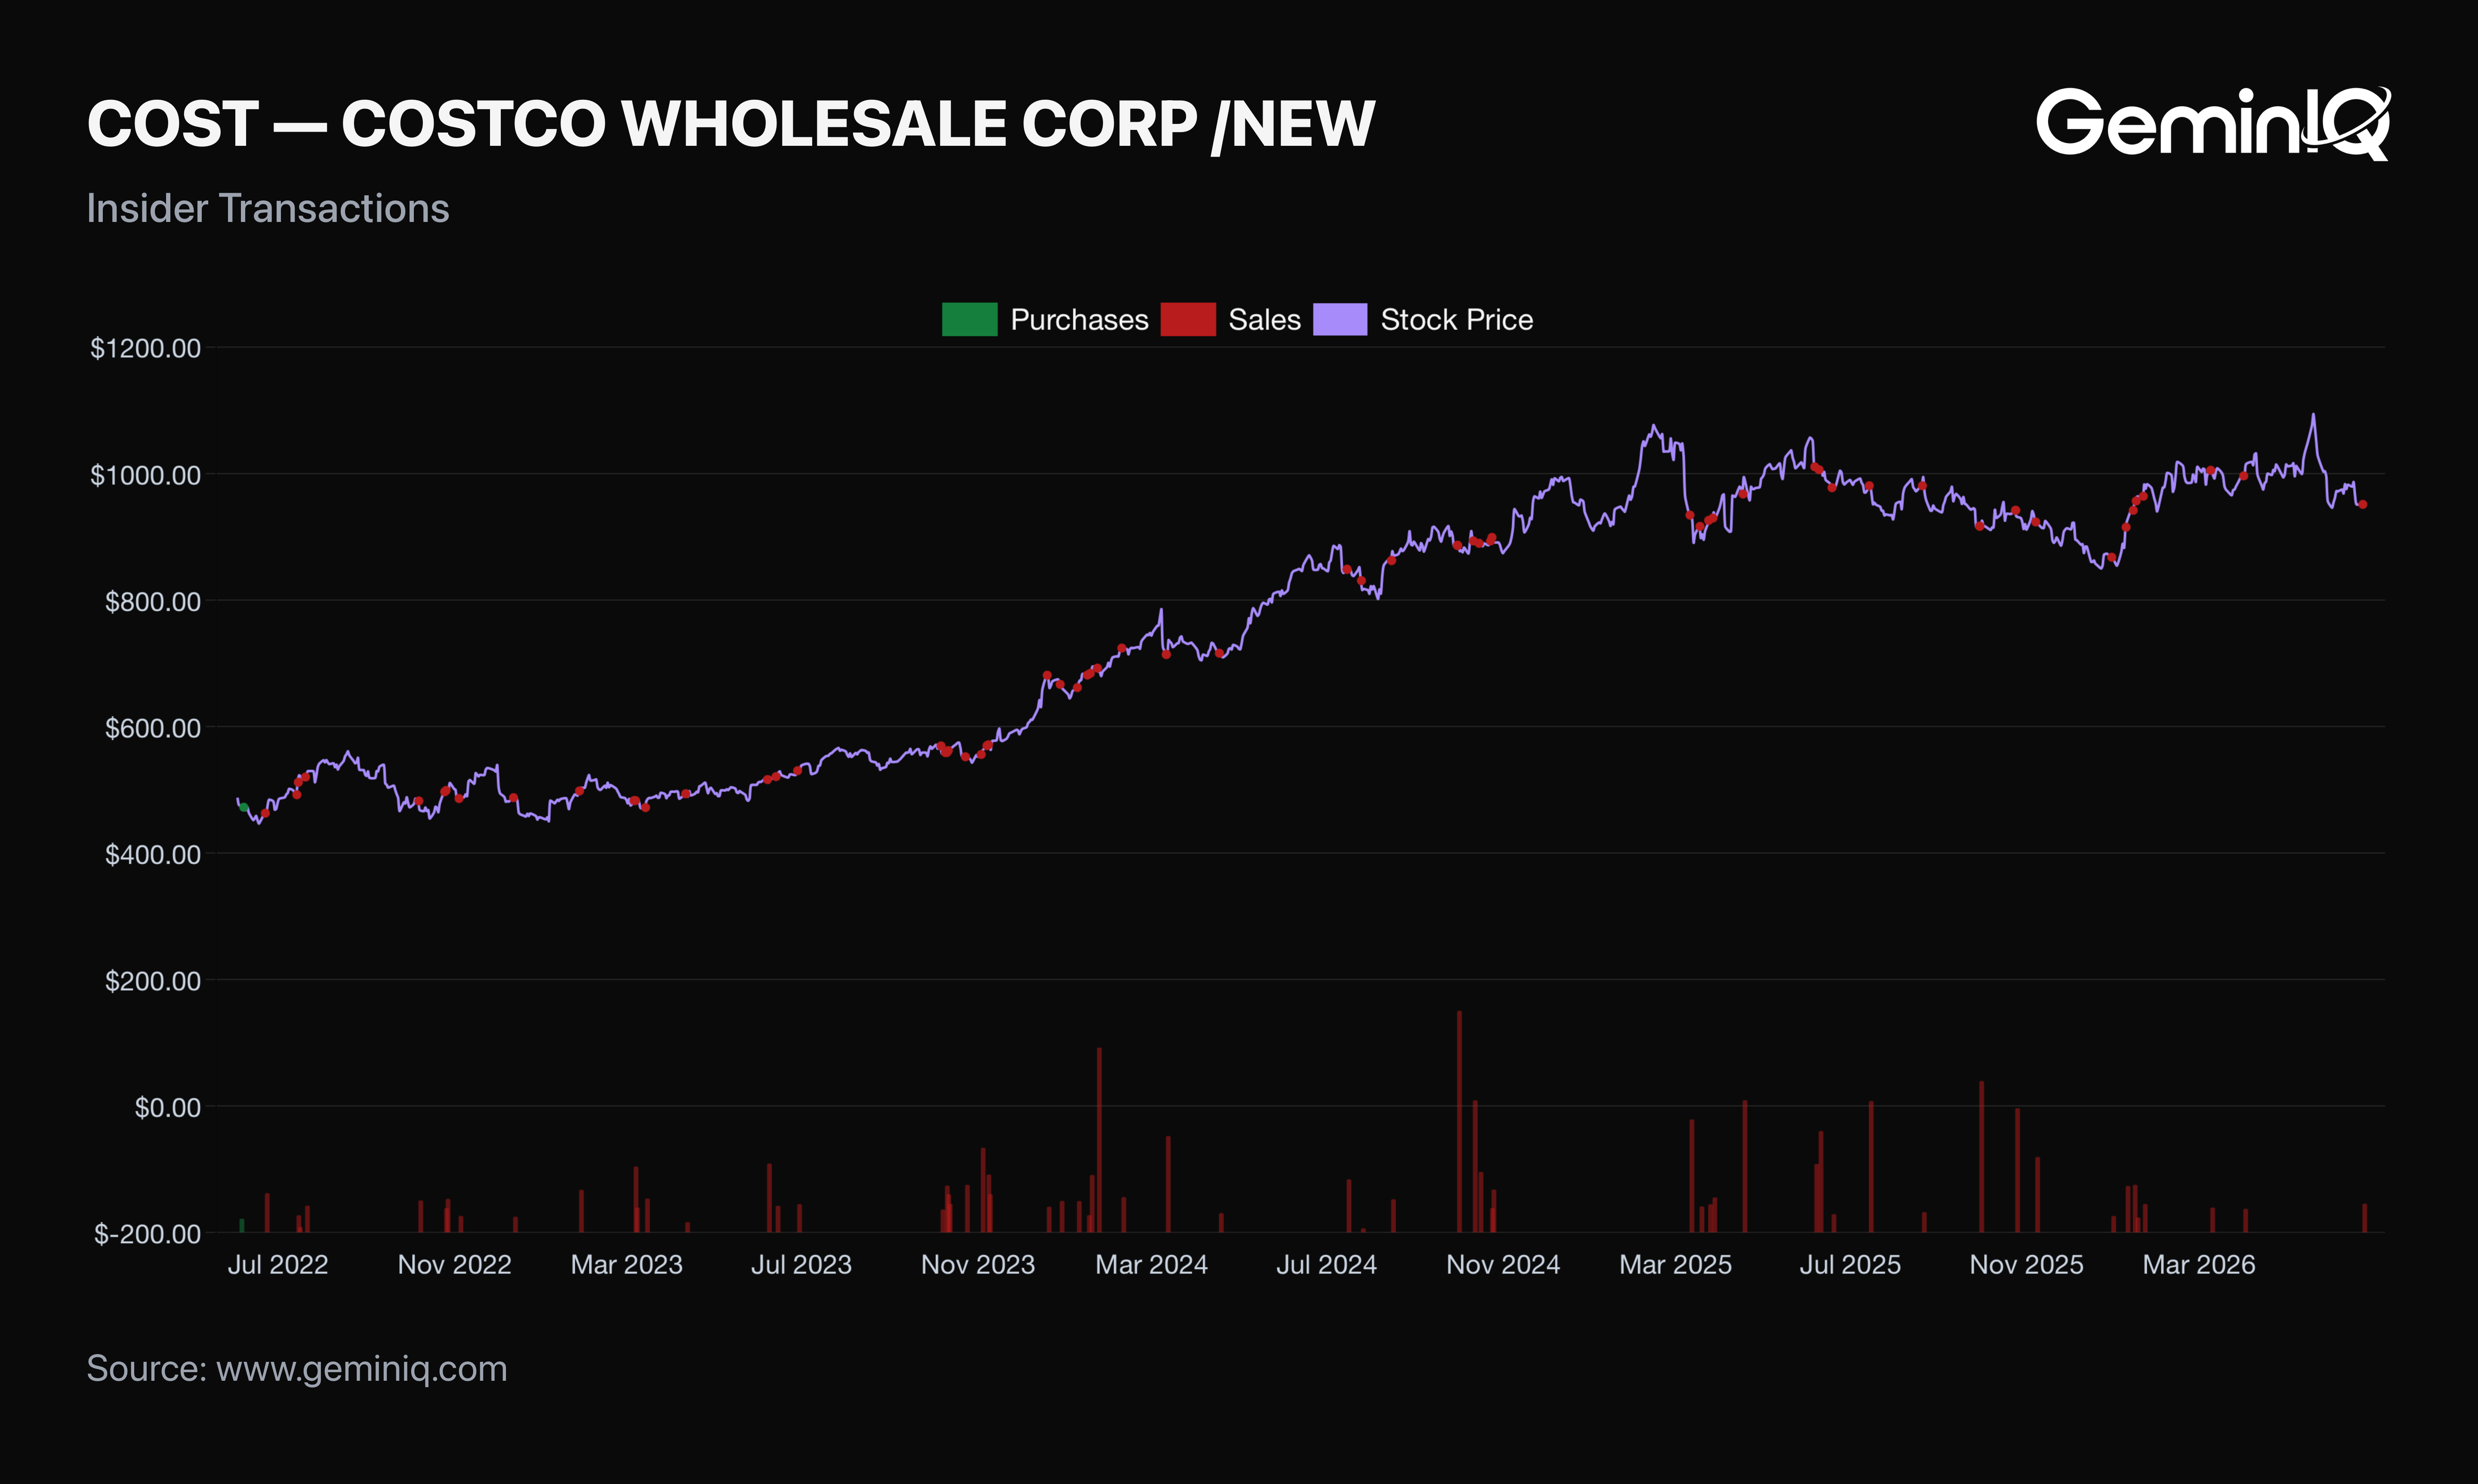
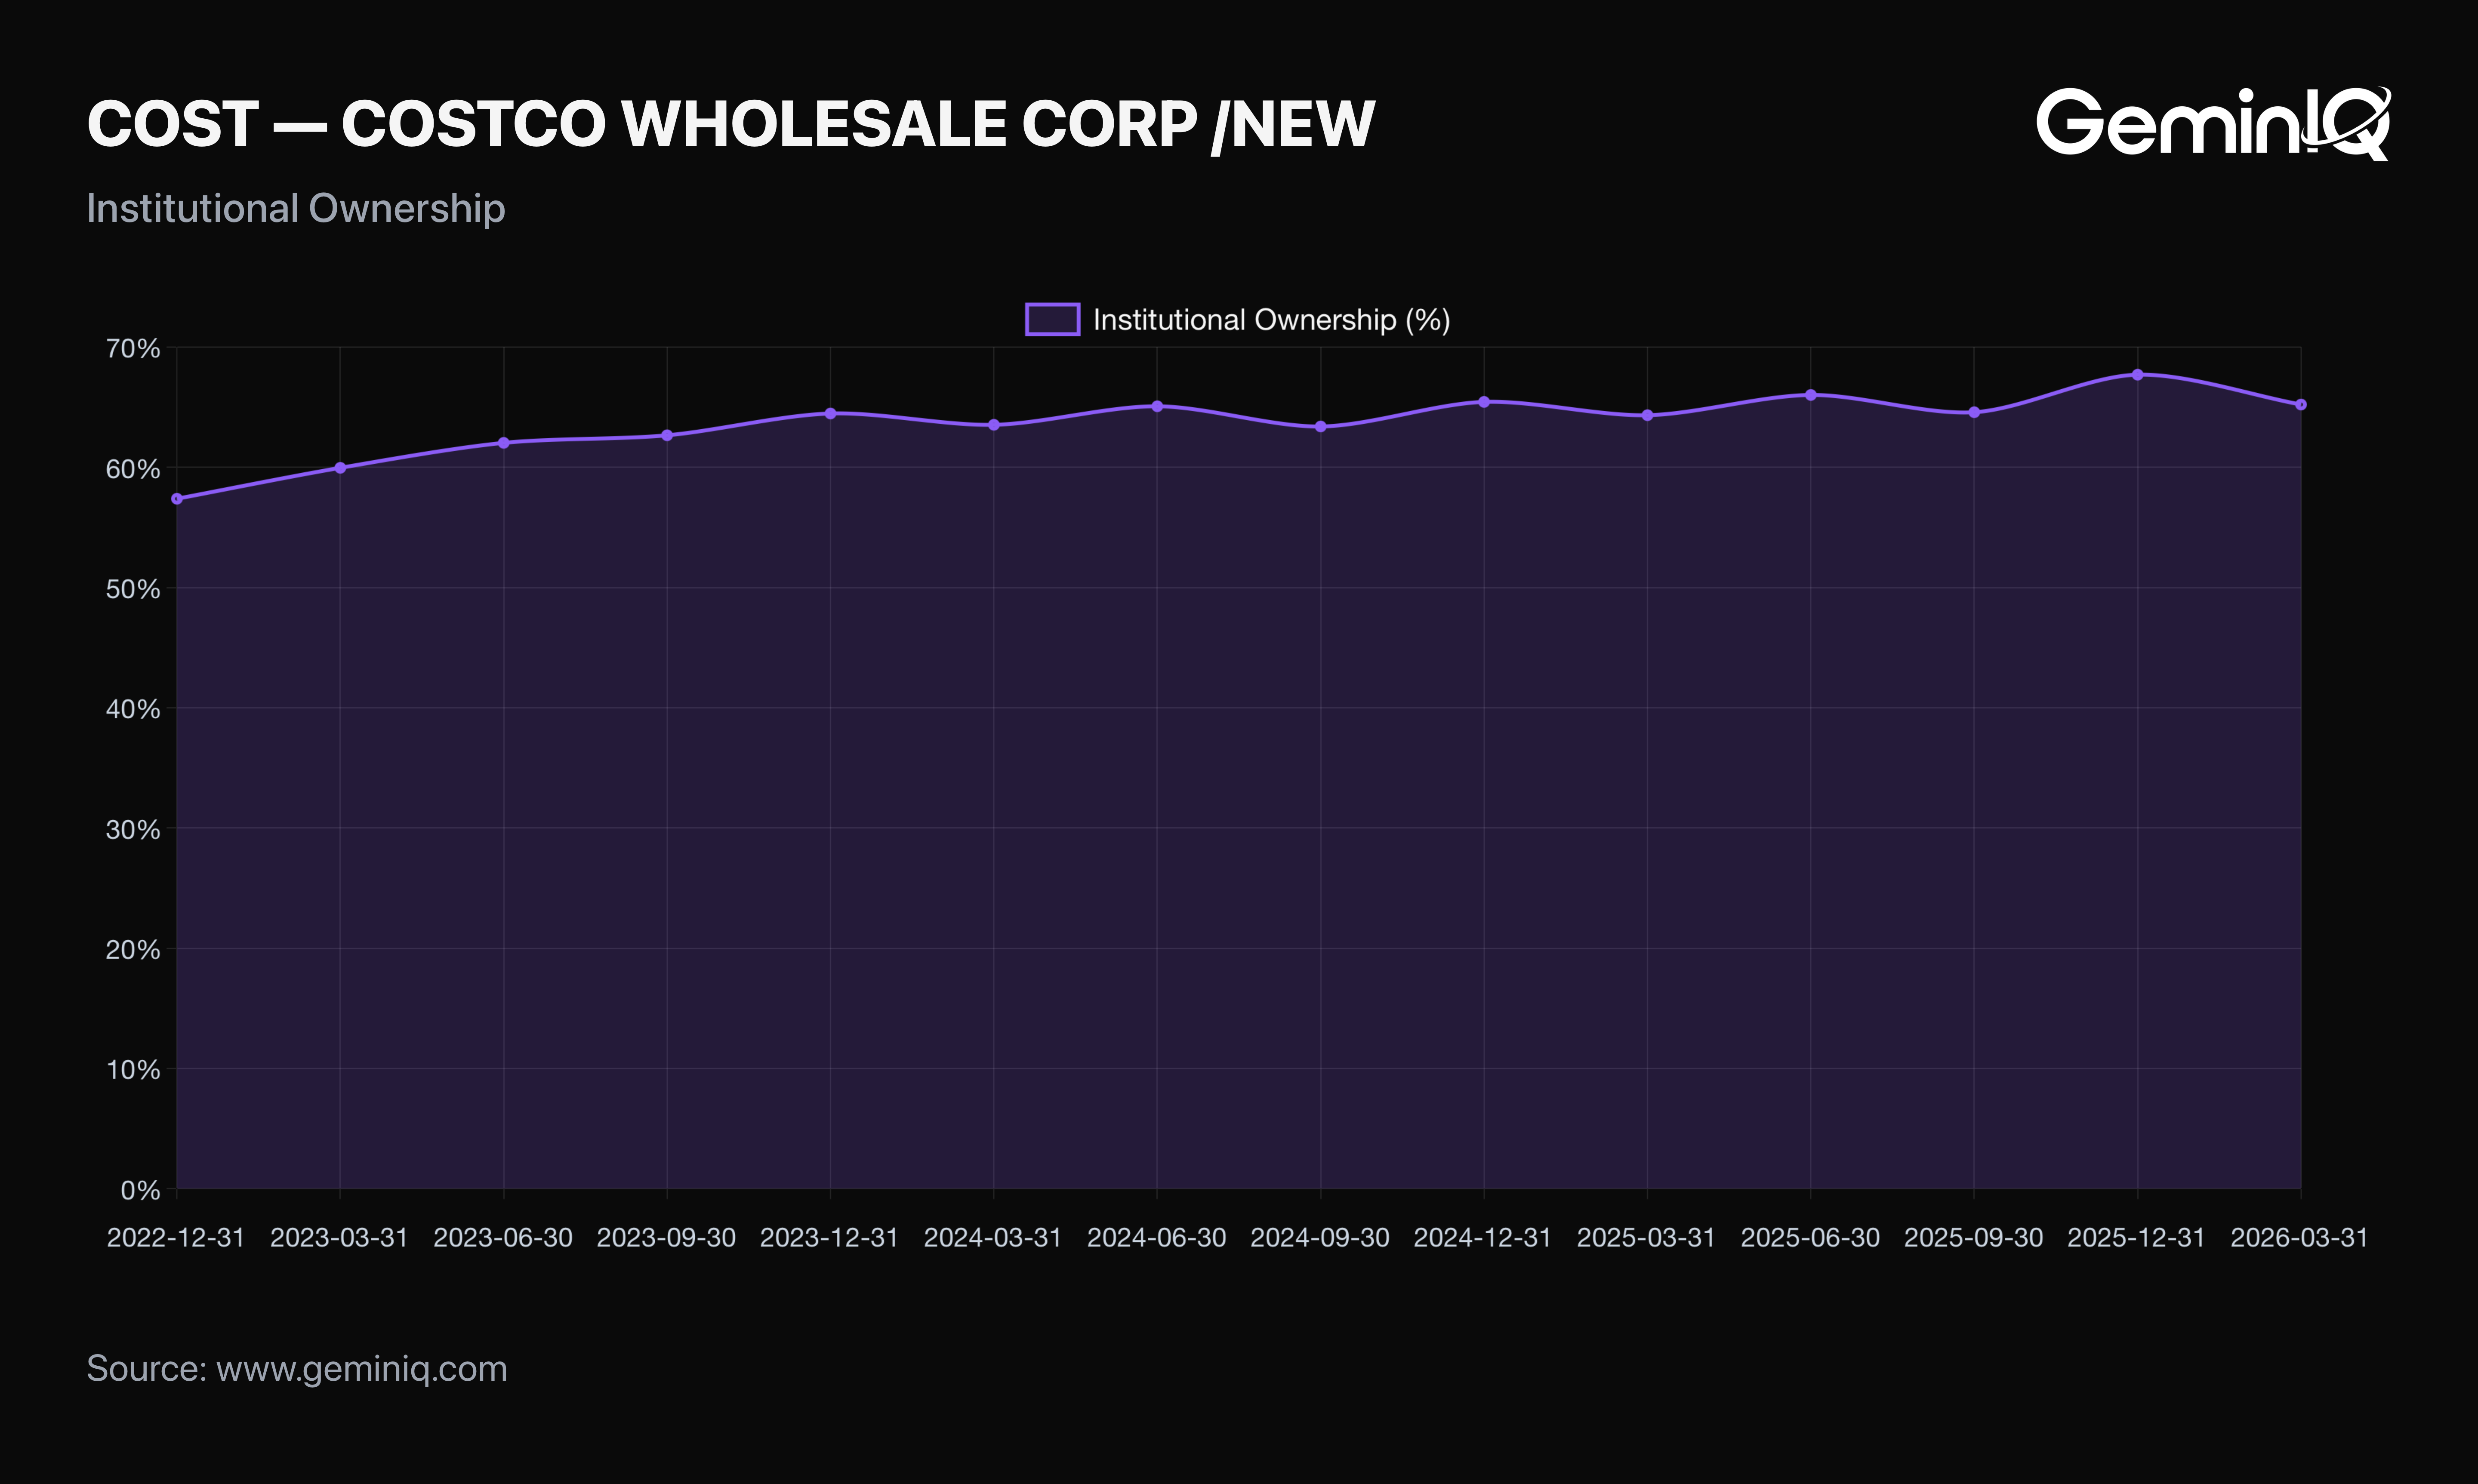
The Data: GeminIQ's Insider Transactions feed shows an unbroken stream of executive sales, zero open-market purchases since June 2022. Meanwhile Institutional Ownership data shows a different pattern: institutions recovered from a 57.4% low in December 2022 to 65.2% as of the most recent 13F (March 2026), including a step back from a 67.7% high just three months earlier.
The GeminIQ Edge: These aren't contradictory signals, they're two different time horizons. Insiders selling into RSU vesting at a 50.8x multiple is standard behavior for a mature mega-cap, not a distress signal. Institutional 13F data is quarterly and lagged up to 45 days, so the March reading is already old news by the time it's filed, but the multi-year recovery off the 2022 low is the more durable pattern worth tracking. Neither the selling nor the buying settles the valuation debate on its own. Both are visible only because the raw feeds are traceable.
Frequently Asked Questions
What does GeminIQ's data show about Costco's corrected ROIC?
A verification against Costco's filed tax provision put the real trailing effective rate at 24.8%. Applying it to TTM EBIT of $11.23 Billion gives NOPAT of $8.44 Billion, which over Average Invested Capital of $25.24 Billion produces a Return on Invested Capital of 33.4% — roughly 9 percentage points below a previously cited 42.68% figure. The tax rate accounts for under two points of that gap; the rest sat in the invested-capital base.
Is 33.4% ROIC unusual for a retailer with a 3.8% margin?
Yes. Most retailers earning a low single-digit operating margin post ROIC in the high single digits to low teens. Costco's membership-funded float and negative working capital structure let it earn a multiple of that on a wafer-thin margin.
When did Costco last file its 10-Q, and what period does it cover?
Costco's most recent filing is a Form 10-Q filed June 3, 2026, covering the fiscal quarter ended May 10, 2026 (Q3 FY2026).
Where can I verify Costco's deferred membership fees figure against the original filing?
The figure is drawn directly from Costco's Q3 FY2026 10-Q balance sheet, filed with the SEC on June 3, 2026. The full filing is publicly available on SEC EDGAR (linked in the citation block below).
Wall Street's data. Main Street's price.
Institutional terminals charge thousands a year for as-filed accuracy. GeminIQ gives you the same thing for a fraction of the cost: financials built directly from raw SEC EDGAR filings, not third-party APIs, with full XBRL traceability back to the original 10-K or 10-Q. No normalized guesswork, just calculated metrics, charts, screeners, and watchlists built on numbers exactly as the company reported them. Start researching now at GeminIQ.com.
All financial figures cited in this article reference Costco Wholesale Corporation's Q3 FY2026 10-Q (filed June 3, 2026, period ending May 10, 2026). All SEC filings are publicly available at SEC EDGAR.
Disclaimer: The content in this blog is for educational and entertainment purposes only and does not constitute financial, legal, or tax advice. Investing involves risk, including the loss of principal. The views expressed are my own and not intended as financial advice or a guarantee of future performance.