
Dividend Cuts: Payout Ratios Topped 66% First

By Chad Hartman
Published · Last updated
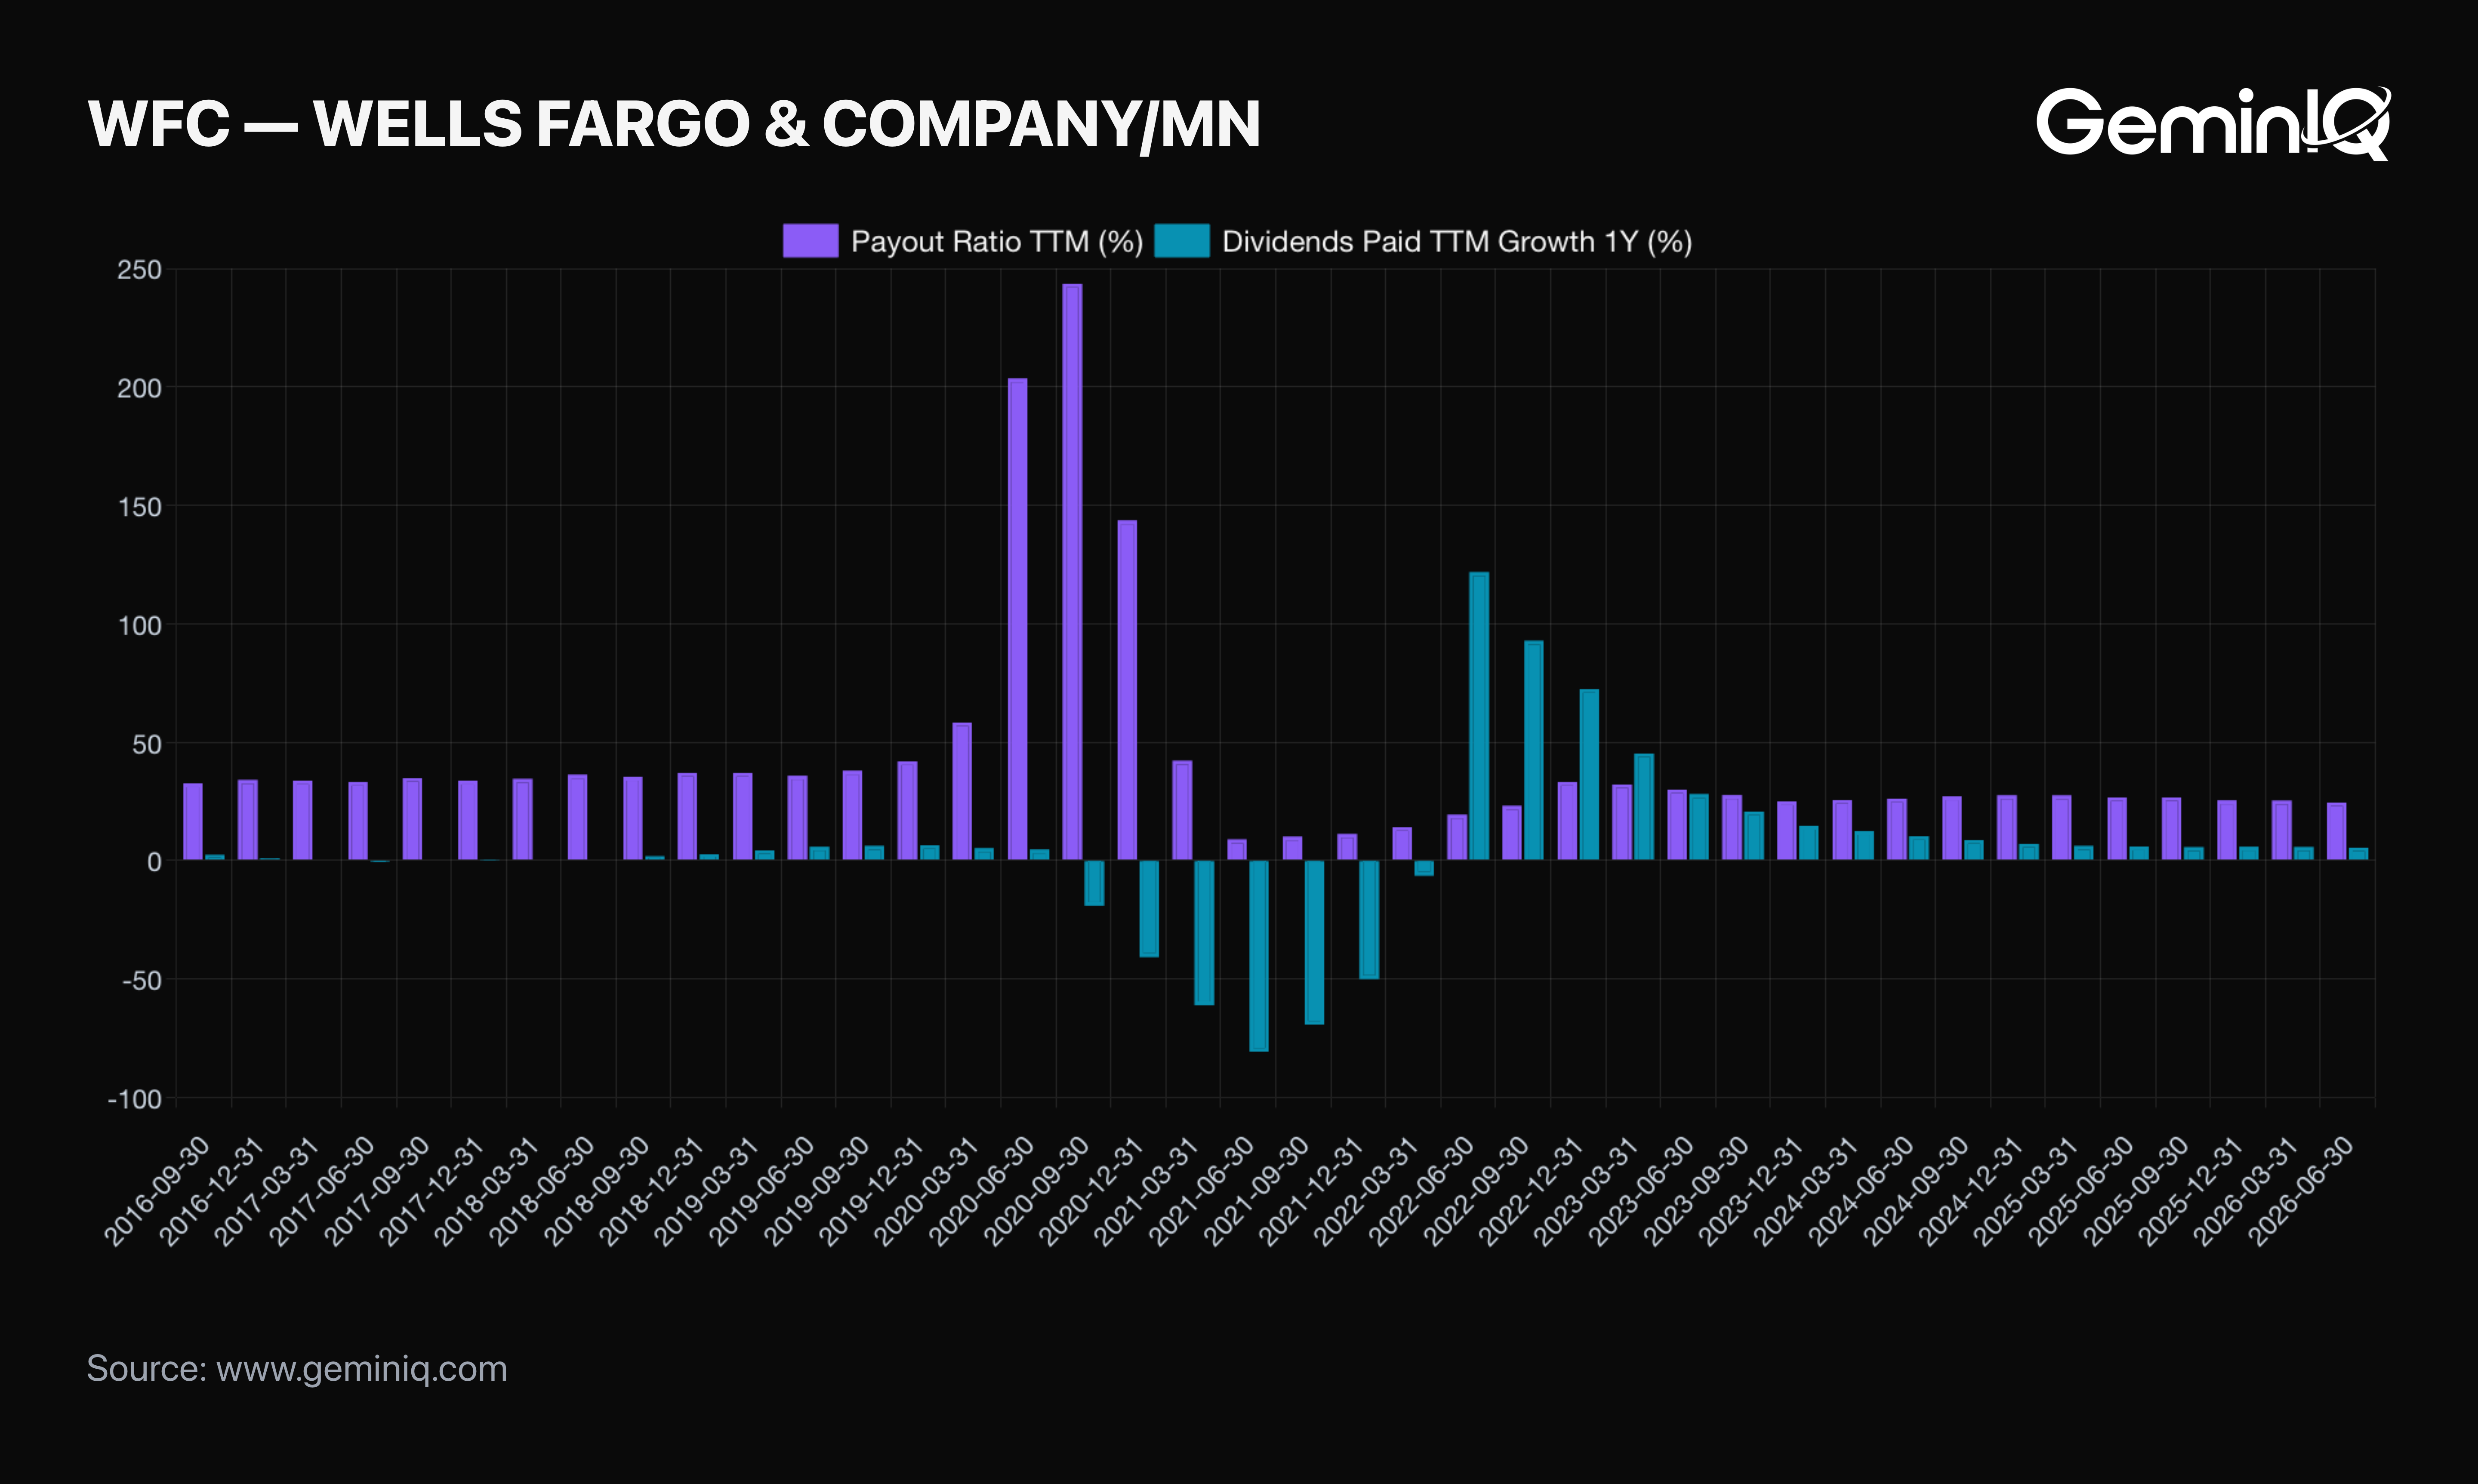
Wells Fargo was paying out 243.6% of trailing net income in dividends a year before its trailing-twelve-month dividend payments fell 69.4%. A payout ratio above 100% means a company is distributing more cash than it earned over the same period — a fact filed openly, quarter after quarter, well before any dividend-cut announcement makes headlines. Across GeminIQ's full filing universe, that pattern isn't limited to one bank in one stressed year.
This study reads GeminIQ's as-filed universe of quarterly and annual filings, identifying a dividend cut as a trailing-twelve-month Dividends Paid figure falling 20% or more year over year at a company that paid at least $5 Million in dividends the year before. 87,218 filing-periods meet the base criteria for comparison, of which 12,858 are flagged as dividend cuts. For each, this study looks at the payout ratio, dividend coverage, and leverage as they stood one year before the cut, compared to companies that kept paying — a historical association measured over the sample window, not a forecast for any individual company.
The Pattern
A dividend cut is rarely a surprise in the arithmetic, even when it's a surprise in the headline. The dividend itself is a cash outflow a board can choose to reduce at any point. The pressure that leads to that choice — earnings no longer comfortably covering the payment, cash flow tightening, or both — tends to show up in the filings well before the board acts on it. Whether that pressure is actually visible ahead of time, across thousands of cuts rather than one company's story, is what this comparison tests directly.
The Data
| Metric (measured one year before) | Dividend-Cut Cohort (median) | No-Cut Cohort (median) |
|---|---|---|
| Payout Ratio | 66.3% | 38.2% |
| Dividends Paid / Free Cash Flow | 33.2% | 27.8% |
| Net Debt / EBITDA | 0.70x | 0.96x |
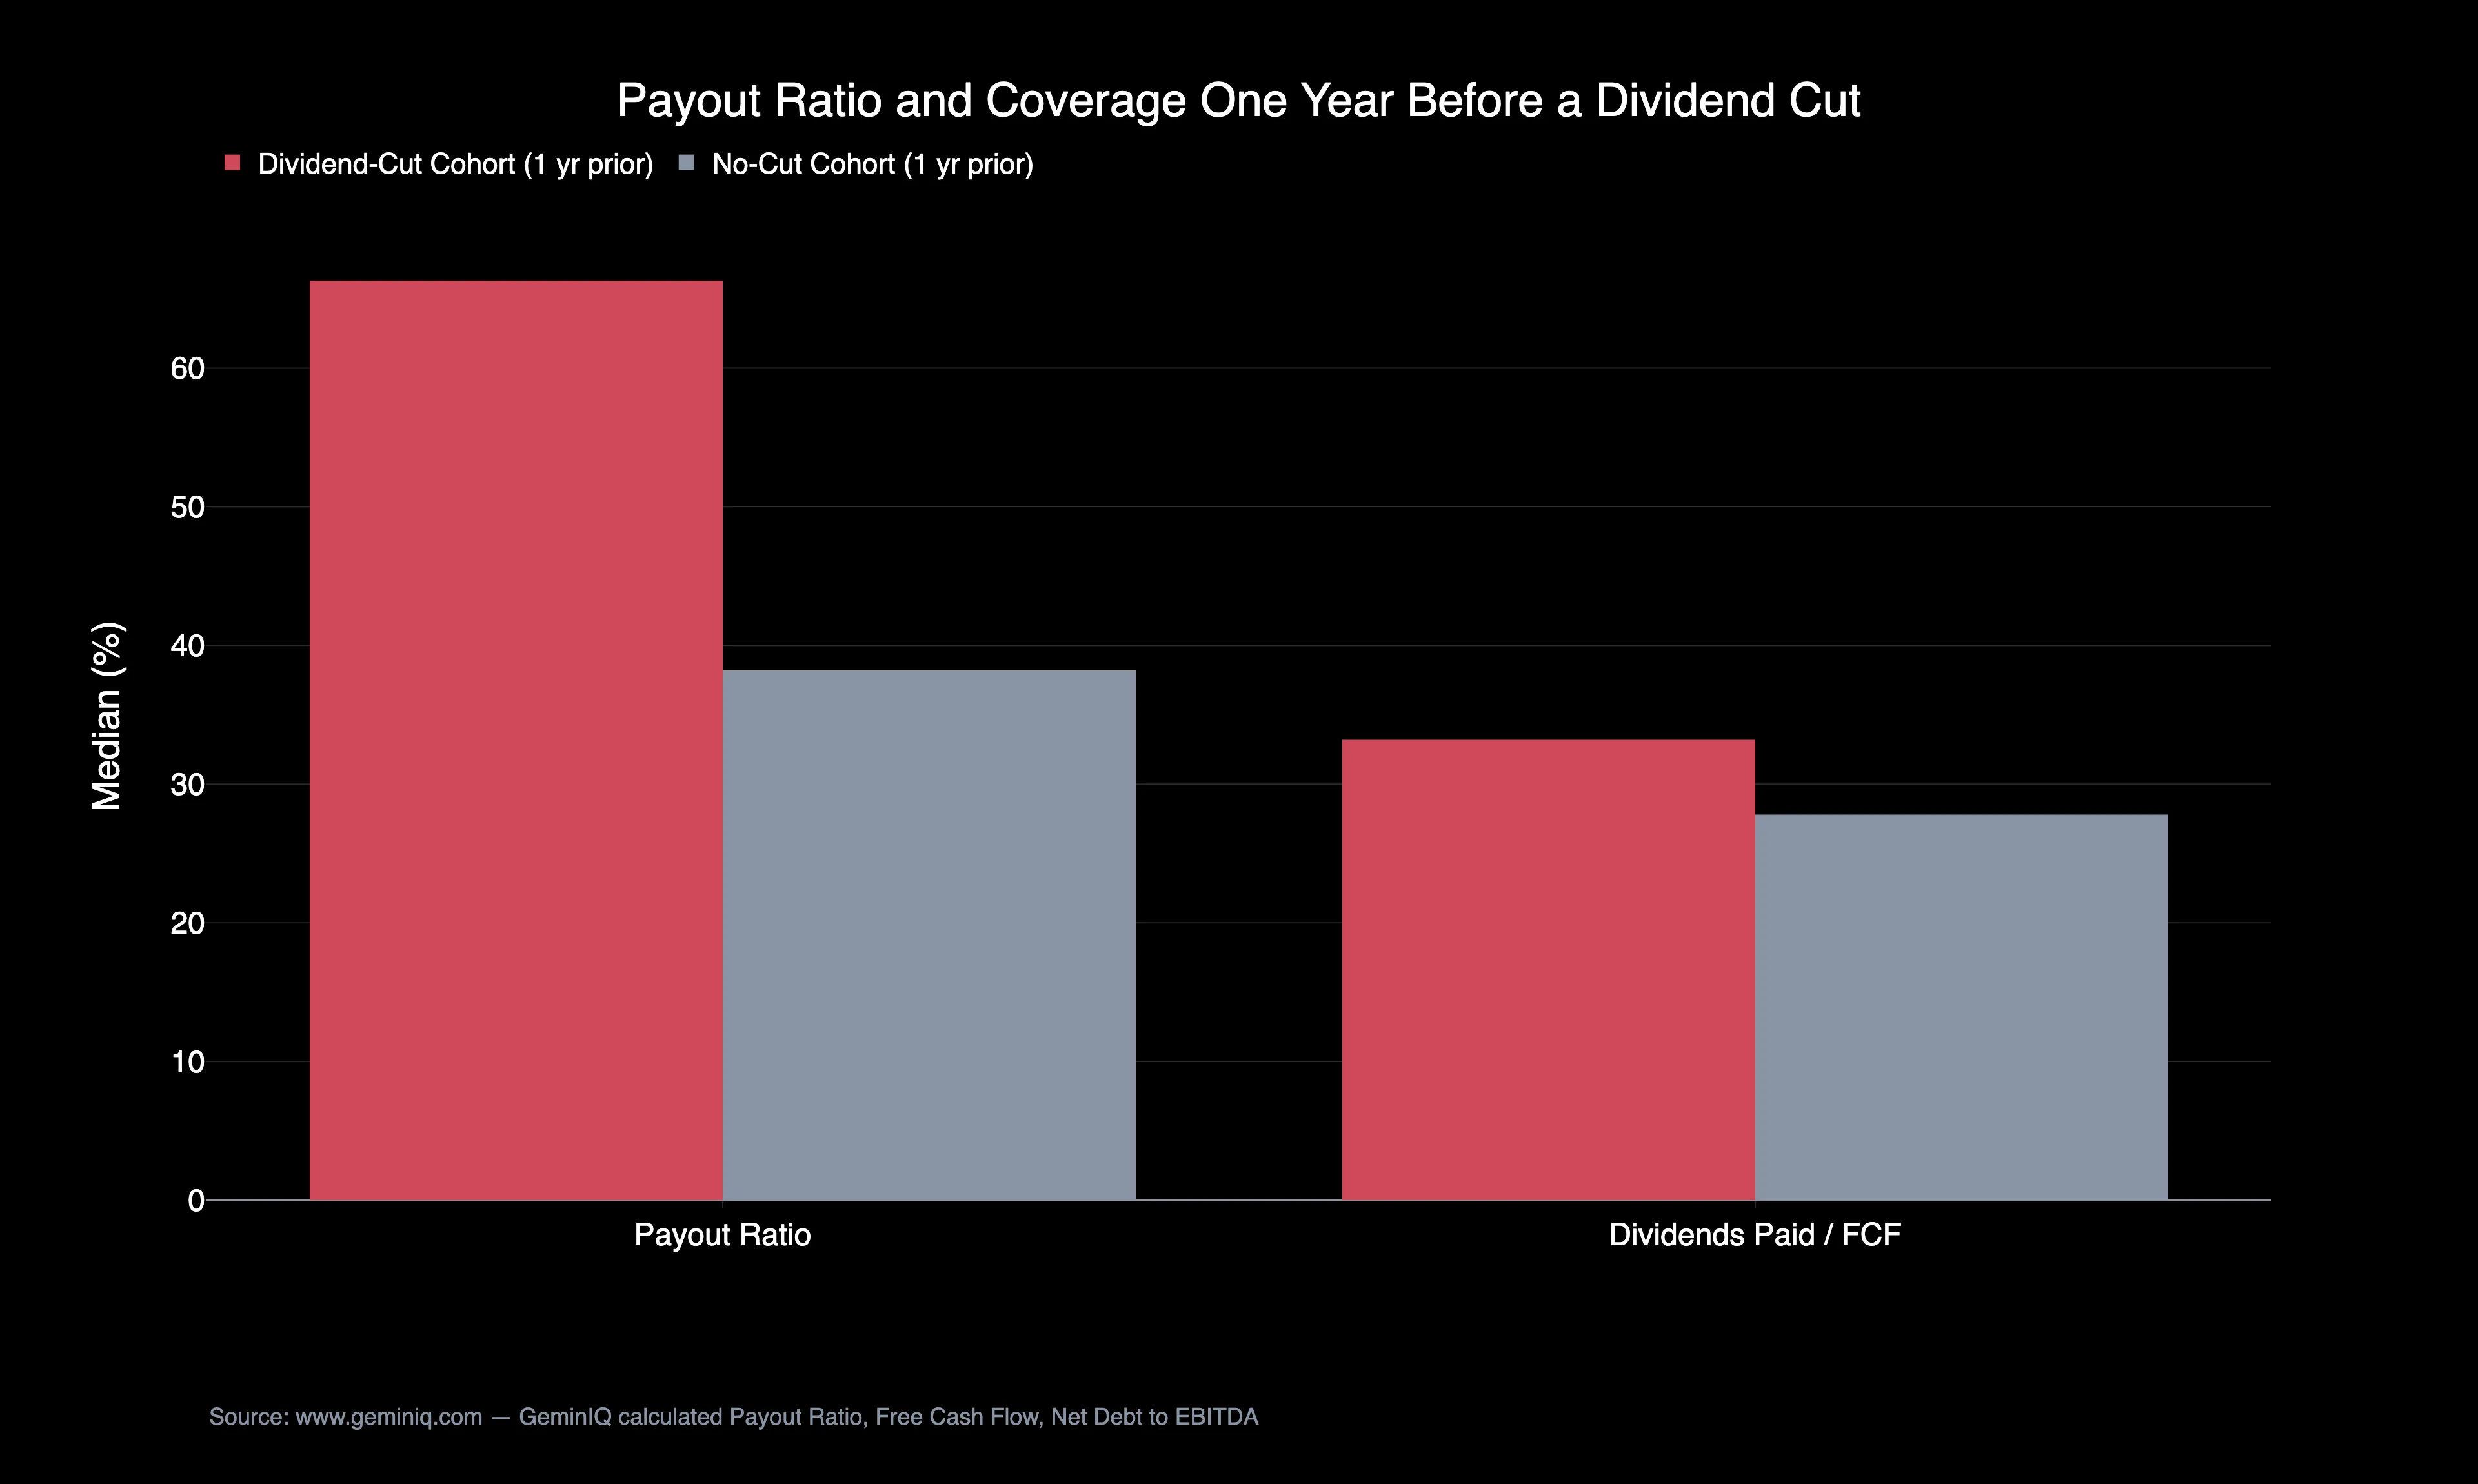
Payout ratio carries the clearest signal: a year before a cut, the median company in the cut cohort was already paying out 66.3% of net income in dividends, against 38.2% for companies that kept paying — a gap of nearly 28 percentage points, visible in the filings a full year ahead of the cut itself. The dividend-to-free-cash-flow coverage ratio shows a smaller gap in the same direction. Leverage runs the other way: companies that went on to cut actually carried lower net debt to EBITDA a year earlier than companies that didn't. That argues against leverage itself being the leading indicator here — the pressure shows up first in earnings coverage of the dividend, not in the balance sheet's debt load.
The Extremes
Wells Fargo, cited in the opening, cut its dividend during a widely covered period of bank-sector stress, with the elevated payout ratio visible in its own filings well before the cut was announced.
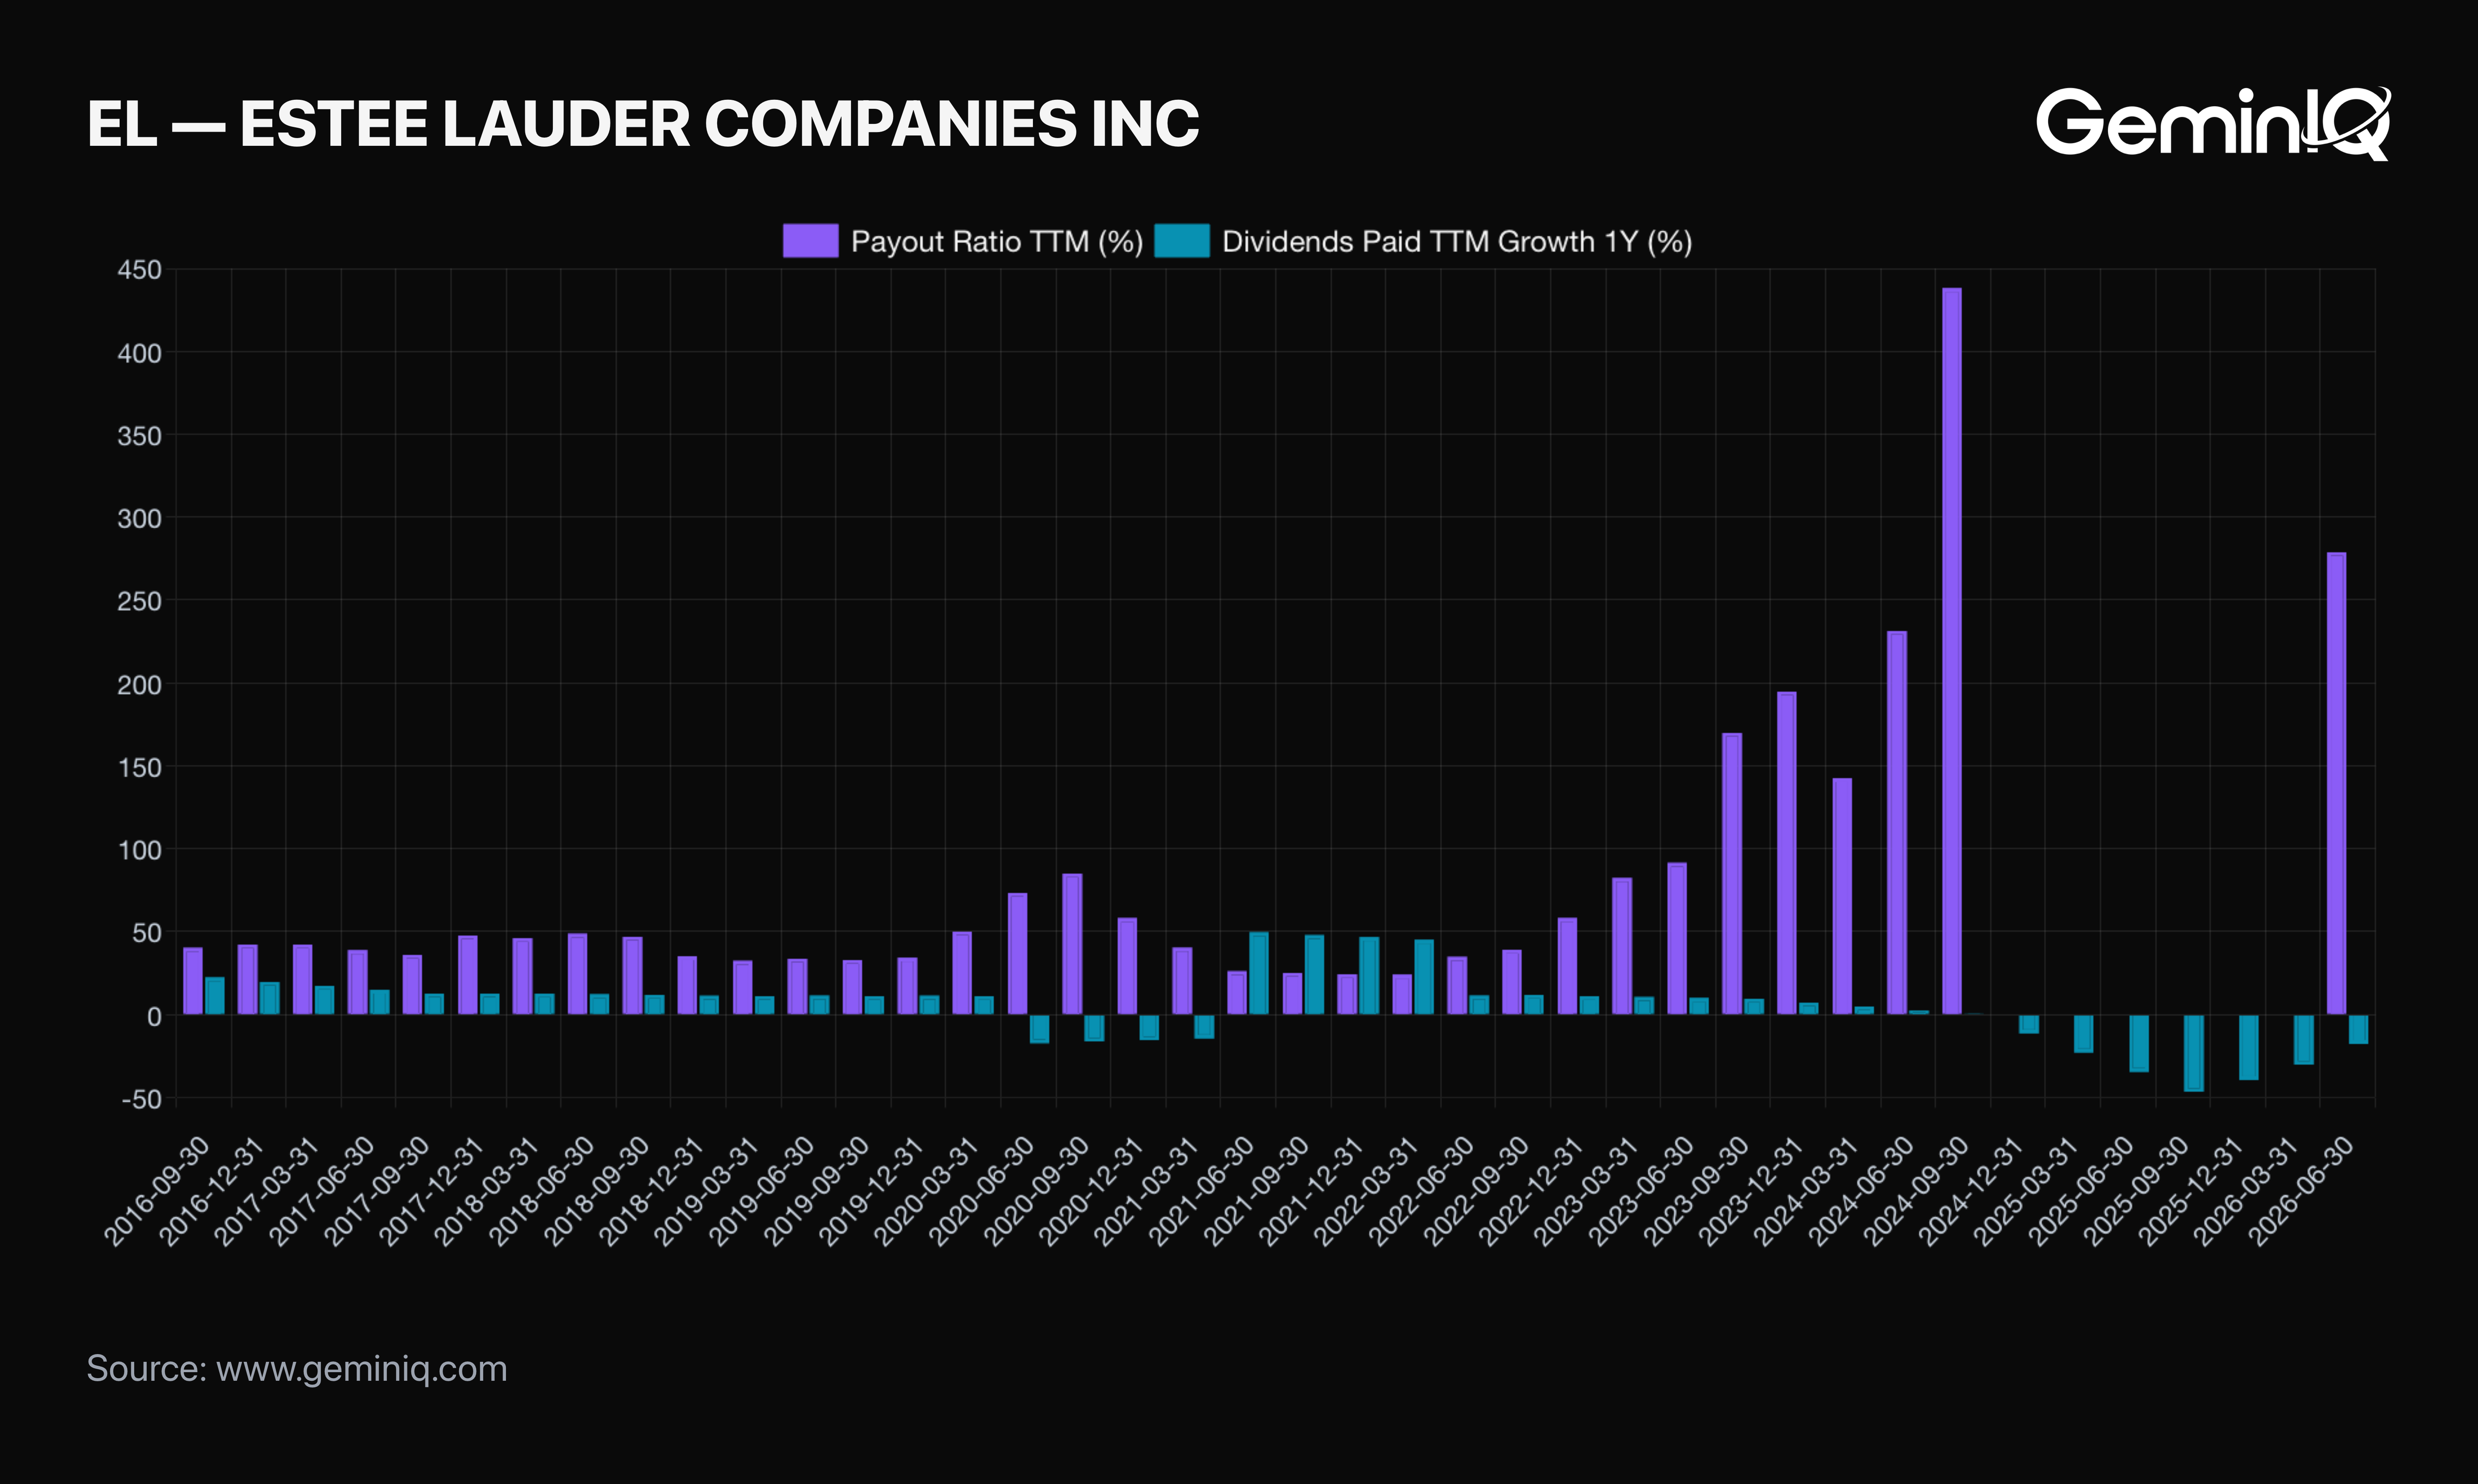
Estée Lauder shows the same shape outside banking: a payout ratio of 231.5% in the period a year before its trailing dividend fell 34.7%, against a backdrop of a prolonged, publicly reported slowdown in its China and global travel-retail business. Both companies were already paying out more than their full net income in dividends before either cut became a headline.
The Method
Dividends Paid, Payout Ratio, Free Cash Flow, and Net Debt to EBITDA are all GeminIQ calculated figures, built directly from as-filed cash flow statement and income statement data. A dividend cut is flagged when trailing-twelve-month Dividends Paid falls 20% or more year over year at a company that paid at least $5 Million in dividends the year before. Each cut is matched to the same company's own filing from approximately one year earlier. Every ratio is winsorized at the top and bottom 1% before comparison to exclude divide-by-near-zero and single-quarter earnings-swing artifacts. Full methodology is covered in How GeminIQ Builds Filing Data Studies; GeminIQ's Dividend Growth Screener covers the same payout-ratio and coverage principles from the opposite direction, screening for dividends more likely to keep growing.
Check Your Holdings
Pull up any dividend-paying position's Payout Ratio and Free Cash Flow on GeminIQ's Calculated Metrics view and check whether the payout ratio sits meaningfully above the roughly 40% median this study found for companies that kept paying. A payout ratio climbing toward or past 100% is a filing-level fact anyone can check directly, well before a dividend cut becomes a headline. It's a method for spotting the pressure, not a guarantee of what a board will decide to do about it.
Frequently Asked Questions
What payout ratio typically precedes a dividend cut?
In GeminIQ's data, companies that went on to cut their trailing-twelve-month dividend by 20% or more had a median payout ratio of 66.3% one year earlier, against 38.2% for companies that maintained or grew their dividend — a gap present a full year before the cut.
How many dividend cuts does this study cover?
12,858 filing-periods are flagged as a dividend cut — a 20%-or-greater year-over-year decline in trailing-twelve-month Dividends Paid at a company that paid at least $5 Million the year before — against a comparison base of 87,218 filing-periods total.
Is high leverage a better warning sign than payout ratio?
No, not in this data. Companies that went on to cut their dividend actually carried lower net debt to EBITDA a year earlier (a median of 0.70x) than companies that kept paying (0.96x). The clearer warning sign in this study is an elevated payout ratio, not balance-sheet leverage.
Is a payout ratio above 100% always followed by a dividend cut?
No. This study measures what payout ratios looked like before cuts that did happen, not the reverse — not every company with an elevated payout ratio goes on to cut its dividend, and some sustain a high payout ratio for extended periods without one.
Wall Street's data. Main Street's price.
Institutional terminals charge thousands a year for as-filed accuracy. GeminIQ gives you the same thing for a fraction of the cost: financials built directly from raw SEC EDGAR filings, not third-party APIs, with full XBRL traceability back to the original 10-K or 10-Q. No normalized guesswork, just calculated metrics, charts, screeners, and watchlists built on numbers exactly as the company reported them. Start researching now at GeminIQ.com.
Data Appendix: Universe drawn from GeminIQ's as-filed 10-K and 10-Q database, publicly available on SEC EDGAR. 87,218 filing-periods with a prior-year dividend payment of at least $5 Million were screened for a 20%-or-greater year-over-year decline in trailing-twelve-month Dividends Paid; 12,858 met that threshold. Payout Ratio, Dividends Paid, Free Cash Flow, and Net Debt to EBITDA are all GeminIQ calculated metrics, winsorized at the top and bottom 1% before comparison. Methodology: How GeminIQ Builds Filing Data Studies.
Disclaimer: The content in this blog is for educational and entertainment purposes only and does not constitute financial, legal, or tax advice. Investing involves risk, including the loss of principal. The views expressed are my own and not intended as financial advice or a guarantee of future performance.