
ExxonMobil Q1 2026 10-Q: The Real Gross Margin Revealed

By Chad Hartman
Published · Last updated
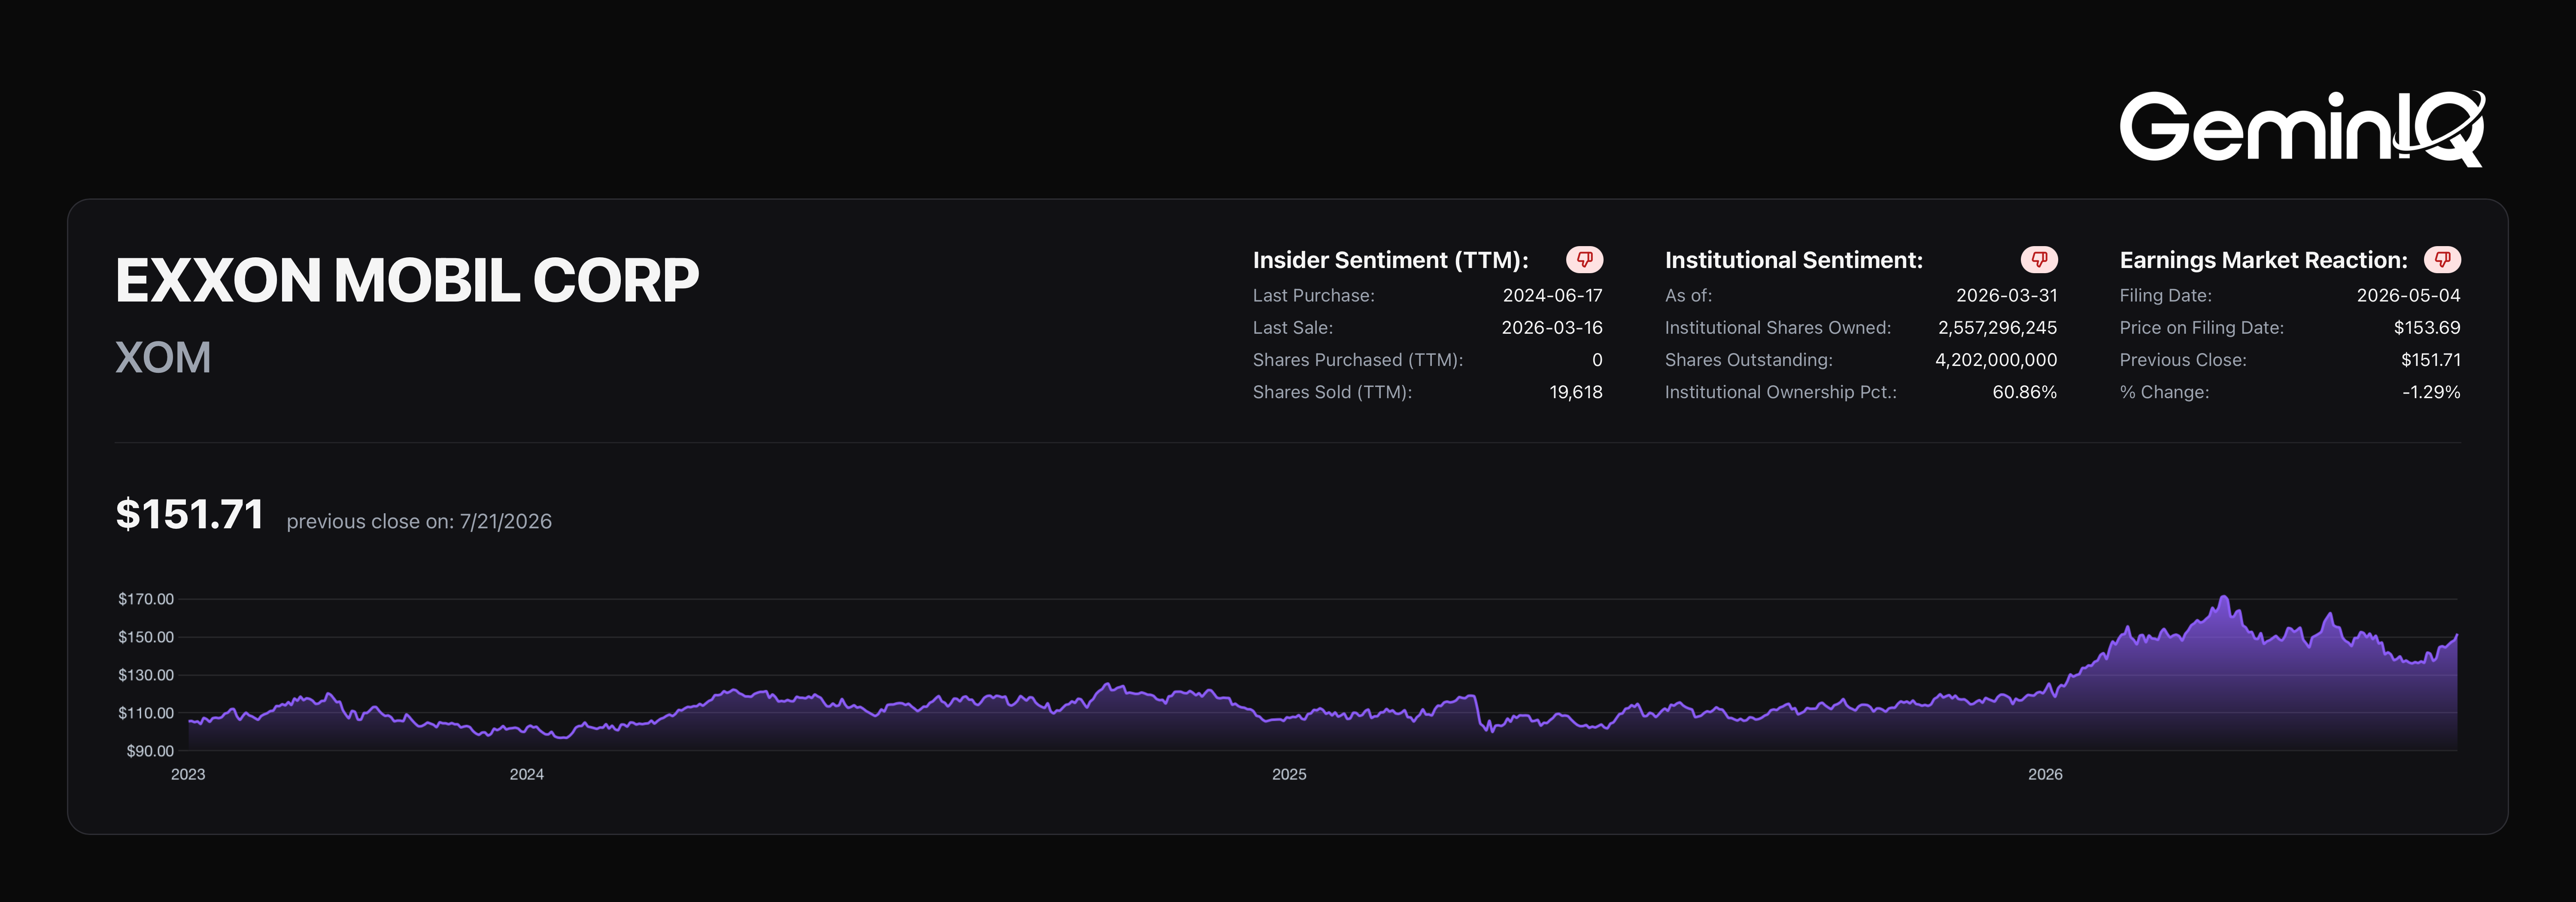
ExxonMobil ($XOM) just dropped its Q1 FY2026 10-Q (filed May 4, 2026). Most coverage of oil majors fixates on the daily crude price and ignores the underlying filing structure entirely. Pulling ExxonMobil's raw cost data naively produces a gross margin north of 99%, a number that's obviously wrong for a company that spends most of its revenue acquiring and processing crude oil. Combine the filing's actual cost components correctly and the real trailing-twelve-month figure is 30.5% — and once that's done properly, a second, more important story shows up: the dividend cushion that made this stock famous has narrowed considerably.
| Field | Value |
|---|---|
| Ticker | $XOM |
| Filing | Q1 FY2026 10-Q |
| Filed | May 4, 2026 |
| Period End | March 31, 2026 |
| Gross Margin (TTM, corrected) | 30.5% |
| FCF Coverage of Dividend | $1.6 Billion |
The Margin Structure Revealed
Naive data pulls on integrated oil majors produce a specific, predictable error, and ExxonMobil is a clean example of it.
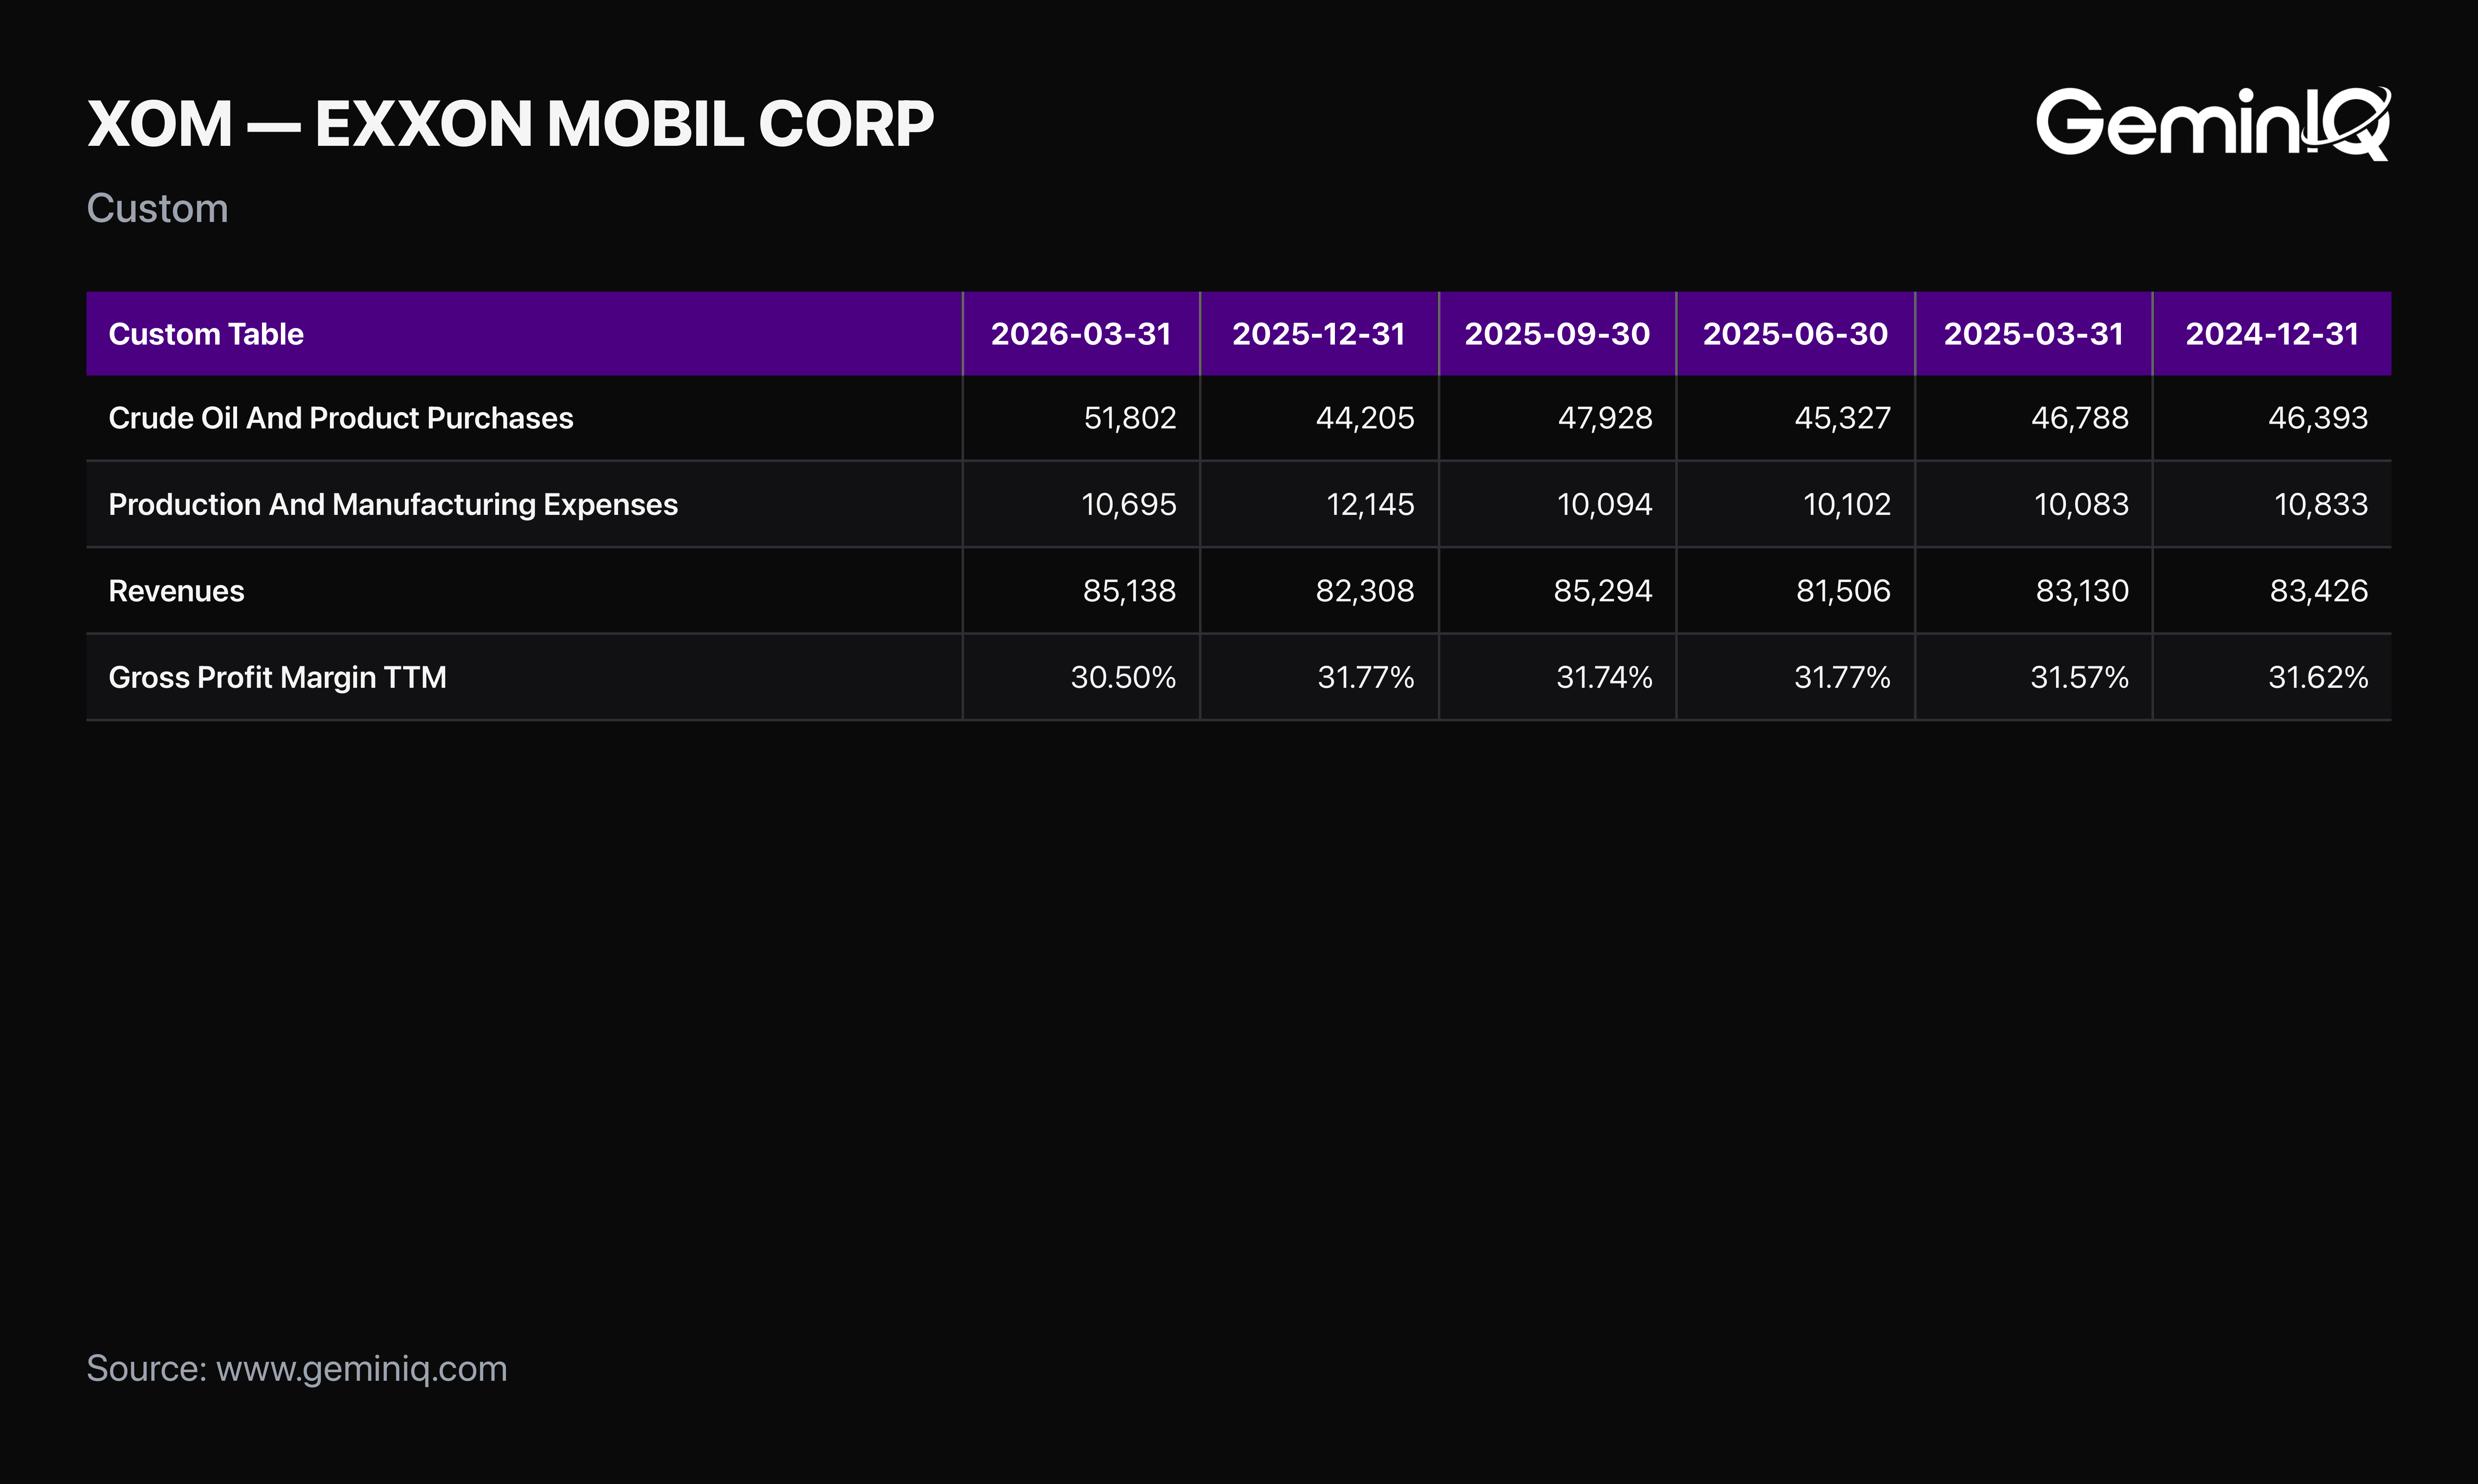
The Data: ExxonMobil reports its direct product costs across two separate filed line items rather than a single "cost of goods sold" tag: Crude Oil And Product Purchases, totaling $189.26 Billion on a trailing-twelve-month basis, and Production And Manufacturing Expenses, totaling $43.04 Billion TTM. Combined, that's $232.30 Billion in direct costs against $334.25 Billion in TTM revenue, for a real Gross Margin of 30.5% — not the implausible ~100% figure a single-tag pull produces when it misses both components entirely.
The GeminIQ Edge: A tool built to grab "cost of goods sold" off a standard tag list finds nothing for ExxonMobil, and either shows a blank field or, worse, silently defaults gross profit to equal revenue. Pulling every cost-related line individually from the raw Financial Statements, and understanding which lines genuinely belong together, is the only way to get a real, usable gross margin for an integrated energy company.
The Cash Flow Engine, Still Running
The headline "cash cannon" story around ExxonMobil from prior filings still holds up, even if the exact numbers have moved.
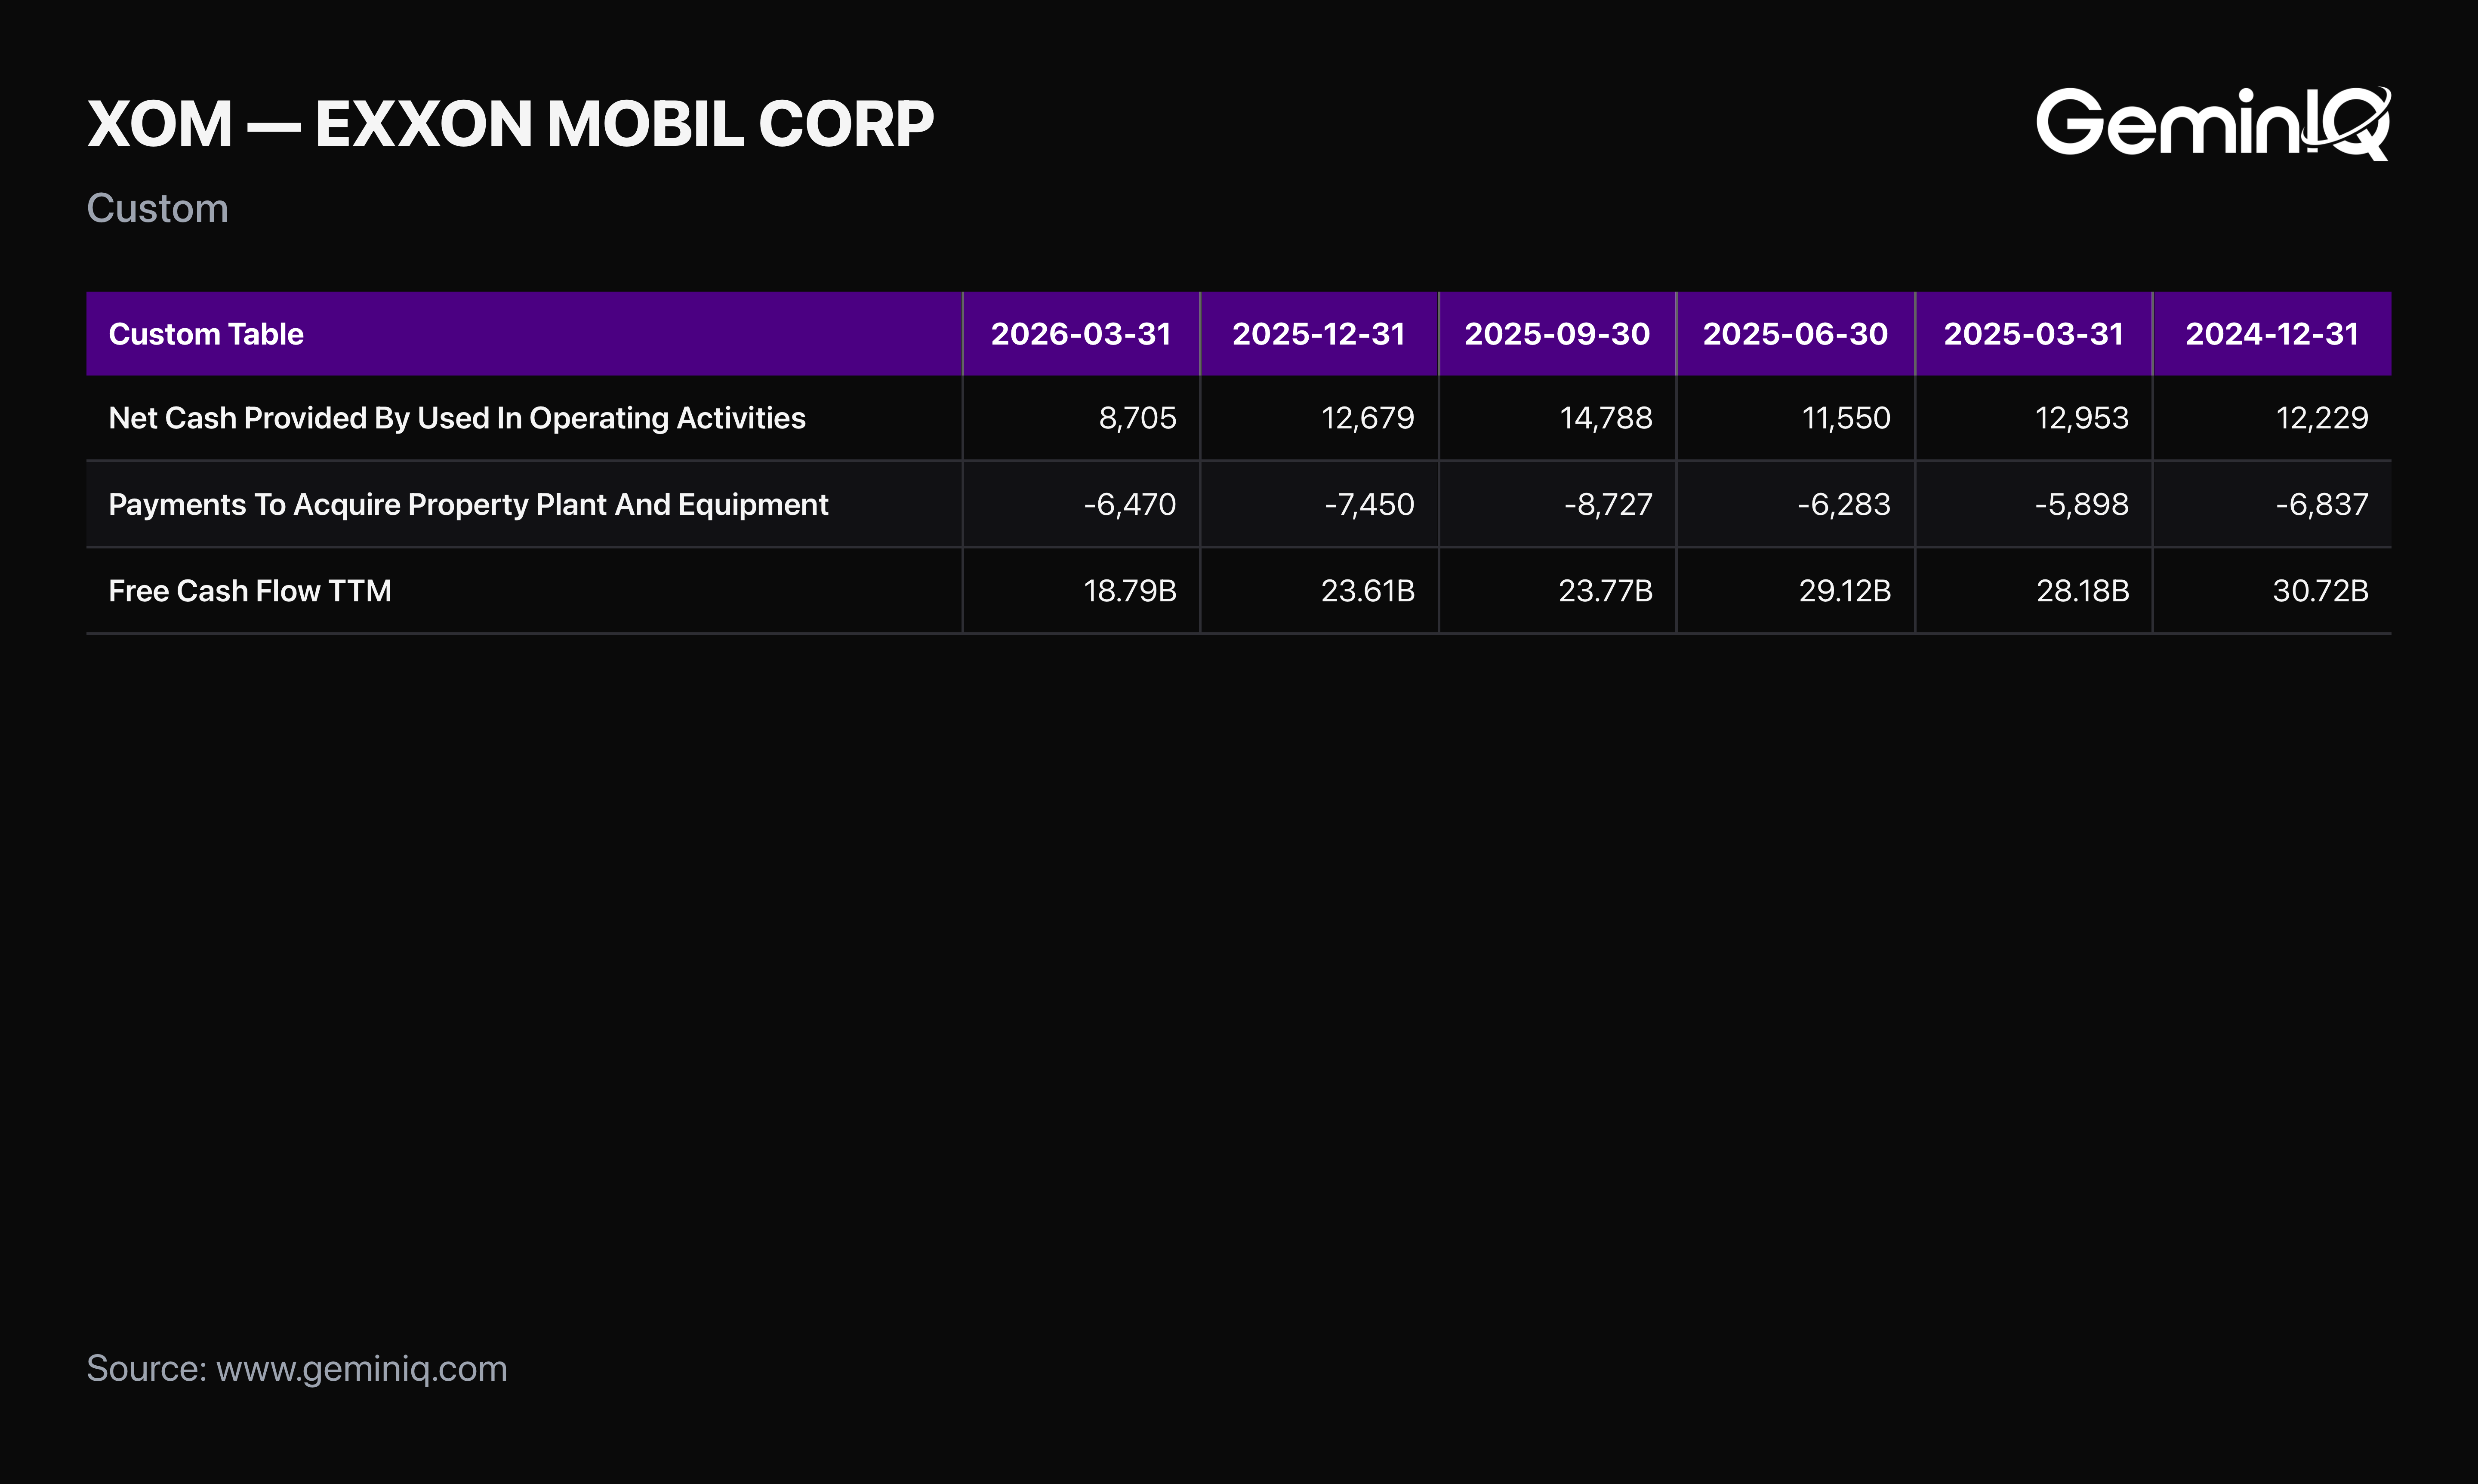
The Data: TTM Operating Cash Flow sits at $47.72 Billion, against TTM CapEx of $28.93 Billion, for TTM Free Cash Flow of $18.79 Billion. Both operating cash flow and free cash flow have eased somewhat from prior peaks, consistent with a period of softer realized margins rather than any operational deterioration.
The GeminIQ Edge: Pulling Financial Statements cash flow data directly, rather than relying on a smoothed non-GAAP adjusted figure, shows the actual trailing trend rather than a single strong quarter presented in isolation.
The Dividend Cushion Has Narrowed
This part of ExxonMobil's story has shifted meaningfully since operating cash flow peaked, and it is worth stating plainly rather than glossing over.
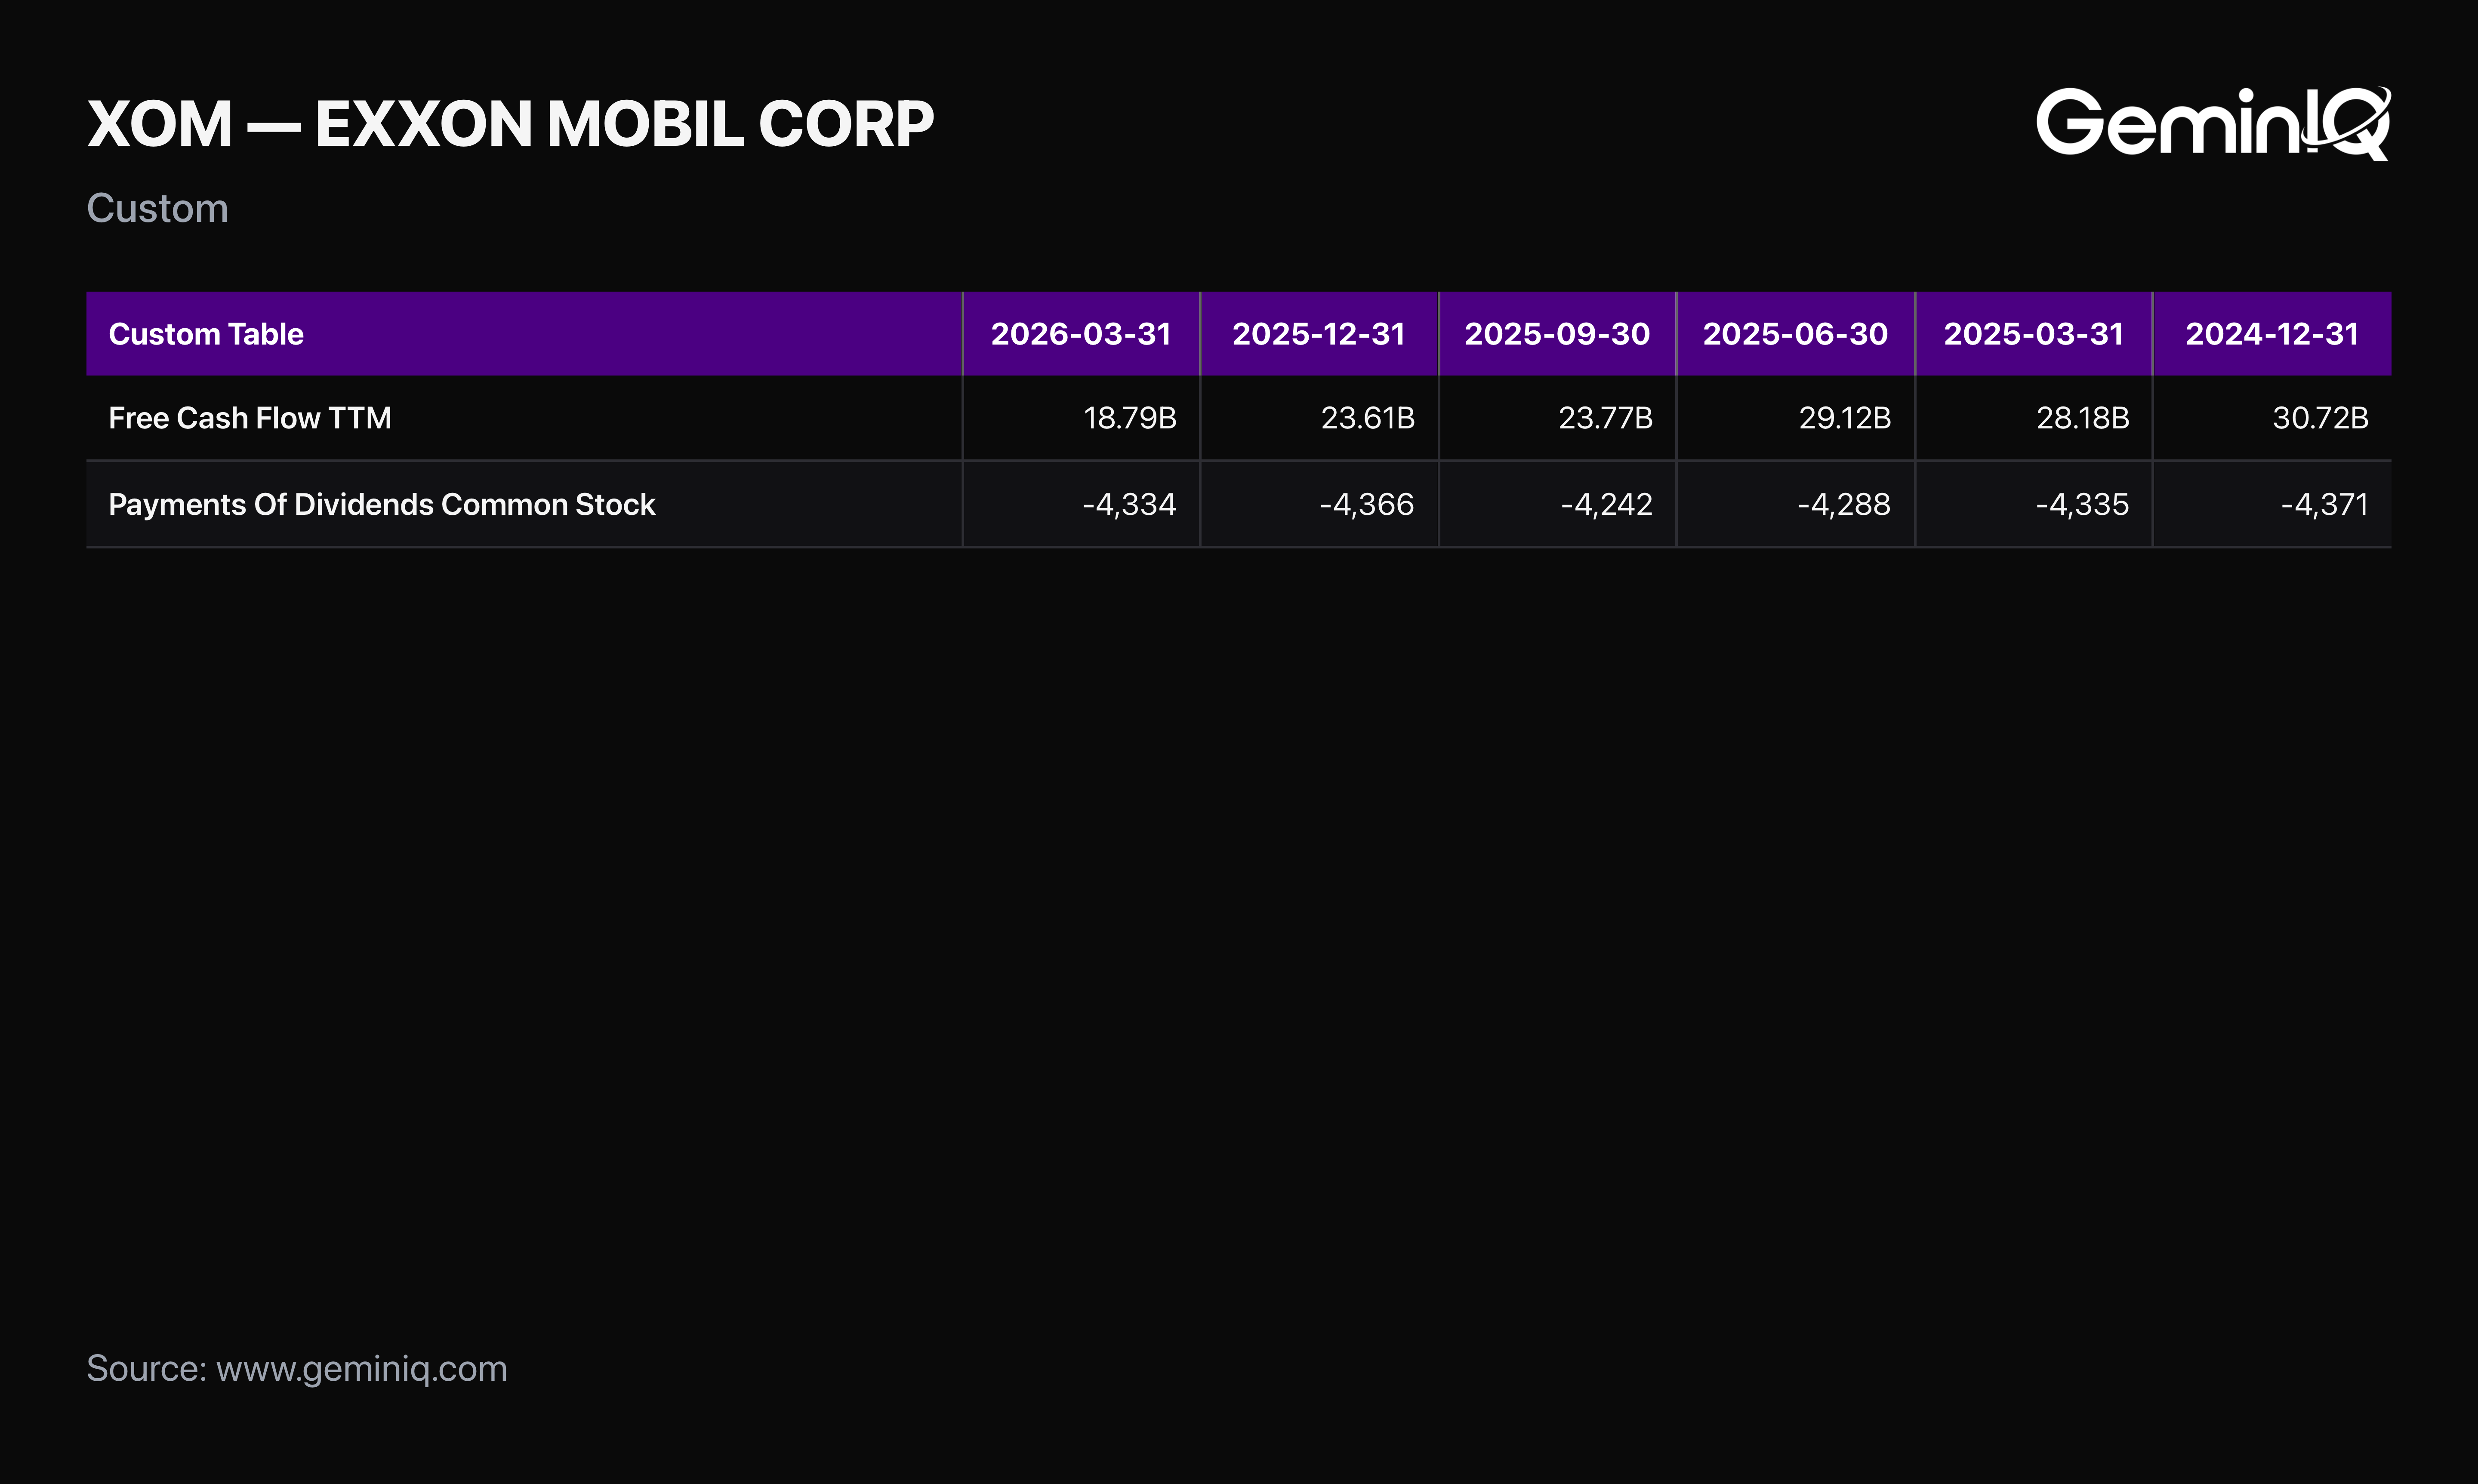
The Data: TTM Dividends Paid stand at $17.23 Billion against TTM Free Cash Flow of $18.79 Billion — a coverage cushion of roughly $1.6 Billion. The dividend remains covered by free cash flow, but the margin of safety has compressed considerably from the wider cushion in prior periods, driven primarily by softer operating cash flow rather than any change in the payout itself.
The GeminIQ Edge: A single-period "dividend is covered" headline misses the trend. Pulling Financial Statements dividends and free cash flow together across multiple periods shows the cushion shrinking in real time, which is a materially different risk picture than a comfortably wide, stable buffer.
Smart Money and the Insider Record
Two different signals around ExxonMobil worth checking on their own terms.
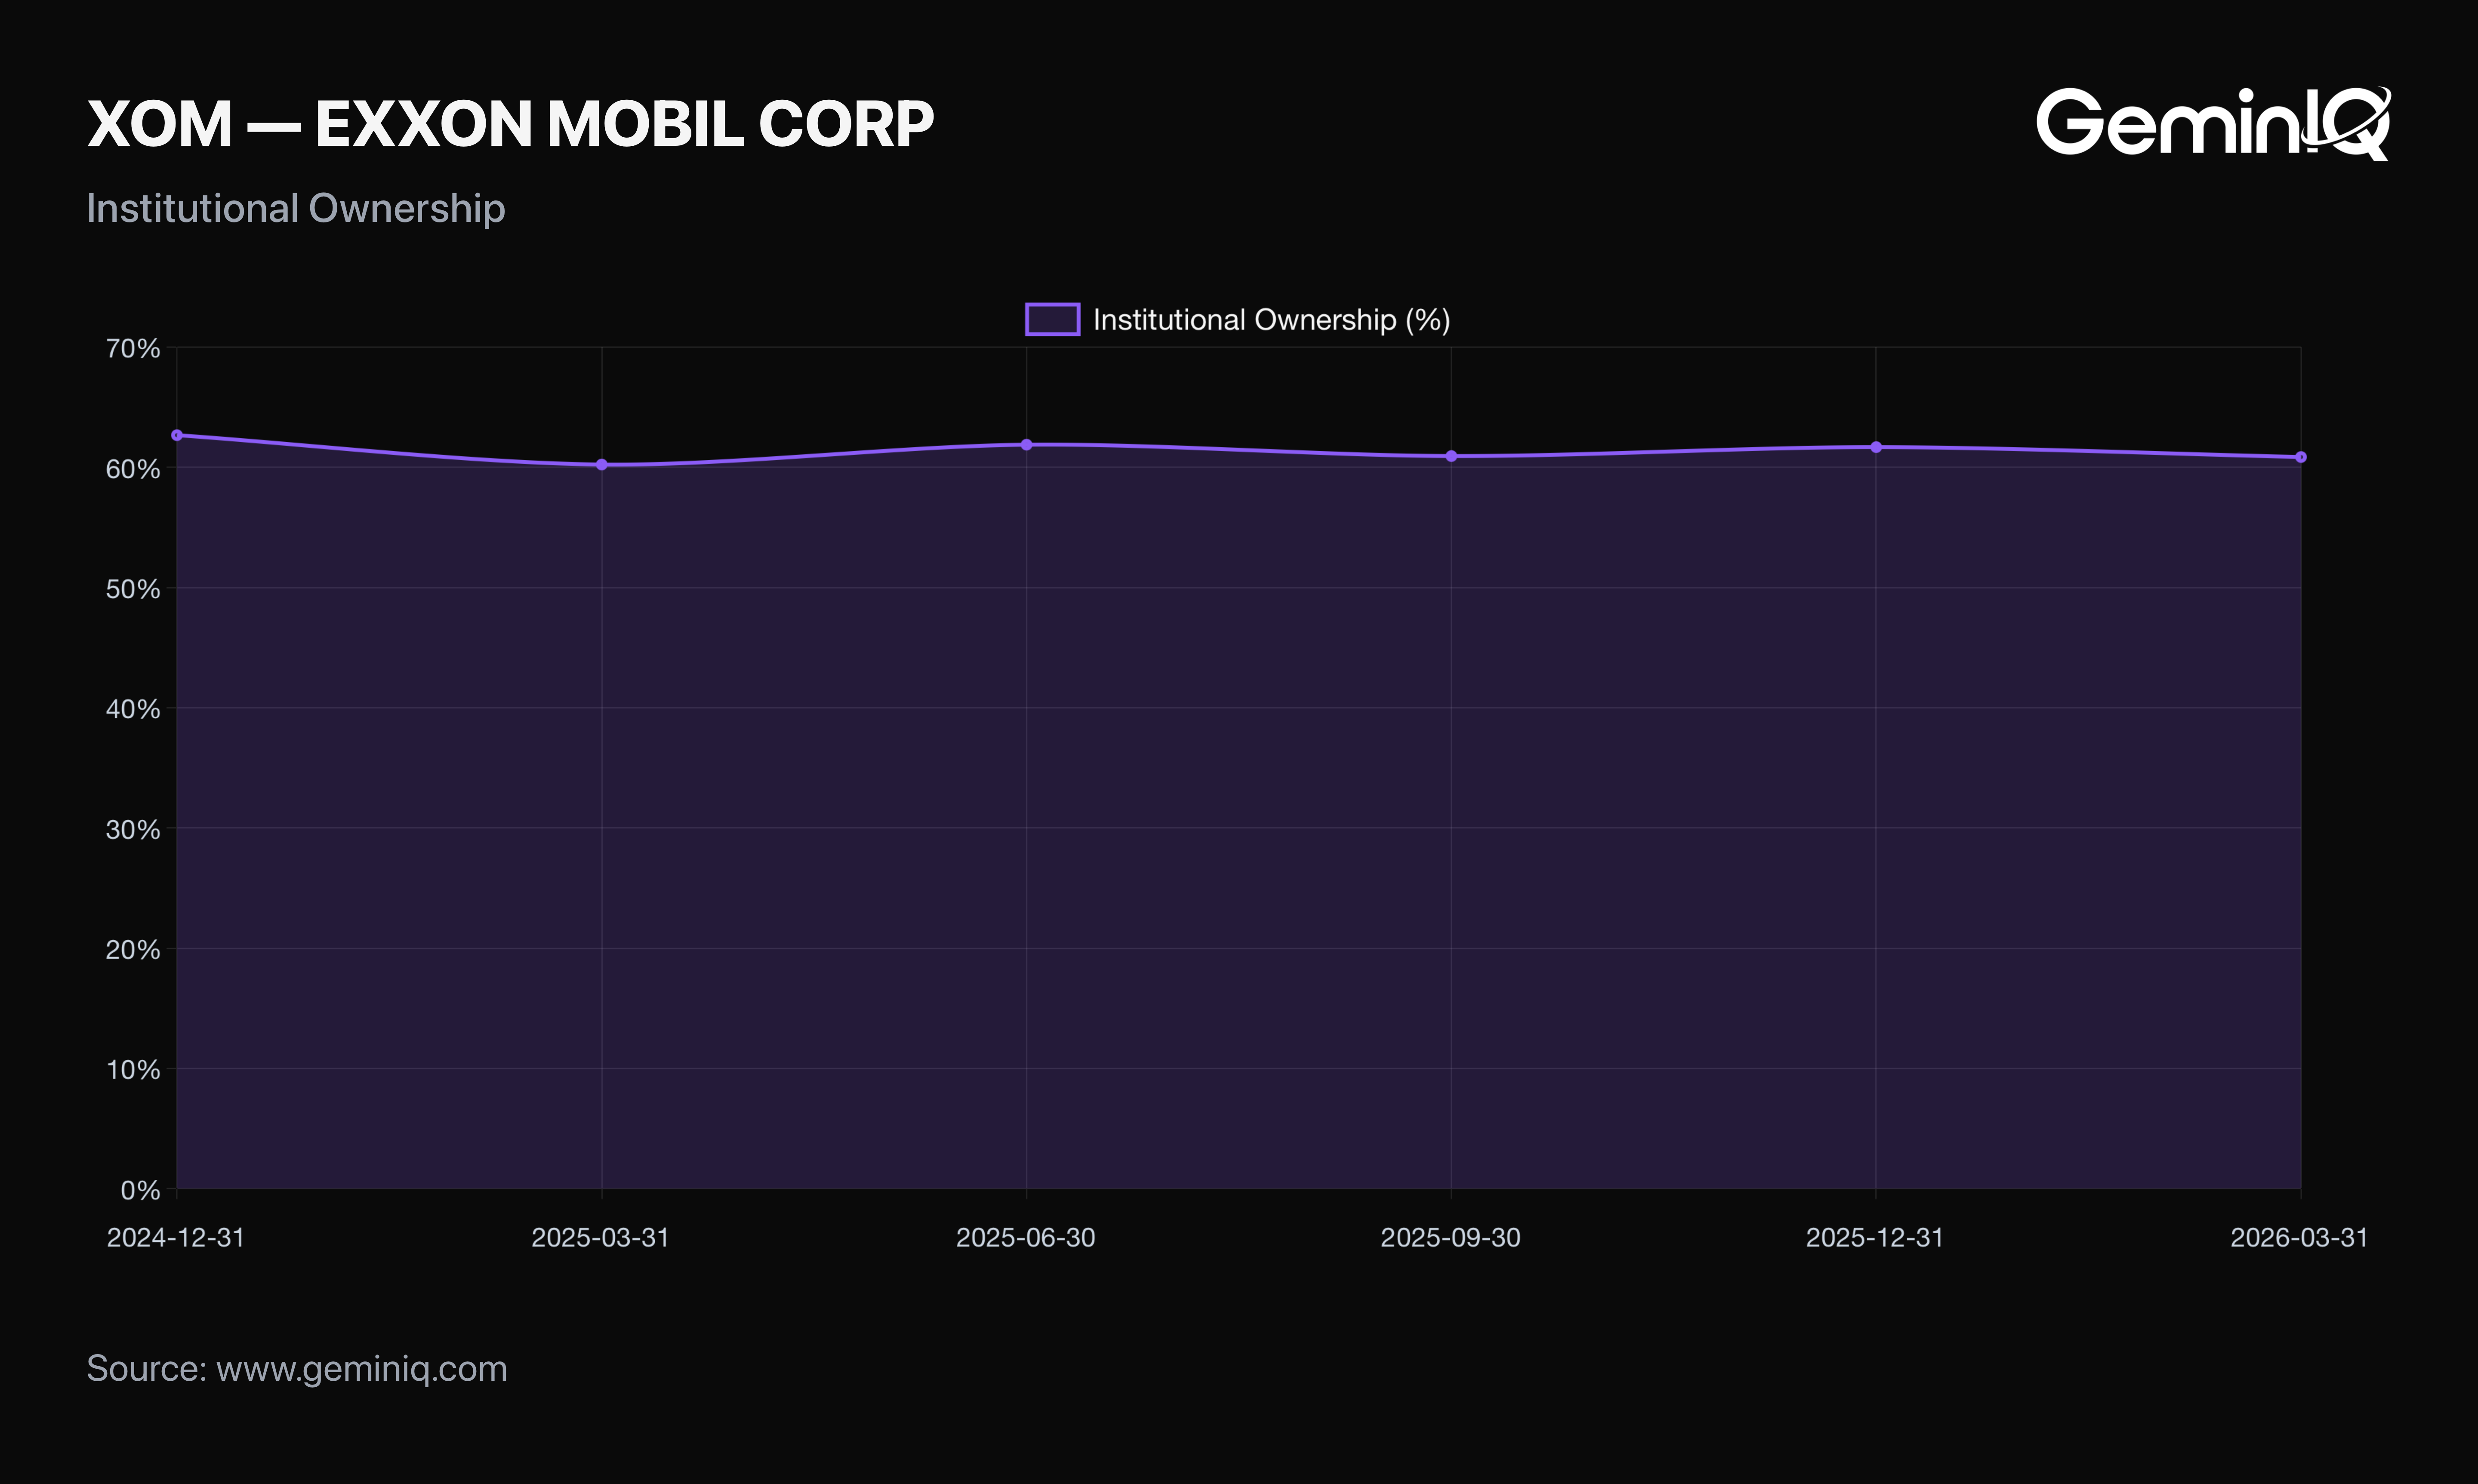
The Data: Institutional Ownership has held in a fairly narrow band, from 62.7% in December 2024 to 60.9% as of the most recent 13F (March 2026, filed with the standard lag) — a modest decline, not a dramatic shift. Insider Transactions show a heavily sale-weighted record: 251 sales against 20 purchases in the available history.
The GeminIQ Edge: Neither figure is dramatic, and that's the honest read rather than a manufactured one. A modestly declining institutional base and a sale-heavy insider pattern are standard for a mature, dividend-paying energy major, not a signal worth over-reading in either direction.
Frequently Asked Questions
What is ExxonMobil's actual gross margin?
ExxonMobil's TTM Gross Margin is 30.5%, calculated by combining Crude Oil And Product Purchases ($189.26 Billion TTM) and Production And Manufacturing Expenses ($43.04 Billion TTM) against TTM revenue. A naive pull that misses both of these separately-reported cost lines can produce a misleadingly high figure near 100%.
Does ExxonMobil's free cash flow still cover its dividend?
Yes, but with a narrower margin than in recent prior periods. TTM Free Cash Flow of $18.79 Billion covers TTM Dividends Paid of $17.23 Billion, a cushion of roughly $1.6 Billion, down from a considerably wider buffer previously.
When did ExxonMobil last file its 10-Q, and what period does it cover?
ExxonMobil's most recent filing is a Form 10-Q filed May 4, 2026, covering the fiscal quarter ended March 31, 2026 (Q1 FY2026).
Where can I verify ExxonMobil's cost and cash flow figures against the original filing?
The figures are drawn directly from ExxonMobil's Q1 FY2026 10-Q, filed with the SEC on May 4, 2026. The full filing is publicly available on SEC EDGAR (linked in the citation block below).
Wall Street's data. Main Street's price.
Institutional terminals charge thousands a year for as-filed accuracy. GeminIQ gives you the same thing for a fraction of the cost: financials built directly from raw SEC EDGAR filings, not third-party APIs, with full XBRL traceability back to the original 10-K or 10-Q. No normalized guesswork, just calculated metrics, charts, screeners, and watchlists built on numbers exactly as the company reported them. Start researching now at GeminIQ.com.
All financial figures cited in this article reference Exxon Mobil Corporation's Q1 FY2026 10-Q (filed May 4, 2026, period ending March 31, 2026). All SEC filings are publicly available at SEC EDGAR.
Disclaimer: The content in this blog is for educational and entertainment purposes only and does not constitute financial, legal, or tax advice. Investing involves risk, including the loss of principal. The views expressed are my own and not intended as financial advice or a guarantee of future performance.