
GameStop Before the Squeeze: Enterprise Value Went Negative

By Chad Hartman
Published · Last updated
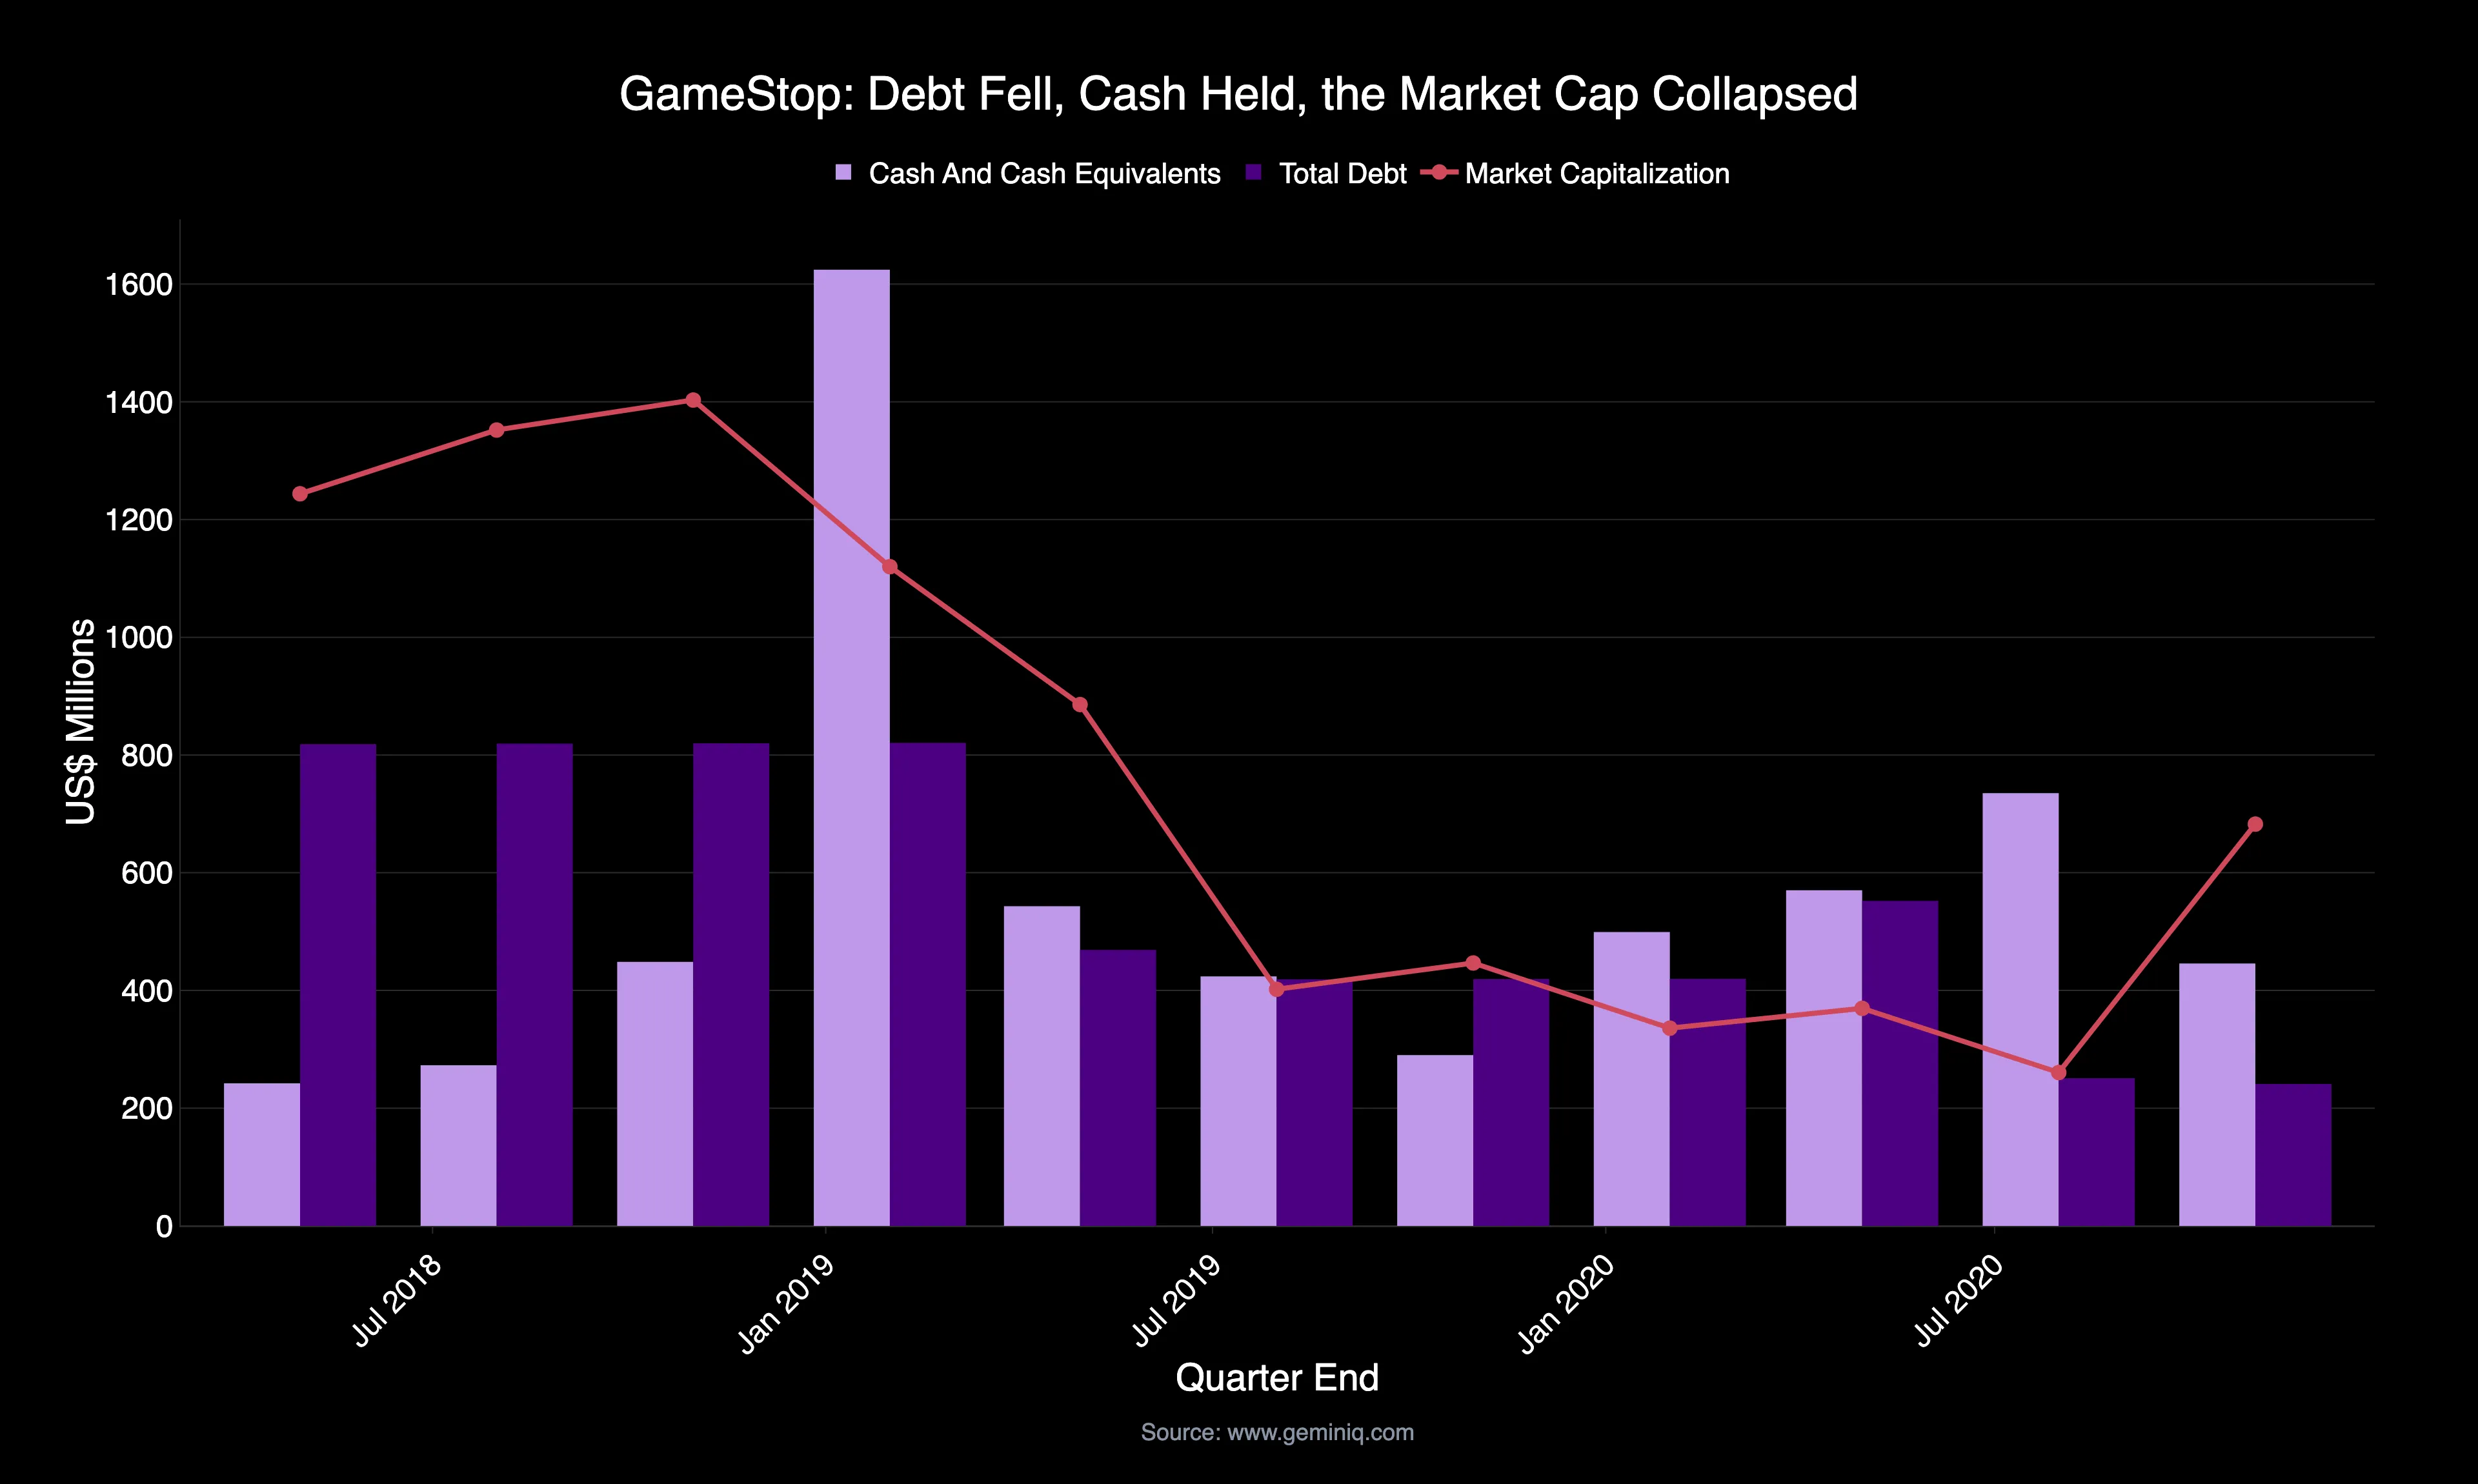
GameStop Corp. ($GME) closed the January 2021 quarter at a market capitalization of $21.13 Billion. Nine months earlier the same company was worth $369.6 Million. The story that hardened around that move is that fundamentals had nothing to do with it, that GameStop was a dying retailer priced for bankruptcy and the filings were beside the point. Half of that is true and the filings confirm it: revenue fell from $8,607.9 Million to $5,089.8 Million across four fiscal years, and goodwill went to zero. The other half does not survive the documents. Across the same stretch, GameStop retired 70.6% of its total debt, and at the July 2020 quarter close the market valued its entire operating business at negative $247.0 Million. The bankruptcy thesis was not contradicted by a forum. It was contradicted by the balance sheet, in filings published months before anything happened to the price.
| Study Scope | Detail |
|---|---|
| Company | GameStop Corp. ($GME) |
| Filing window | April 2018 – March 2022, 17 filings |
| Filing types | 10-K and 10-Q, as filed |
| Insider records | 23 Form 4 records in window |
| Outcome examined | Quarter-end market capitalization from $260.7 Million (July 2020) to $21.13 Billion (January 2021) |
| Forward-return window | 1–3 months after each 10-Q; 12 months after each 10-K |
Every figure below comes from GameStop's own filings, read in the order they reached EDGAR and joined to how the stock traded in the one to twelve months afterward. A 10-Q carries roughly three months of post-filing reaction; a 10-K carries twelve. These periods predate the three-year window shown on GeminIQ's stock pages and were pulled from the full as-filed history. GameStop's price series is split-adjusted for the four-for-one split of July 2022; Form 4 prices are shown as filed and are not.
At the July 31, 2020 quarter close, GameStop's Enterprise Value read -$247.0 Million: $735.1 Million of cash and $23.5 Million of restricted cash against a $260.7 Million market capitalization and $250.9 Million of total debt. Over the same year, aggregated 13F filings reported more GameStop shares than GameStop had issued — 122.62% of shares outstanding at March 2020, and above 100% for four consecutive quarters.
GameStop Revenue Fell 40.9% and Goodwill Went to Zero
The retailer was dying, and the filings say so without hedging. Nothing in this study argues otherwise.
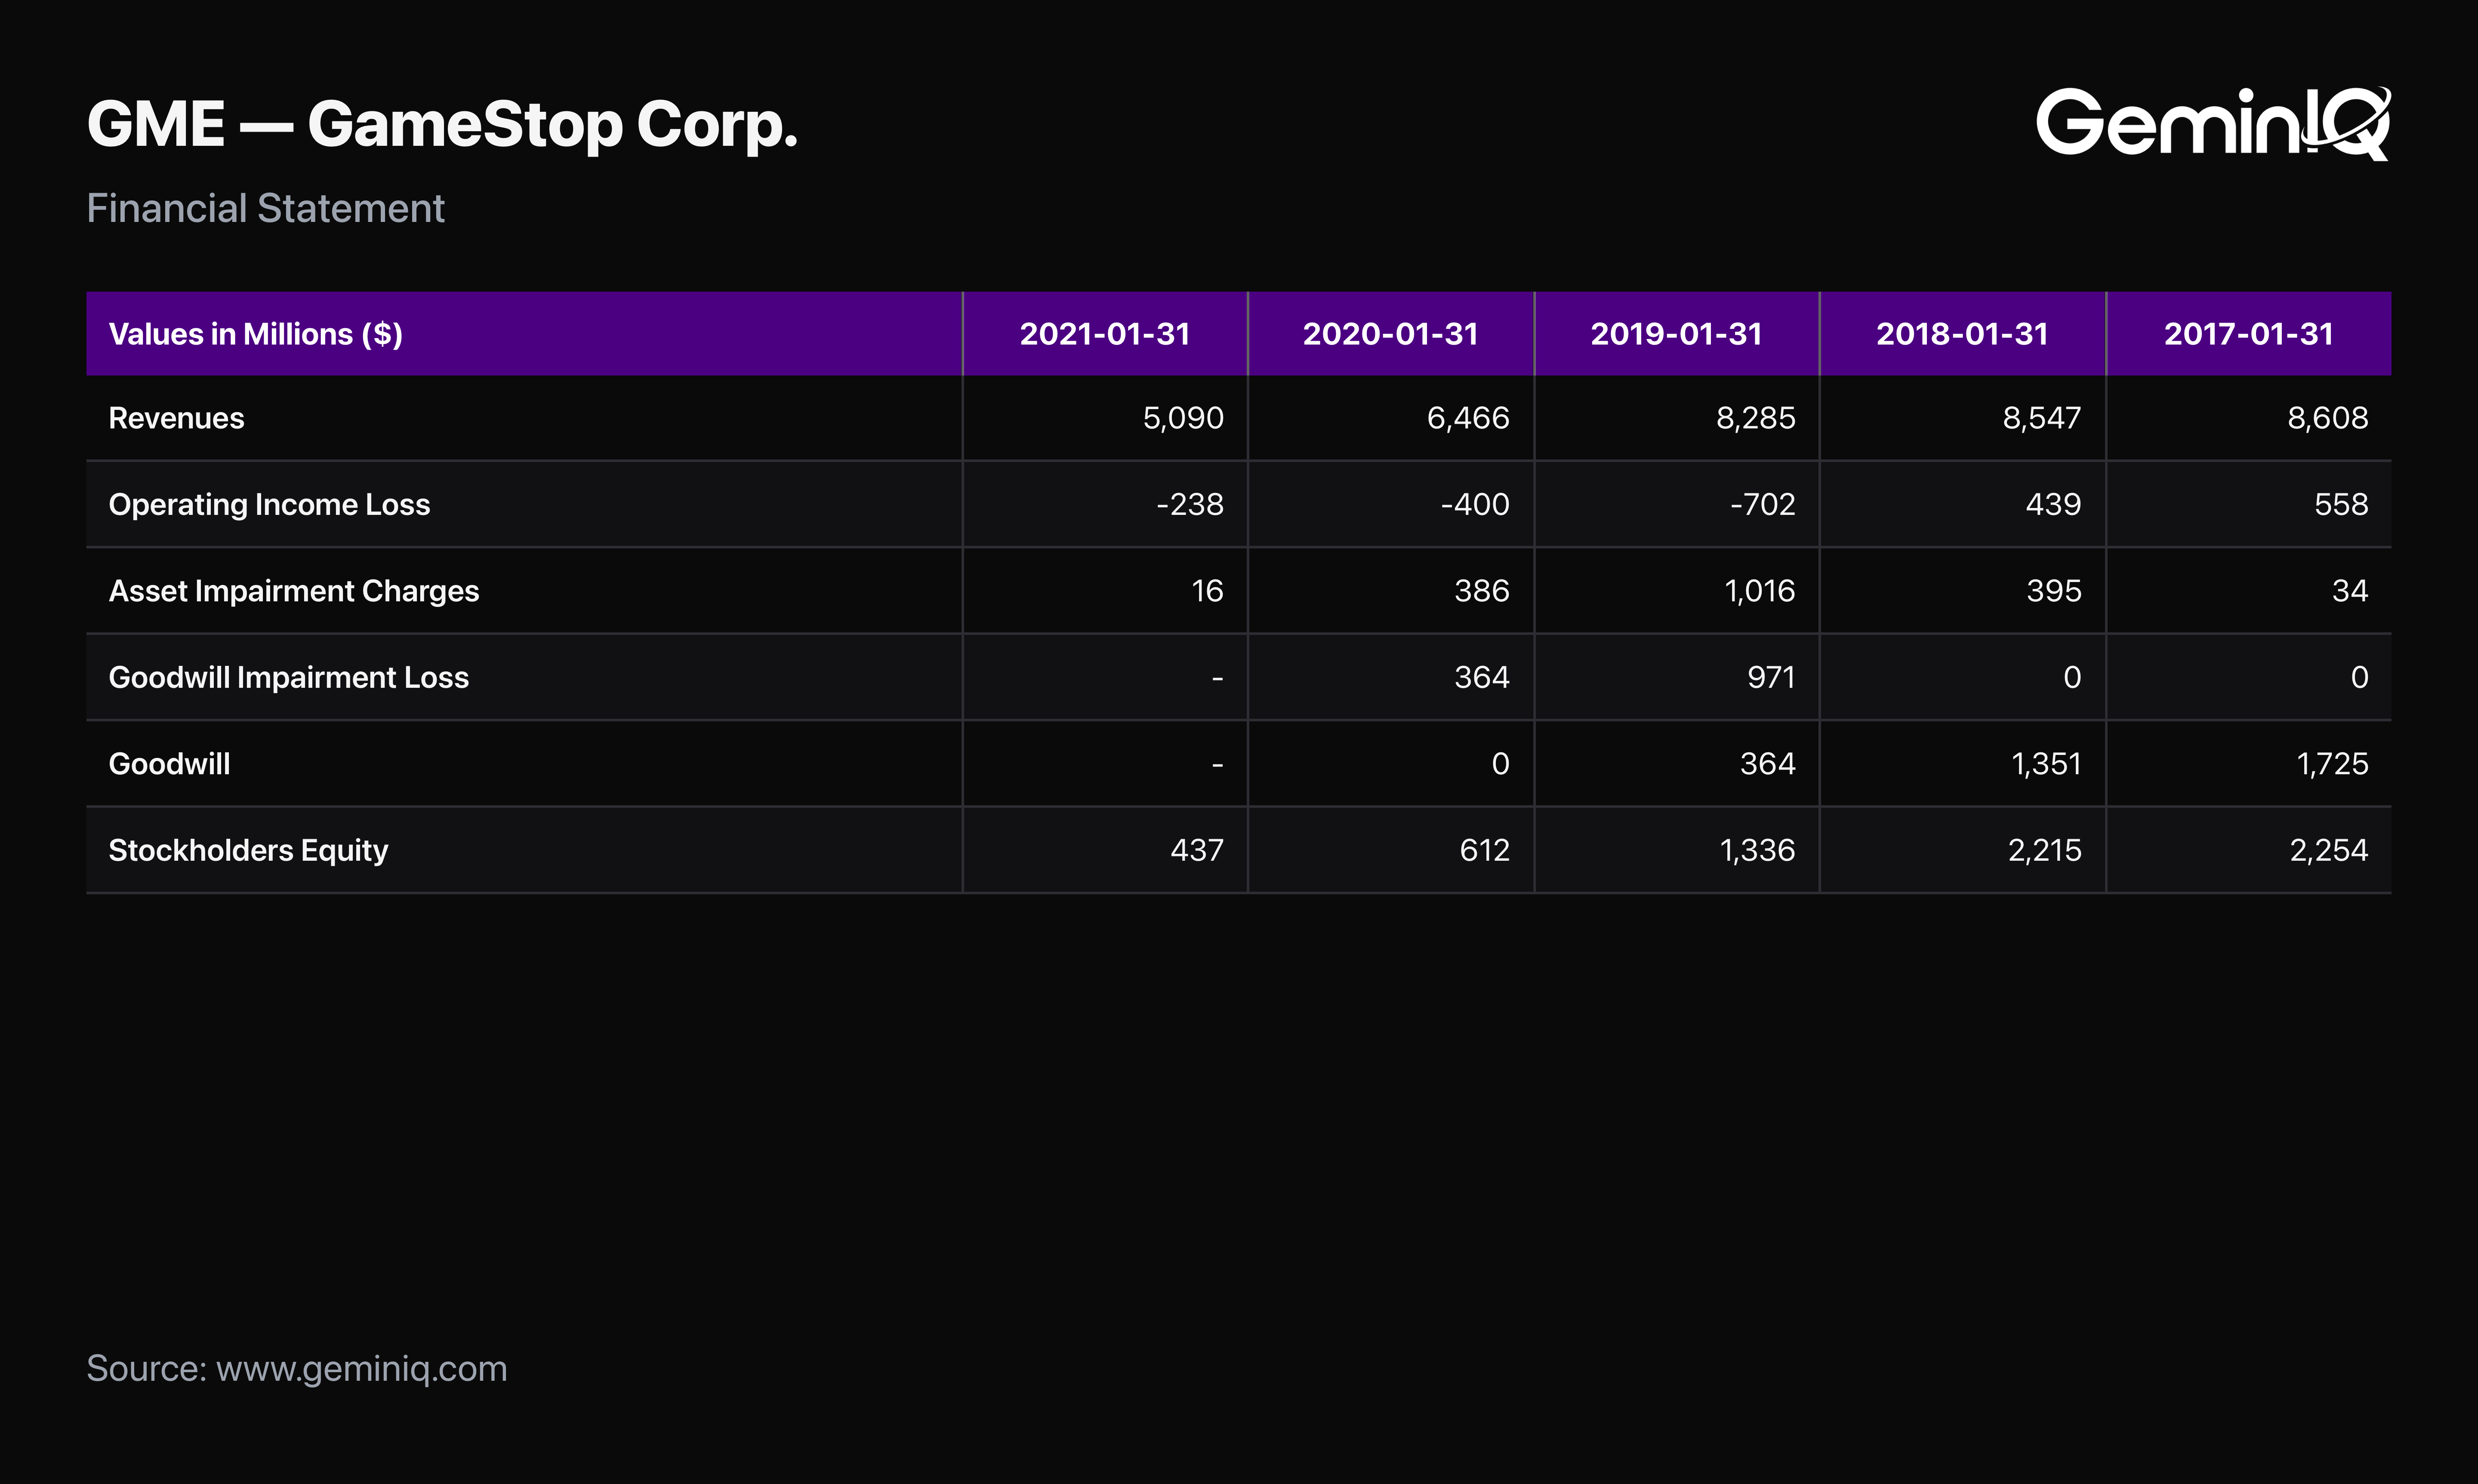
The Filing Data: GameStop's annual Revenues fell from $8,607.9 Million in the fiscal year ended January 2017 to $8,547.1 Million, then $8,285.3 Million, then $6,466.0 Million, and finally $5,089.8 Million in the year ended January 2021 — a decline of 40.9% across four years. Operating Income Loss went from a positive $557.7 Million to -$702.0 Million, -$399.6 Million, and -$237.8 Million. Asset Impairment Charges ran $395.1 Million, then $1,015.9 Million, then $385.6 Million across three consecutive years. Goodwill Impairment Loss took $970.7 Million and then $363.9 Million, carrying Goodwill from $1,725.2 Million down to $0.0 Million by January 2020.
The Signal: A company that writes its entire goodwill balance to zero is stating in an SEC filing that the acquisitions behind it will not produce the cash they were bought for. Stockholders Equity fell from $2,254.1 Million to $436.7 Million over the same four years. The bear case had a documentary basis and it was right about the income statement. It was wrong about the only claim the price was actually making.
GameStop Total Debt Fell 70.6% to $241.0 Million
A stock priced for insolvency implies obligations the company cannot meet. GameStop spent the entire decline making that harder to argue.
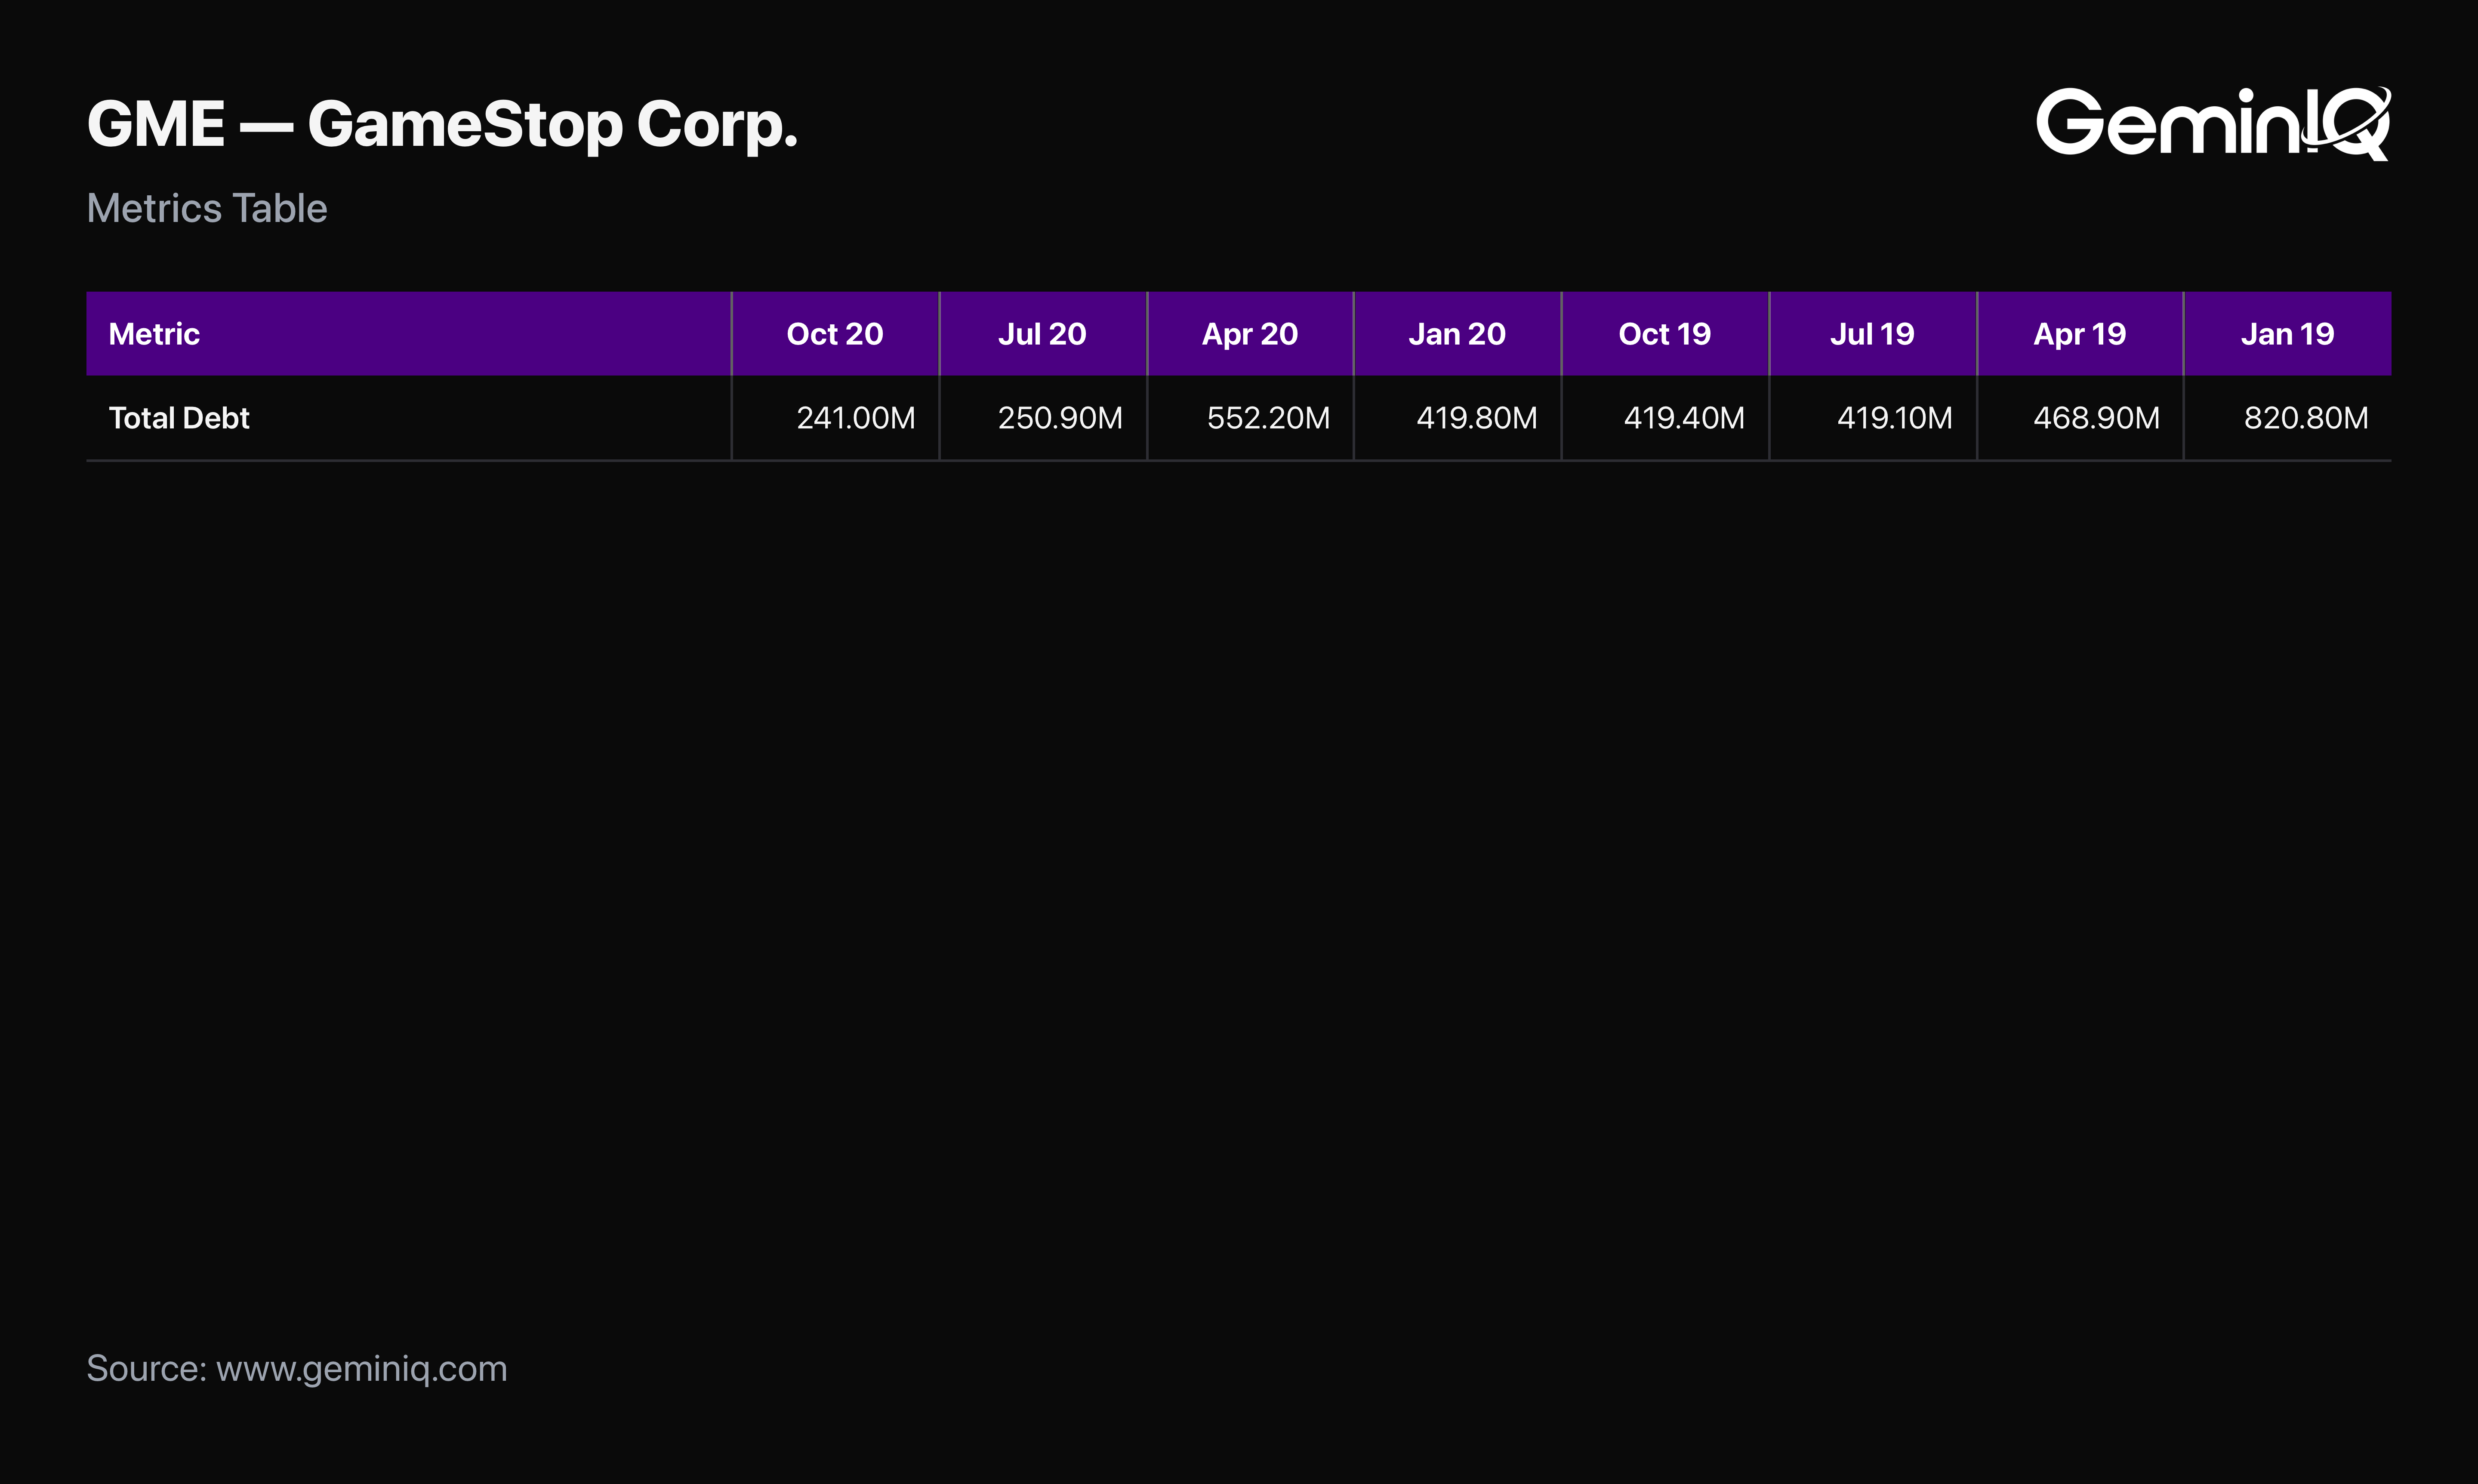
The Filing Data: At January 31, 2019, GameStop carried Long Term Debt Current of $349.2 Million and Long Term Notes Payable of $471.6 Million, for total debt of $820.8 Million — the peak in this window. Twenty-one months later, at October 31, 2020, the balance sheet showed Lines Of Credit Current of $25.0 Million and Long Term Debt Noncurrent of $216.0 Million, for total debt of $241.0 Million. The company retired $579.8 Million of borrowings, 70.6% of the peak, while its revenue was still falling. The cash flow statements show how: Repayments Of Long Term Debt of $404.5 Million in the year ended January 2020 and a further $130.3 Million the year after.
The Signal: GeminIQ's Total Debt reads $241.0 Million at that quarter and reconciles exactly to the two filed line items above, which matters because the same balance sheet also carried Operating Lease Liability Current of $212.9 Million and Operating Lease Liability Noncurrent of $456.7 Million. The lease obligations were larger than the borrowings. A reader working from a single summary debt figure sees neither the composition nor the direction. The direction was down, quarter after quarter, through the worst of the decline.
GameStop's Enterprise Value Read Negative $247.0 Million in July 2020
Deleveraging into a collapsing top line is a defensible thing to be skeptical about. Pricing the operating business at less than nothing is a different claim, and the filings date exactly when the market made it.
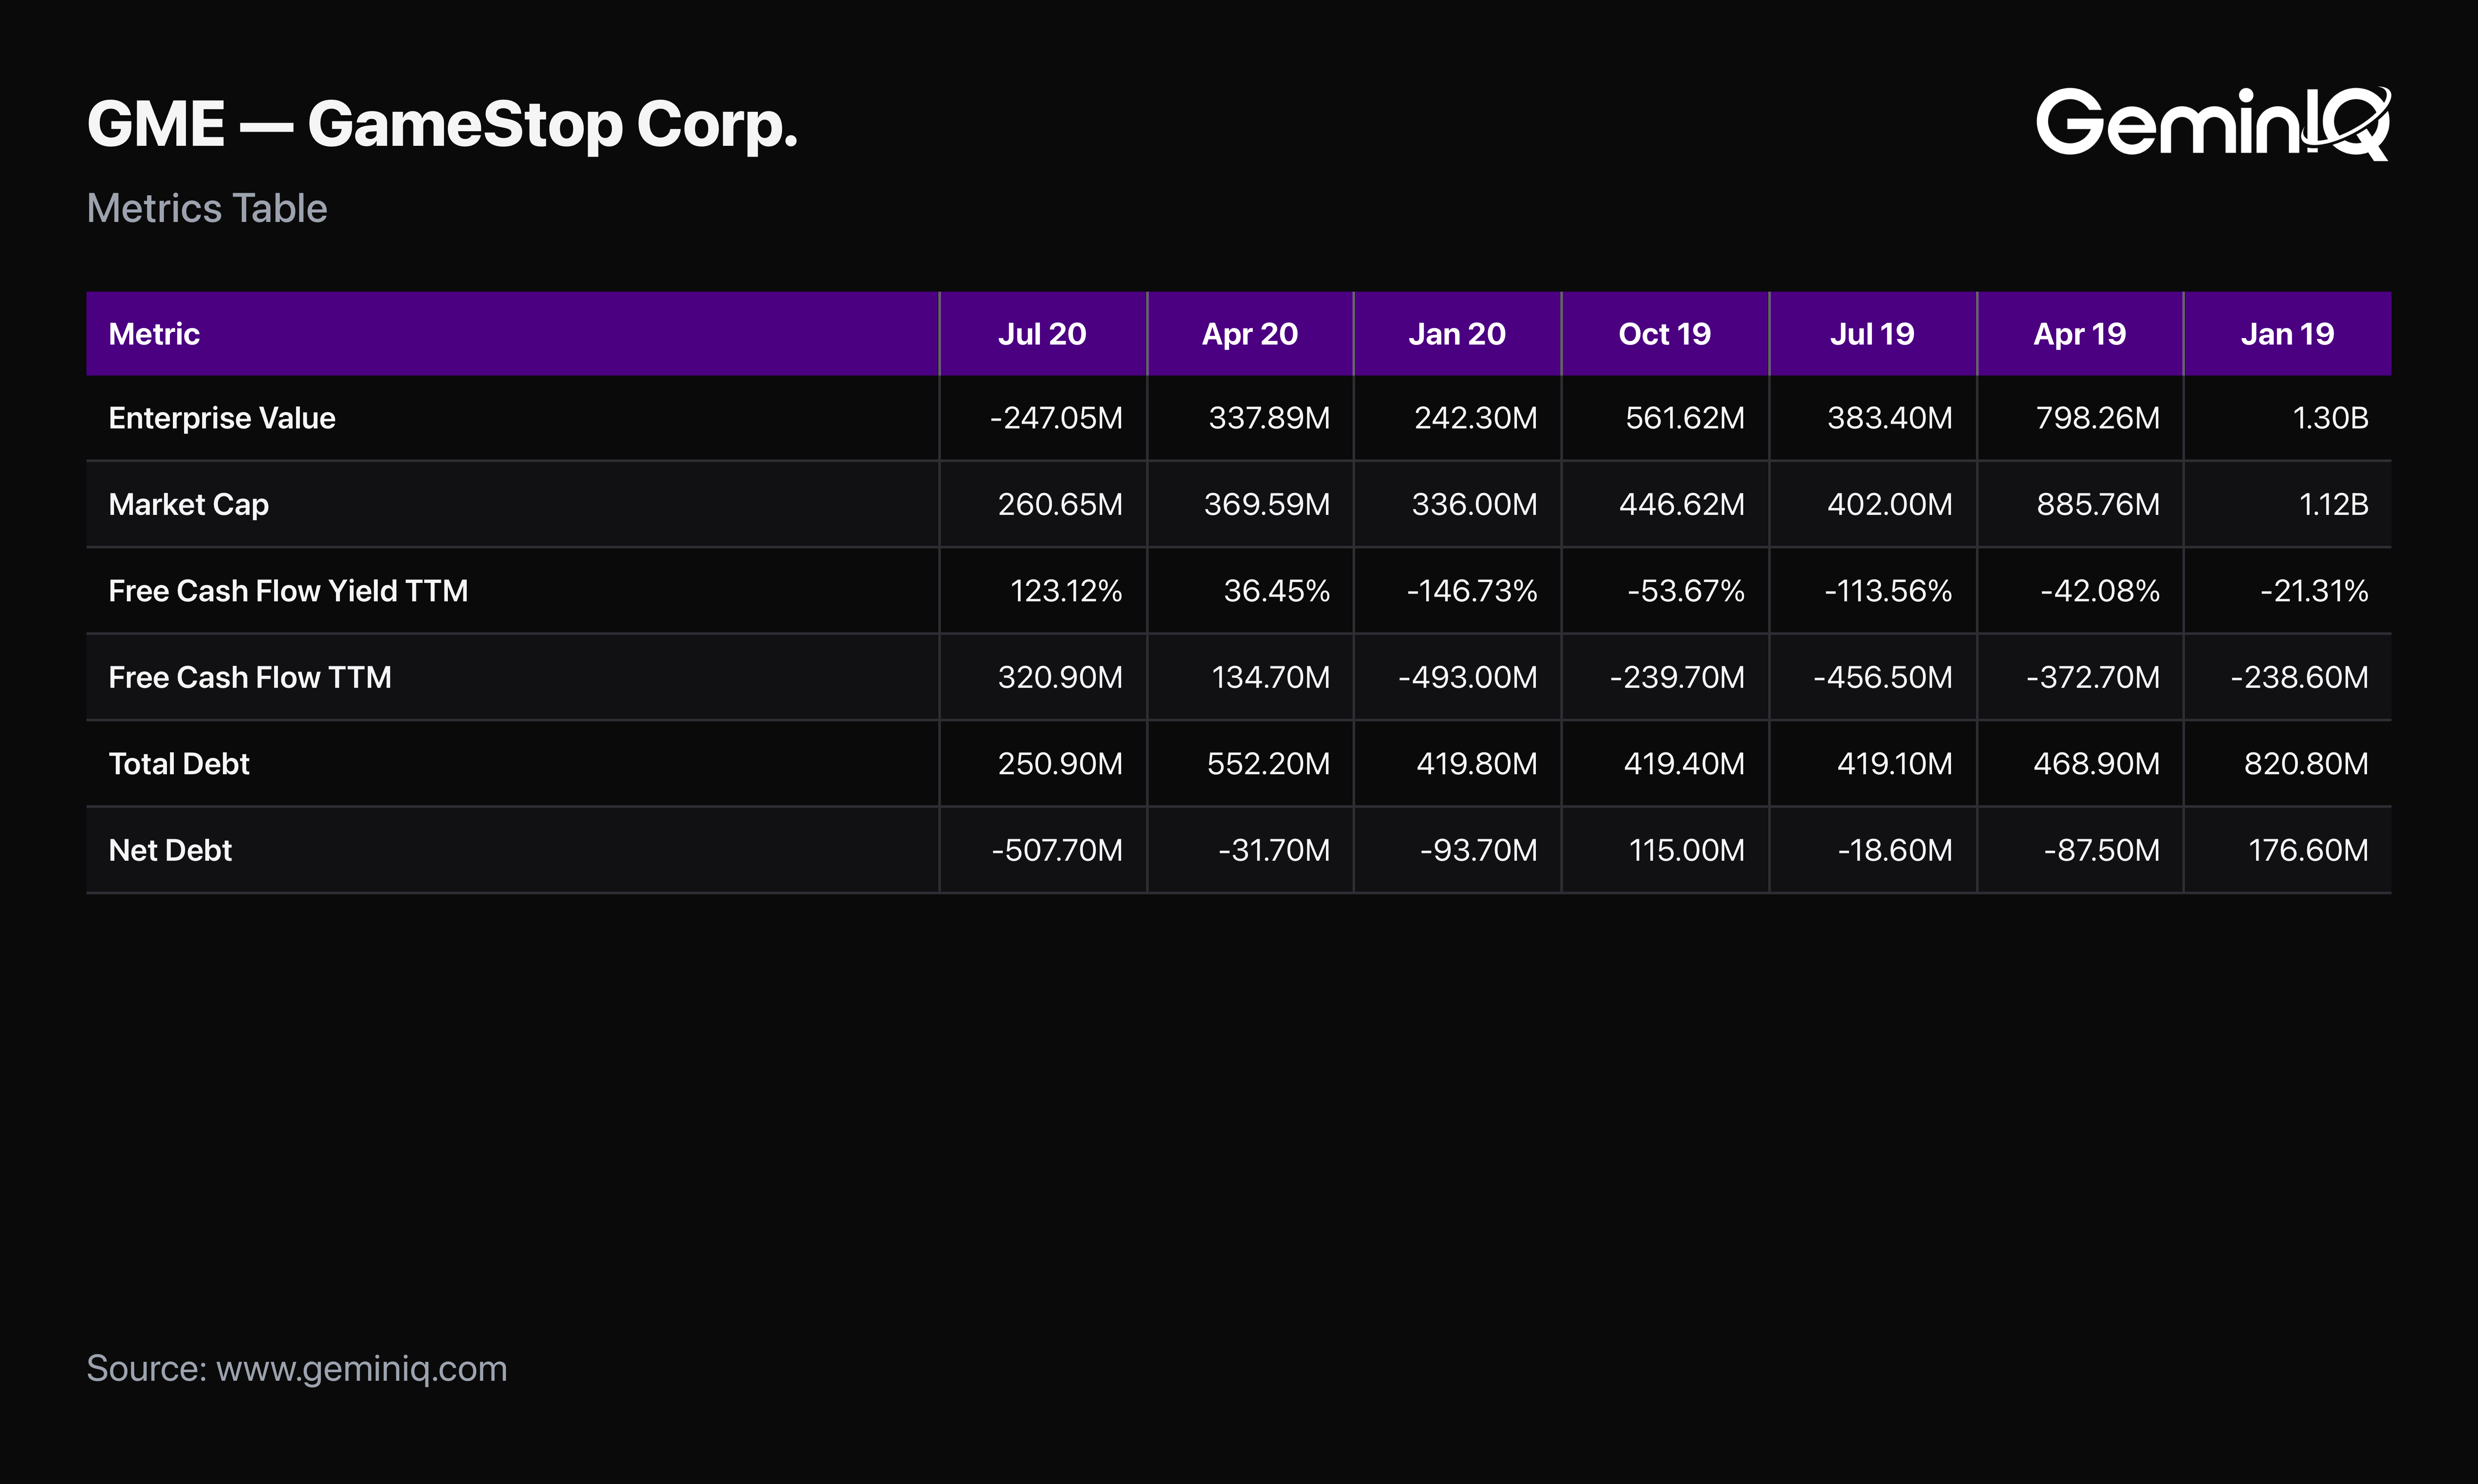
The Filing Data: At the July 31, 2020 quarter close, GameStop's market capitalization was $260.7 Million. The balance sheet in the 10-Q filed September 9, 2020 showed Cash And Cash Equivalents At Carrying Value of $735.1 Million, plus Restricted Cash Current of $11.0 Million and Restricted Cash Noncurrent of $12.5 Million, against total debt of $250.9 Million. GeminIQ's Enterprise Value for that quarter reads -$247.0 Million. Trailing twelve-month free cash flow was $320.9 Million, putting the Free Cash Flow Yield at 123.12%.
The Signal: The cash balance alone was 2.8 times the entire equity value. An acquirer paying every shareholder in full and assuming every borrowing would have been handed more cash than the transaction cost. That is what a negative enterprise value means, and it is computed from three filed numbers with no assumptions in it. The market was not pricing a hard fundamental question about whether the retailer would shrink. It was pricing a solvency outcome the balance sheet did not describe.
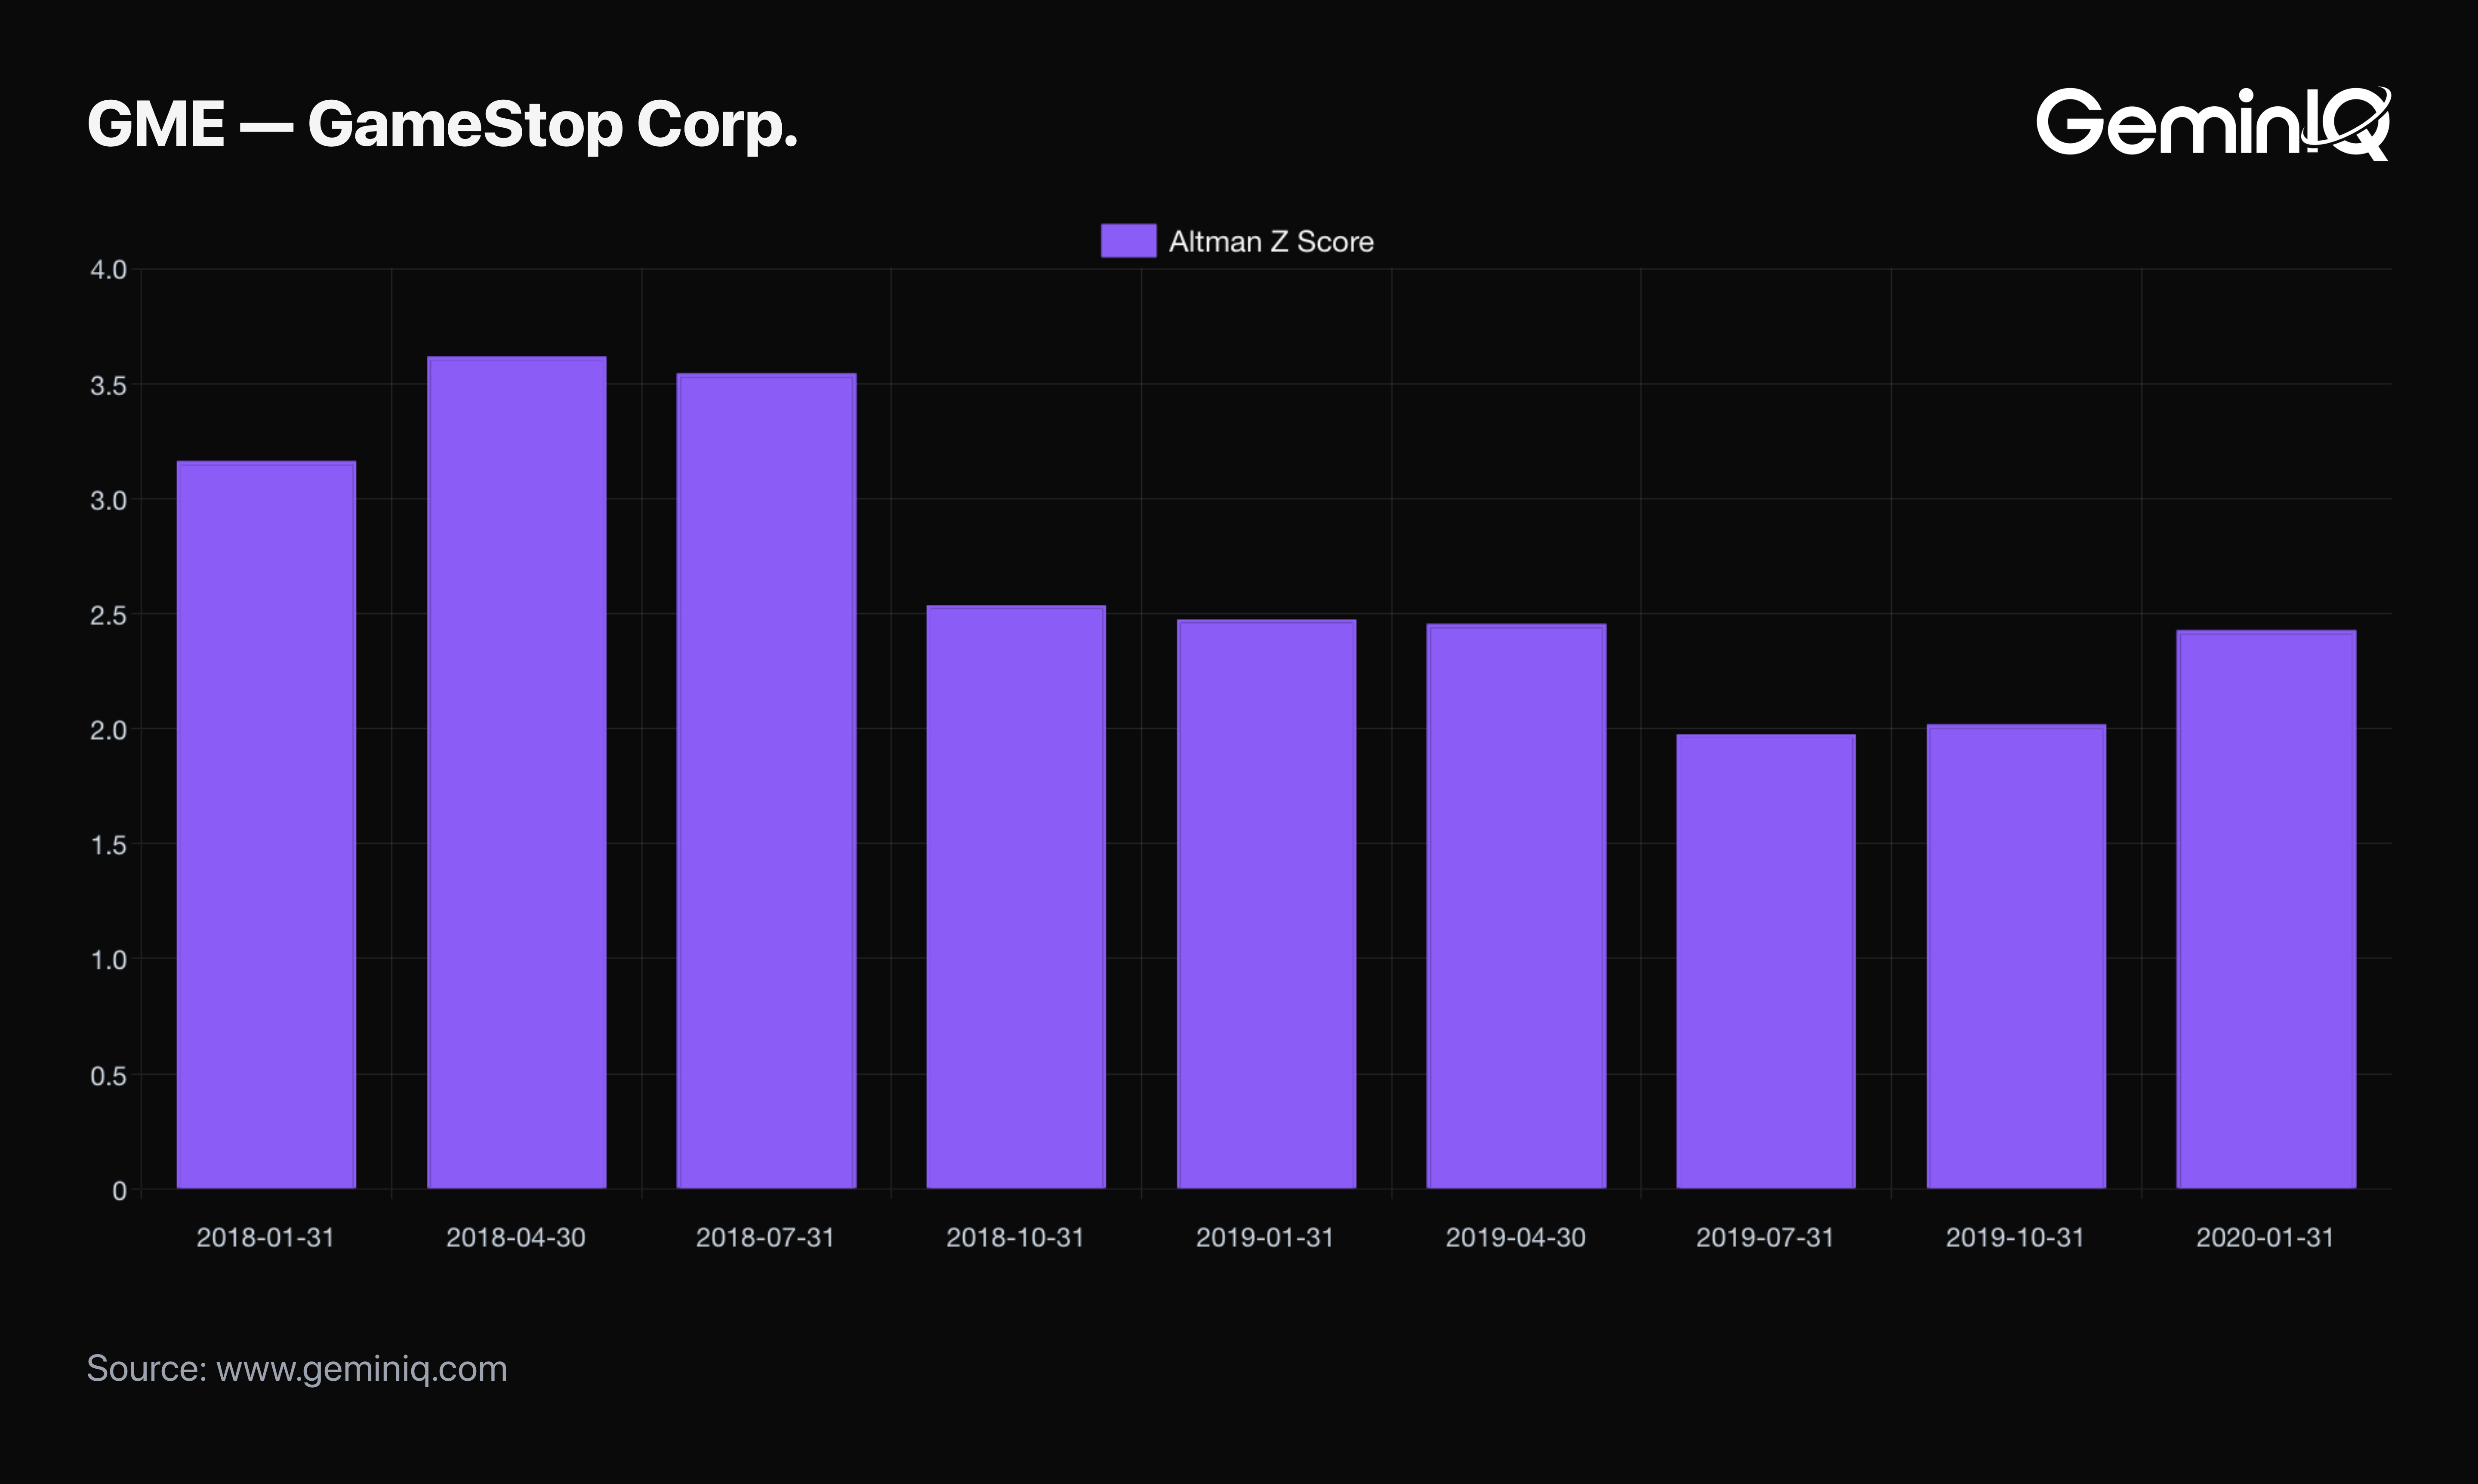
GameStop's Altman Z-Score Never Fell Below 1.9755
If the market was pricing bankruptcy, the standard academic measure of bankruptcy risk should have agreed with it.
The Filing Data: GeminIQ's Altman Z-Score for GameStop reads 2.4765 at January 2019, 1.9755 at July 2019, 2.4280 at January 2020, 2.4831 at July 2020, and 2.1816 at October 2020. Across the entire window its lowest reading was 1.9755. The conventional distress threshold sits at 1.81, with the grey zone running from there to 2.99.
The Signal: GameStop spent three years in the grey zone and never crossed into the distress zone, in a period when its equity traded at a Price-to-Sales Ratio of 0.0466. The Z-Score is not a forecast and a grey-zone reading is not an all-clear — it is a statement that the five filed inputs did not combine into a distress signature. The market's implied verdict and the model's computed one had been diverging for two full years by the time this mattered. Anyone could have run the comparison from public documents.
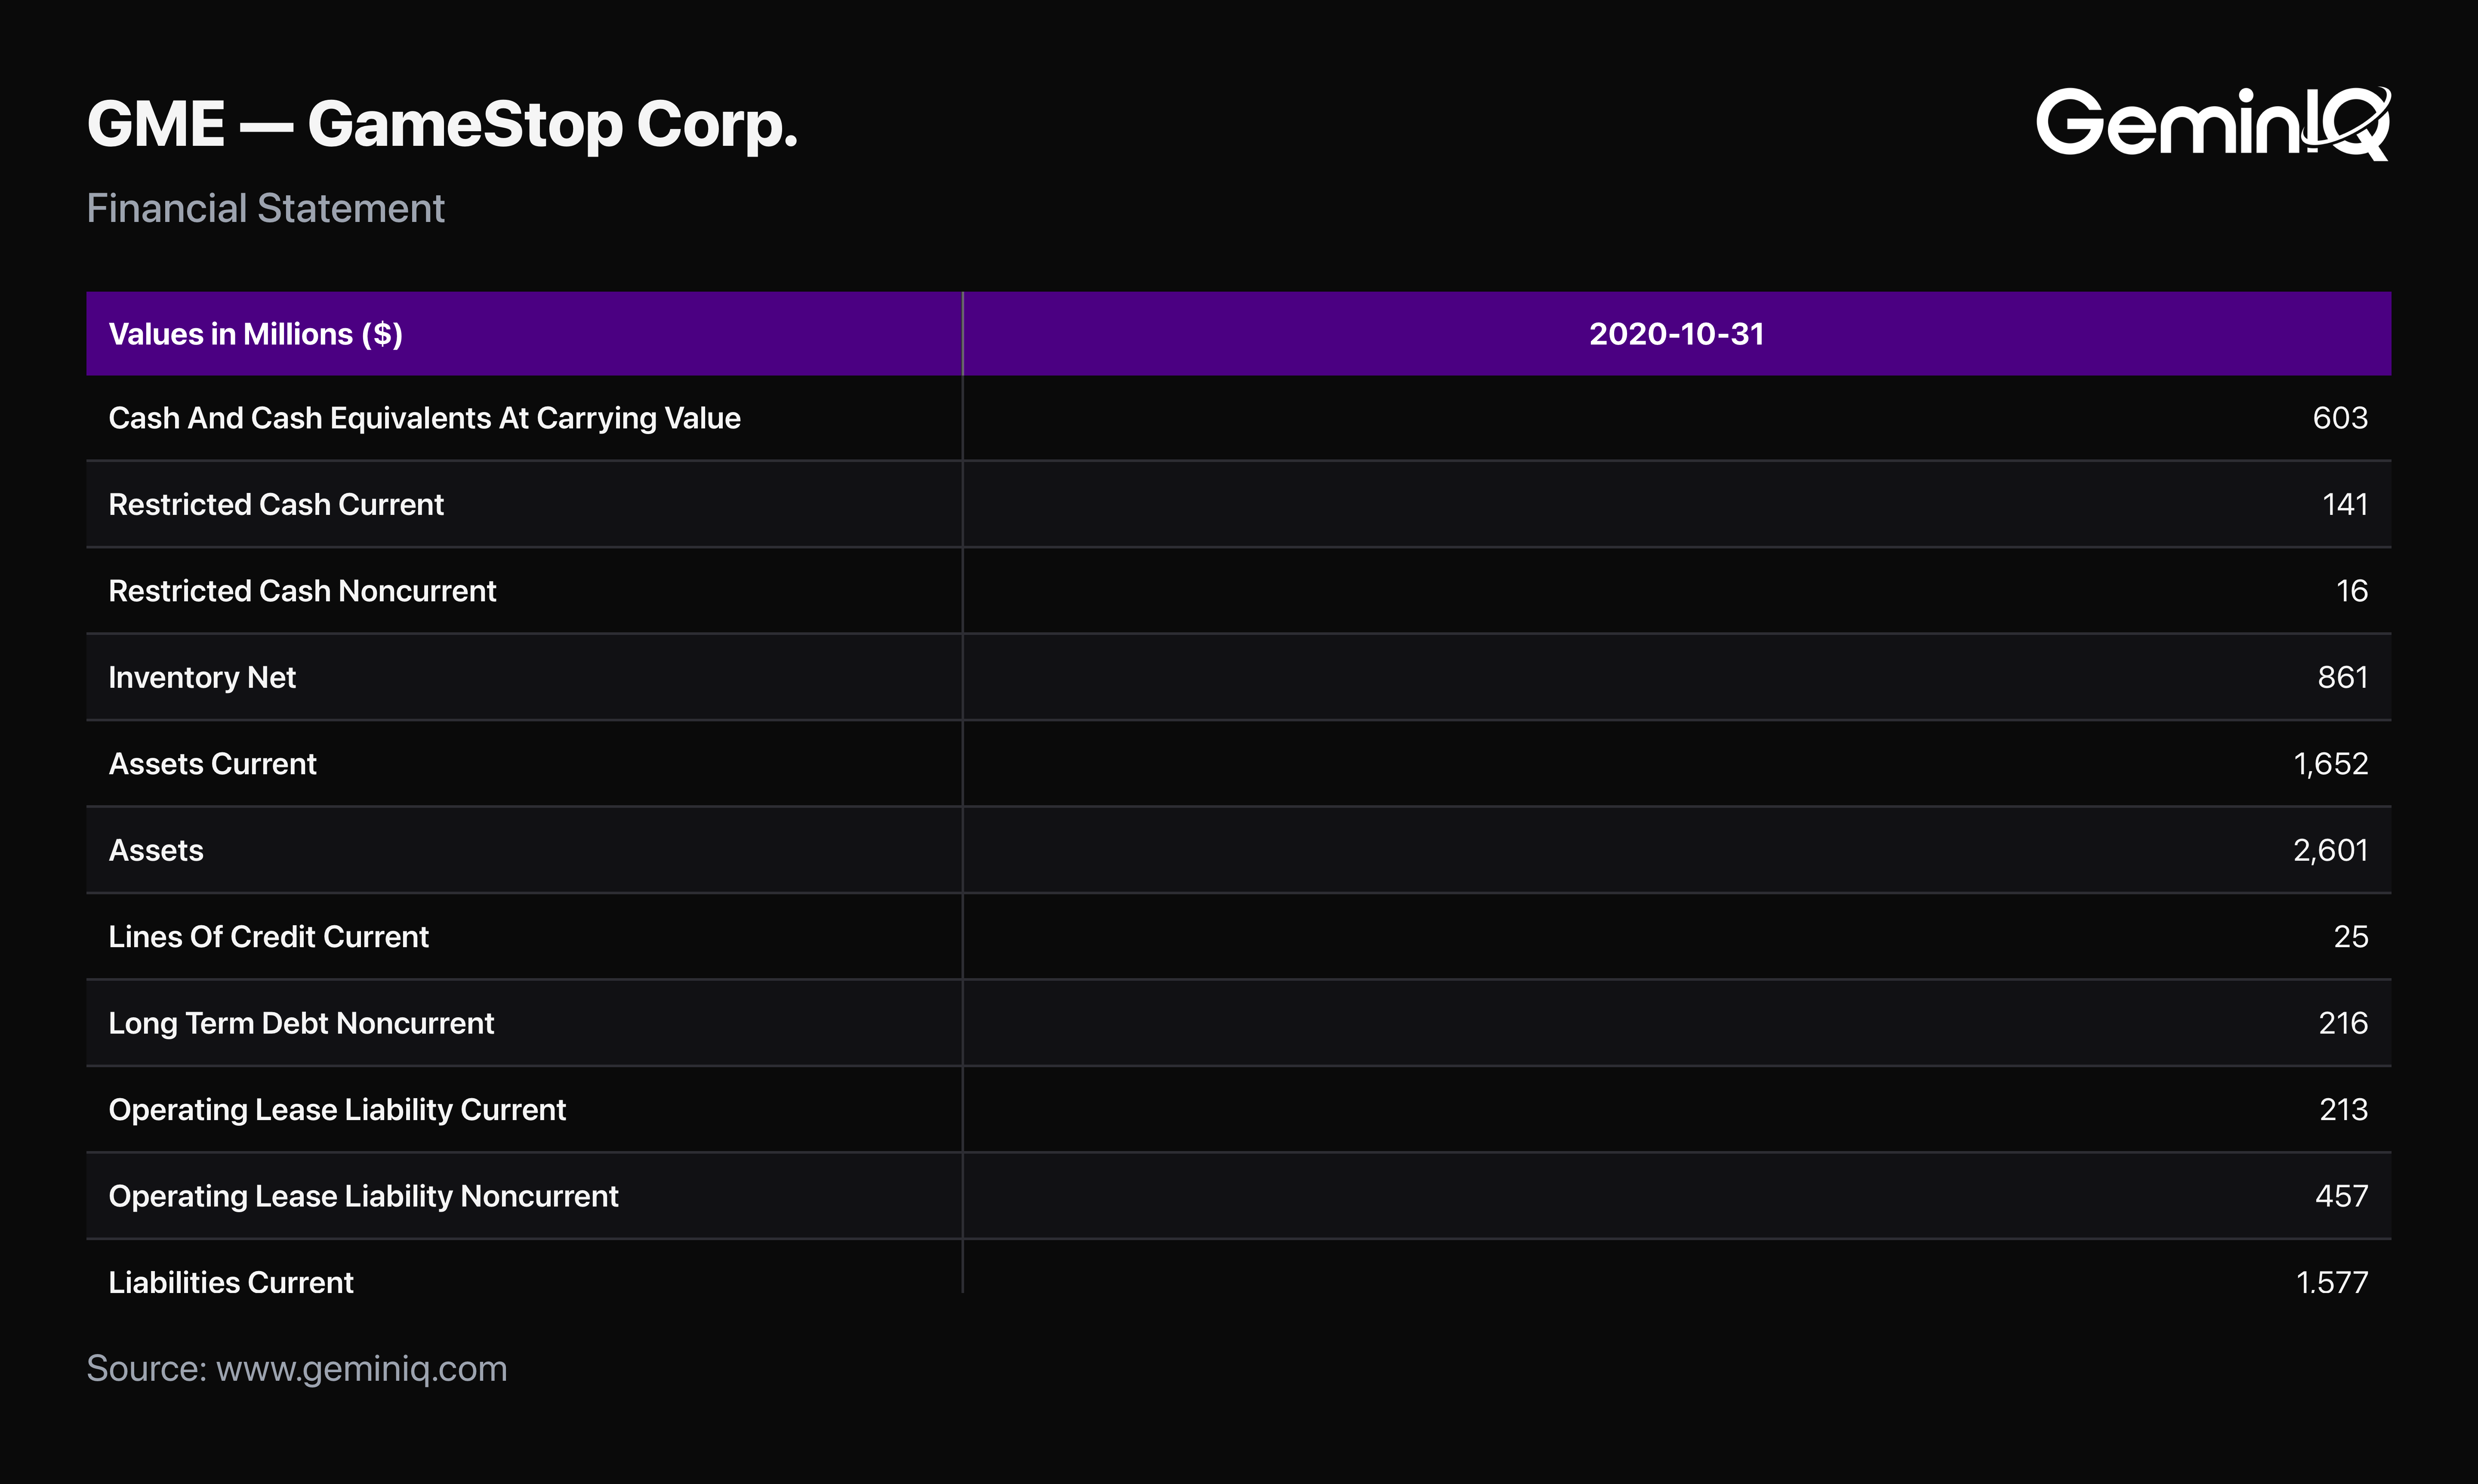
The 10-Q Filed December 8, 2020: $445.9 Million Cash Against $241.0 Million Debt
One document sits directly on the fault line. It was published seven weeks before the January move and it contained no surprises at all.
The Filing Data: The 10-Q for the quarter ended October 31, 2020, filed December 8, 2020, reported quarterly Revenues of $1,004.7 Million and an Operating Income Loss of -$63.0 Million against a Net Income Loss of -$18.8 Million. The balance sheet showed Cash And Cash Equivalents At Carrying Value of $445.9 Million, with a further $140.7 Million in Restricted Cash Current and $16.0 Million in Restricted Cash Noncurrent. Against that sat Lines Of Credit Current of $25.0 Million and Long Term Debt Noncurrent of $216.0 Million. Total Stockholders Equity was $332.2 Million and Inventory Net was $861.0 Million. GeminIQ's Net Debt for GameStop reads -$361.6 Million, a net cash position, and Free Cash Flow on a trailing basis was $149.5 Million.
The Signal: At that quarter's close the whole company was priced at $682.6 Million, with an Enterprise Value of $321.0 Million against trailing revenue of $5,161.8 Million and a Free Cash Flow Yield of 21.90%. The Current Ratio was 1.0477. Every one of those figures was published on December 8, 2020, in a document available to anyone with a browser. The filing did not predict what happened next and nothing in it could have. What it did do was describe a company holding more cash than debt, generating positive free cash flow, and priced as though neither were true.
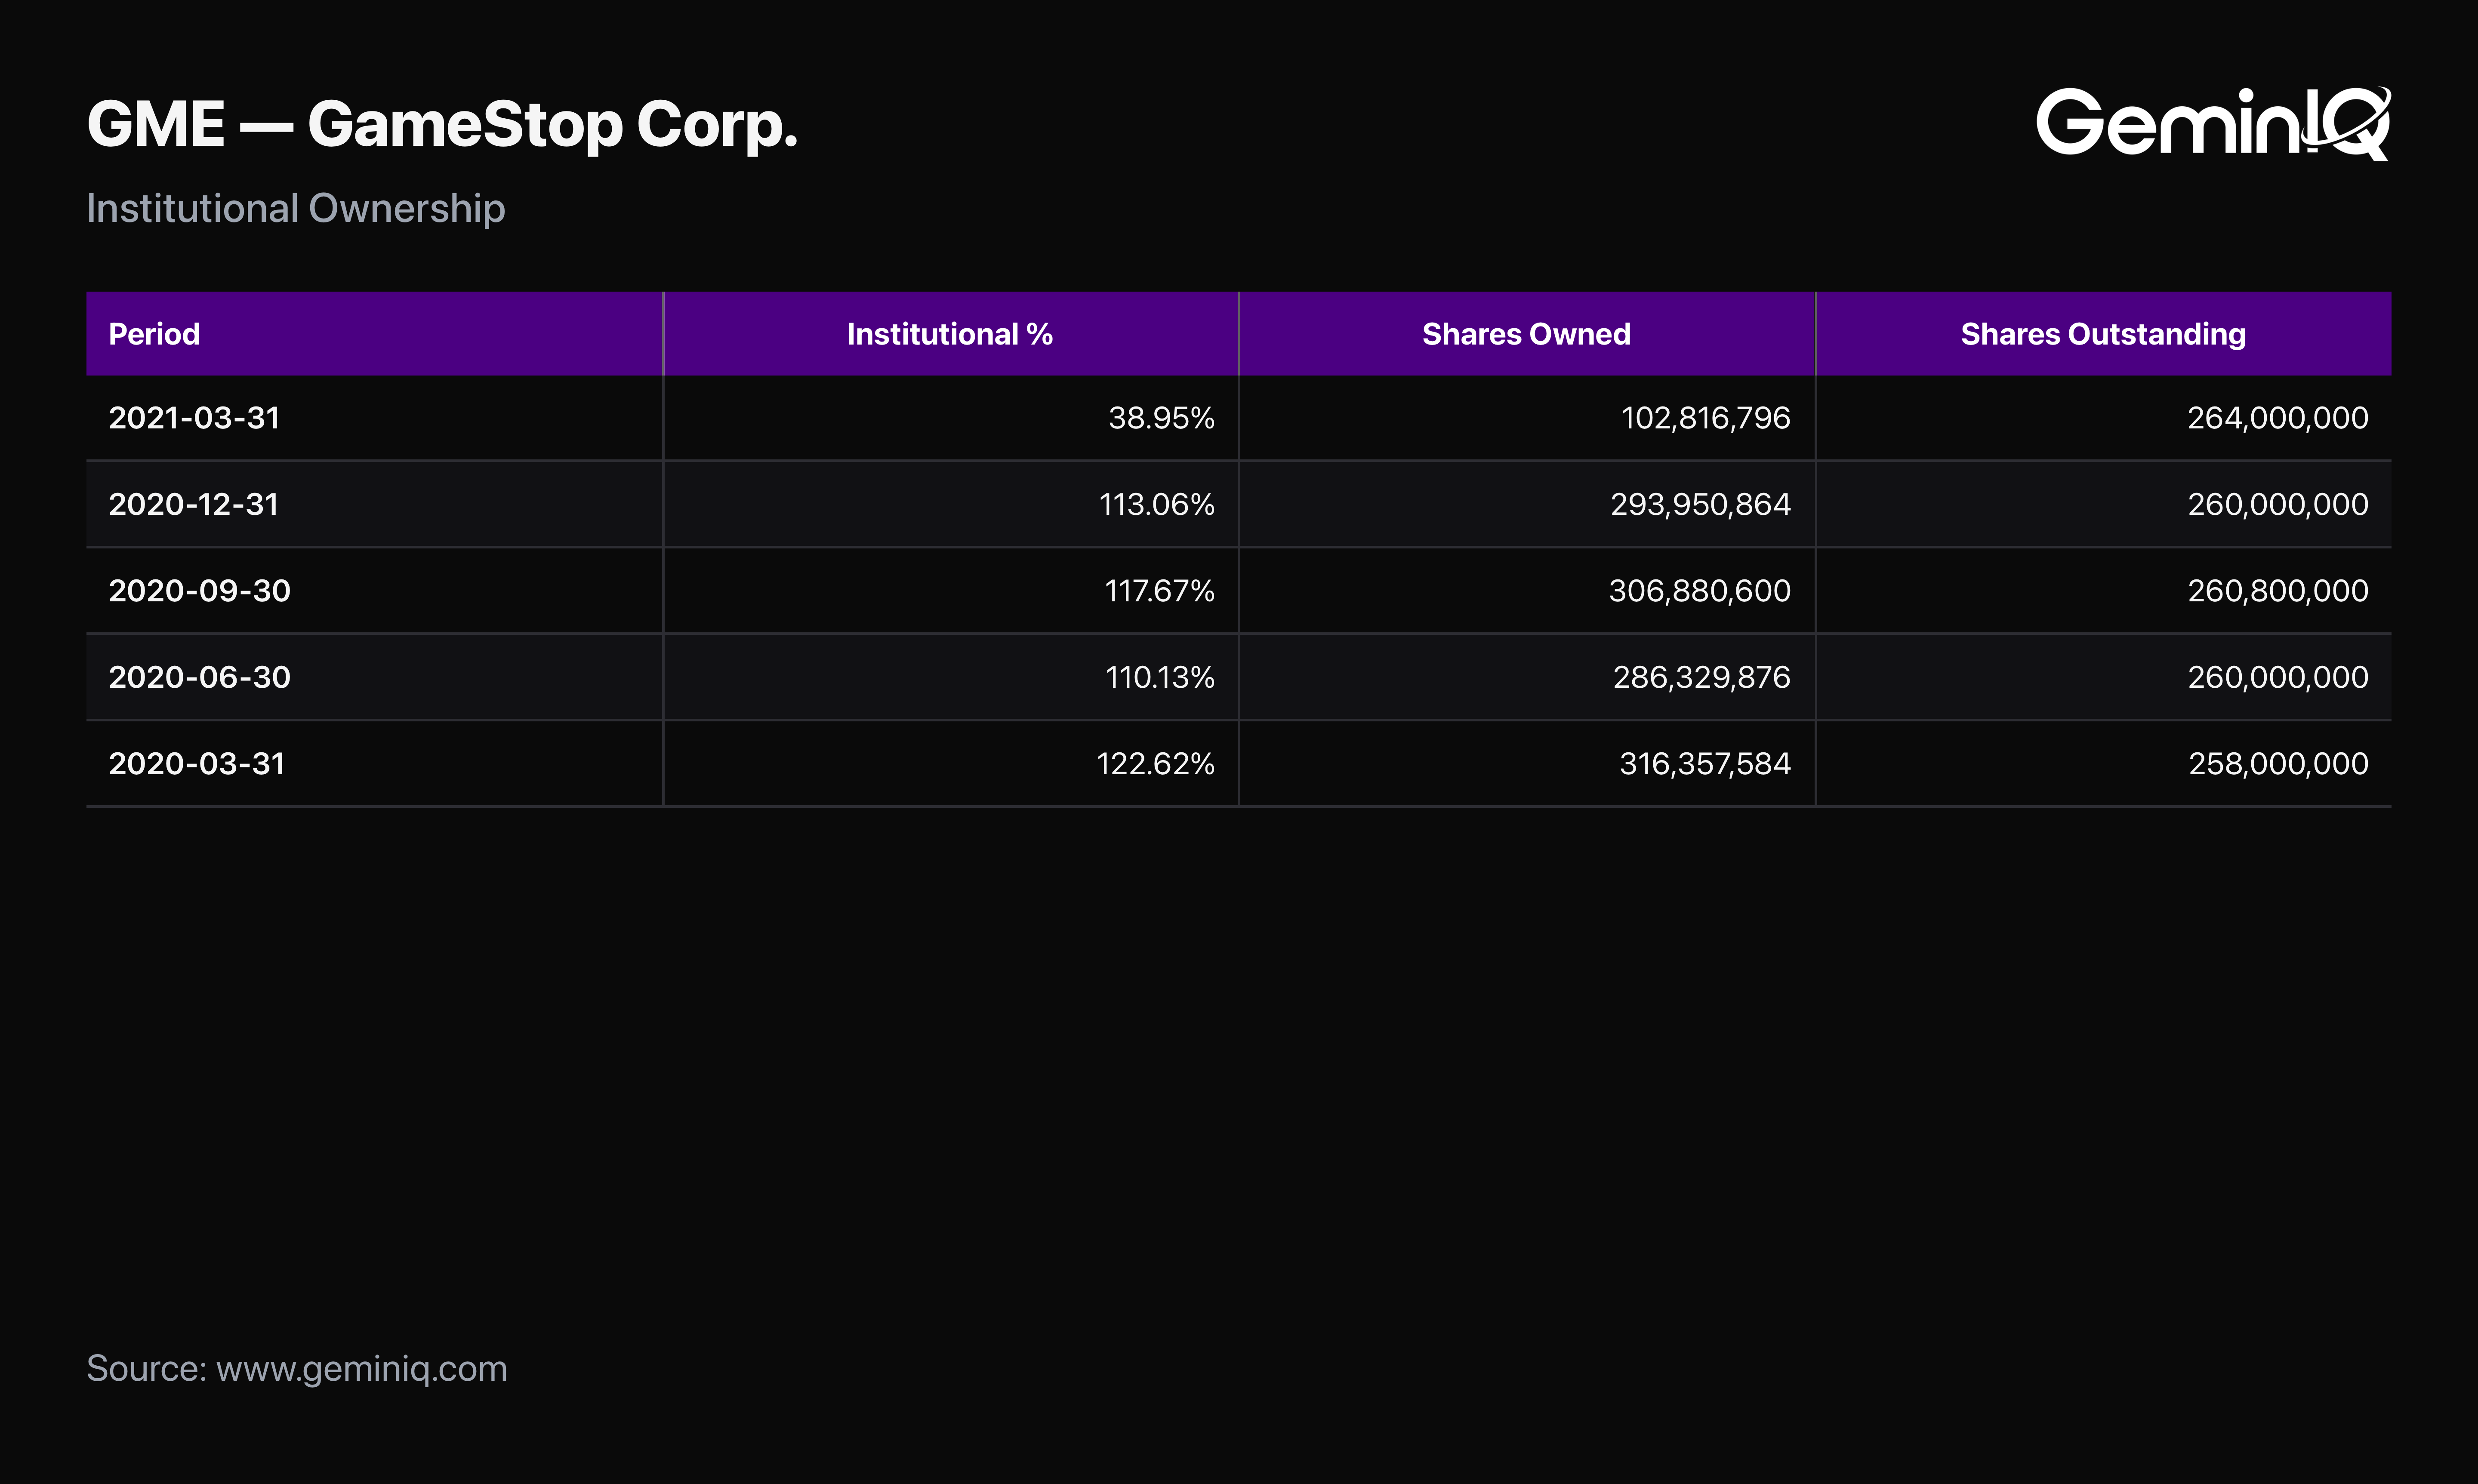
GameStop Institutional Ownership Read 122.62%, Over 100% for Four Straight Quarters
There is one filing-sourced number that speaks directly to the mechanics everyone argued about afterward, and it is not short interest, which does not exist in XBRL at all.
The Filing Data: GeminIQ's Institutional Ownership aggregate for GameStop reads 122.62% at March 2020, 110.13% at June 2020, 117.67% at September 2020, and 113.06% at December 2020. The underlying figures are 293,950,864 institutional shares reported at December 2020 against 260,000,000 shares outstanding. By March 2021 the reading falls to 38.95% on 102,816,796 reported shares.
The Signal: Aggregated 13F filings reported more GameStop shares than GameStop had issued, for four consecutive quarters. That happens when shares are lent and both the lender and the buyer report holding them, so the aggregate double-counts. One caution governs the reading: 13F data is quarterly and arrives with a filing lag of up to 45 days, so it was never live, and the March 2021 collapse describes positions already weeks old when published. Most platforms cap the figure at 100% or quietly normalize it away. GeminIQ shows what the filings add up to, because four consecutive quarters above 100% is a structural fact about who held the stock, not a rounding artifact to be tidied.
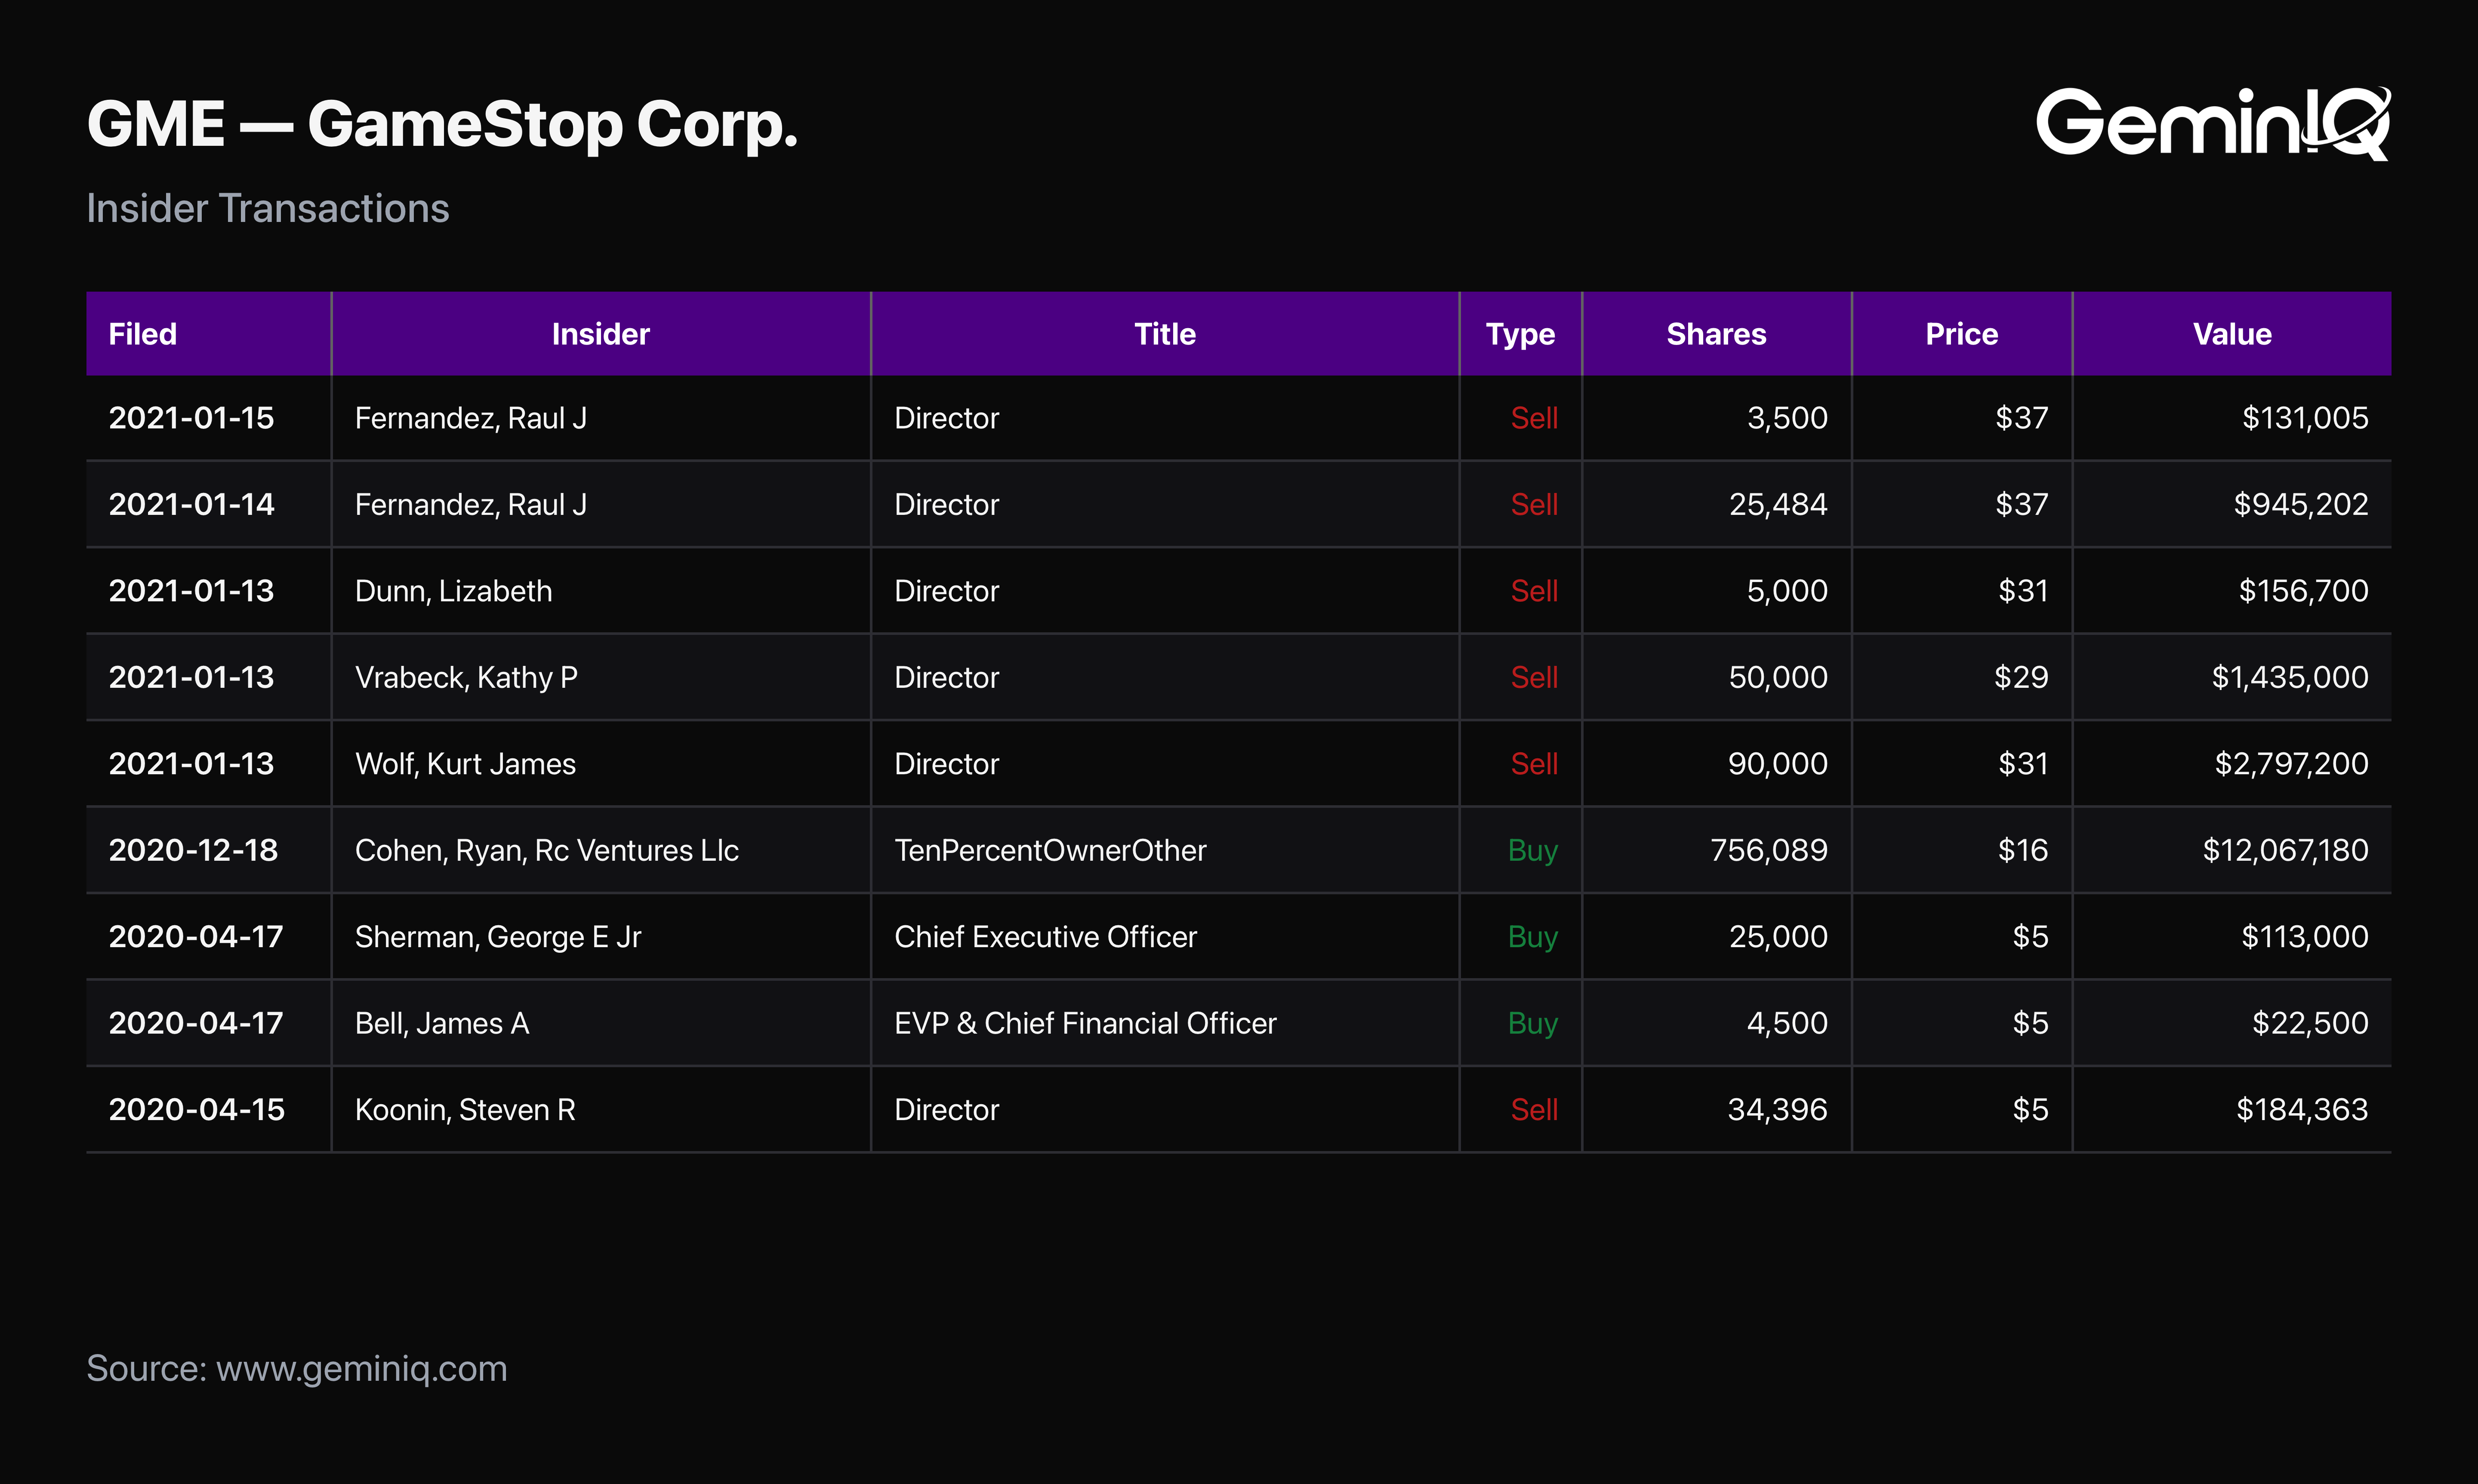
Ryan Cohen's RC Ventures Bought 1,226,400 Shares in December 2020
What are the people actually running the company doing with their own money? For a five-week stretch spanning December 2020 and January 2021, the Form 4 record answers in two opposite directions.
The Filing Data: On December 17 and 18, 2020, RC Ventures LLC, Ryan Cohen's investment vehicle, filing as a ten percent owner, purchased 470,311 shares at $14.77 and 756,089 shares at $15.96 — 1,226,400 shares for $19.01 Million, carrying the reported position to 9,001,000 shares. Between January 12 and January 15, 2021, four directors filed seven sale records totaling 903,119 shares for $20.16 Million, at prices from $19.99 to $37.43. Across all of 2019 and 2020, the only other purchases in the record are six small director buys in September 2019 totaling $0.48 Million at $4.62 to $5.38, and buys by the Chief Executive Officer and Chief Financial Officer in April 2020 totaling $0.14 Million.
The Signal: Form 4 prices are as filed and predate the July 2022 four-for-one split, so the $14.77 purchase corresponds to roughly $3.69 on GeminIQ's adjusted price series (derived). The largest committed buyer and the sitting board moved in opposite directions inside five weeks, and both are visible in the raw feed with the transaction code on every line rather than collapsed into a single sentiment score. Ownership disclosures land with a lag and are never a live read, which makes this a hook rather than a trigger. The hook sends you back to the balance sheet, which is where the argument always was.
Post-Filing Returns: +861.85% Twelve Months After the March 2020 10-K
The filings were followed by price behavior that bears no proportion to the news inside them, and the sequence is the point.
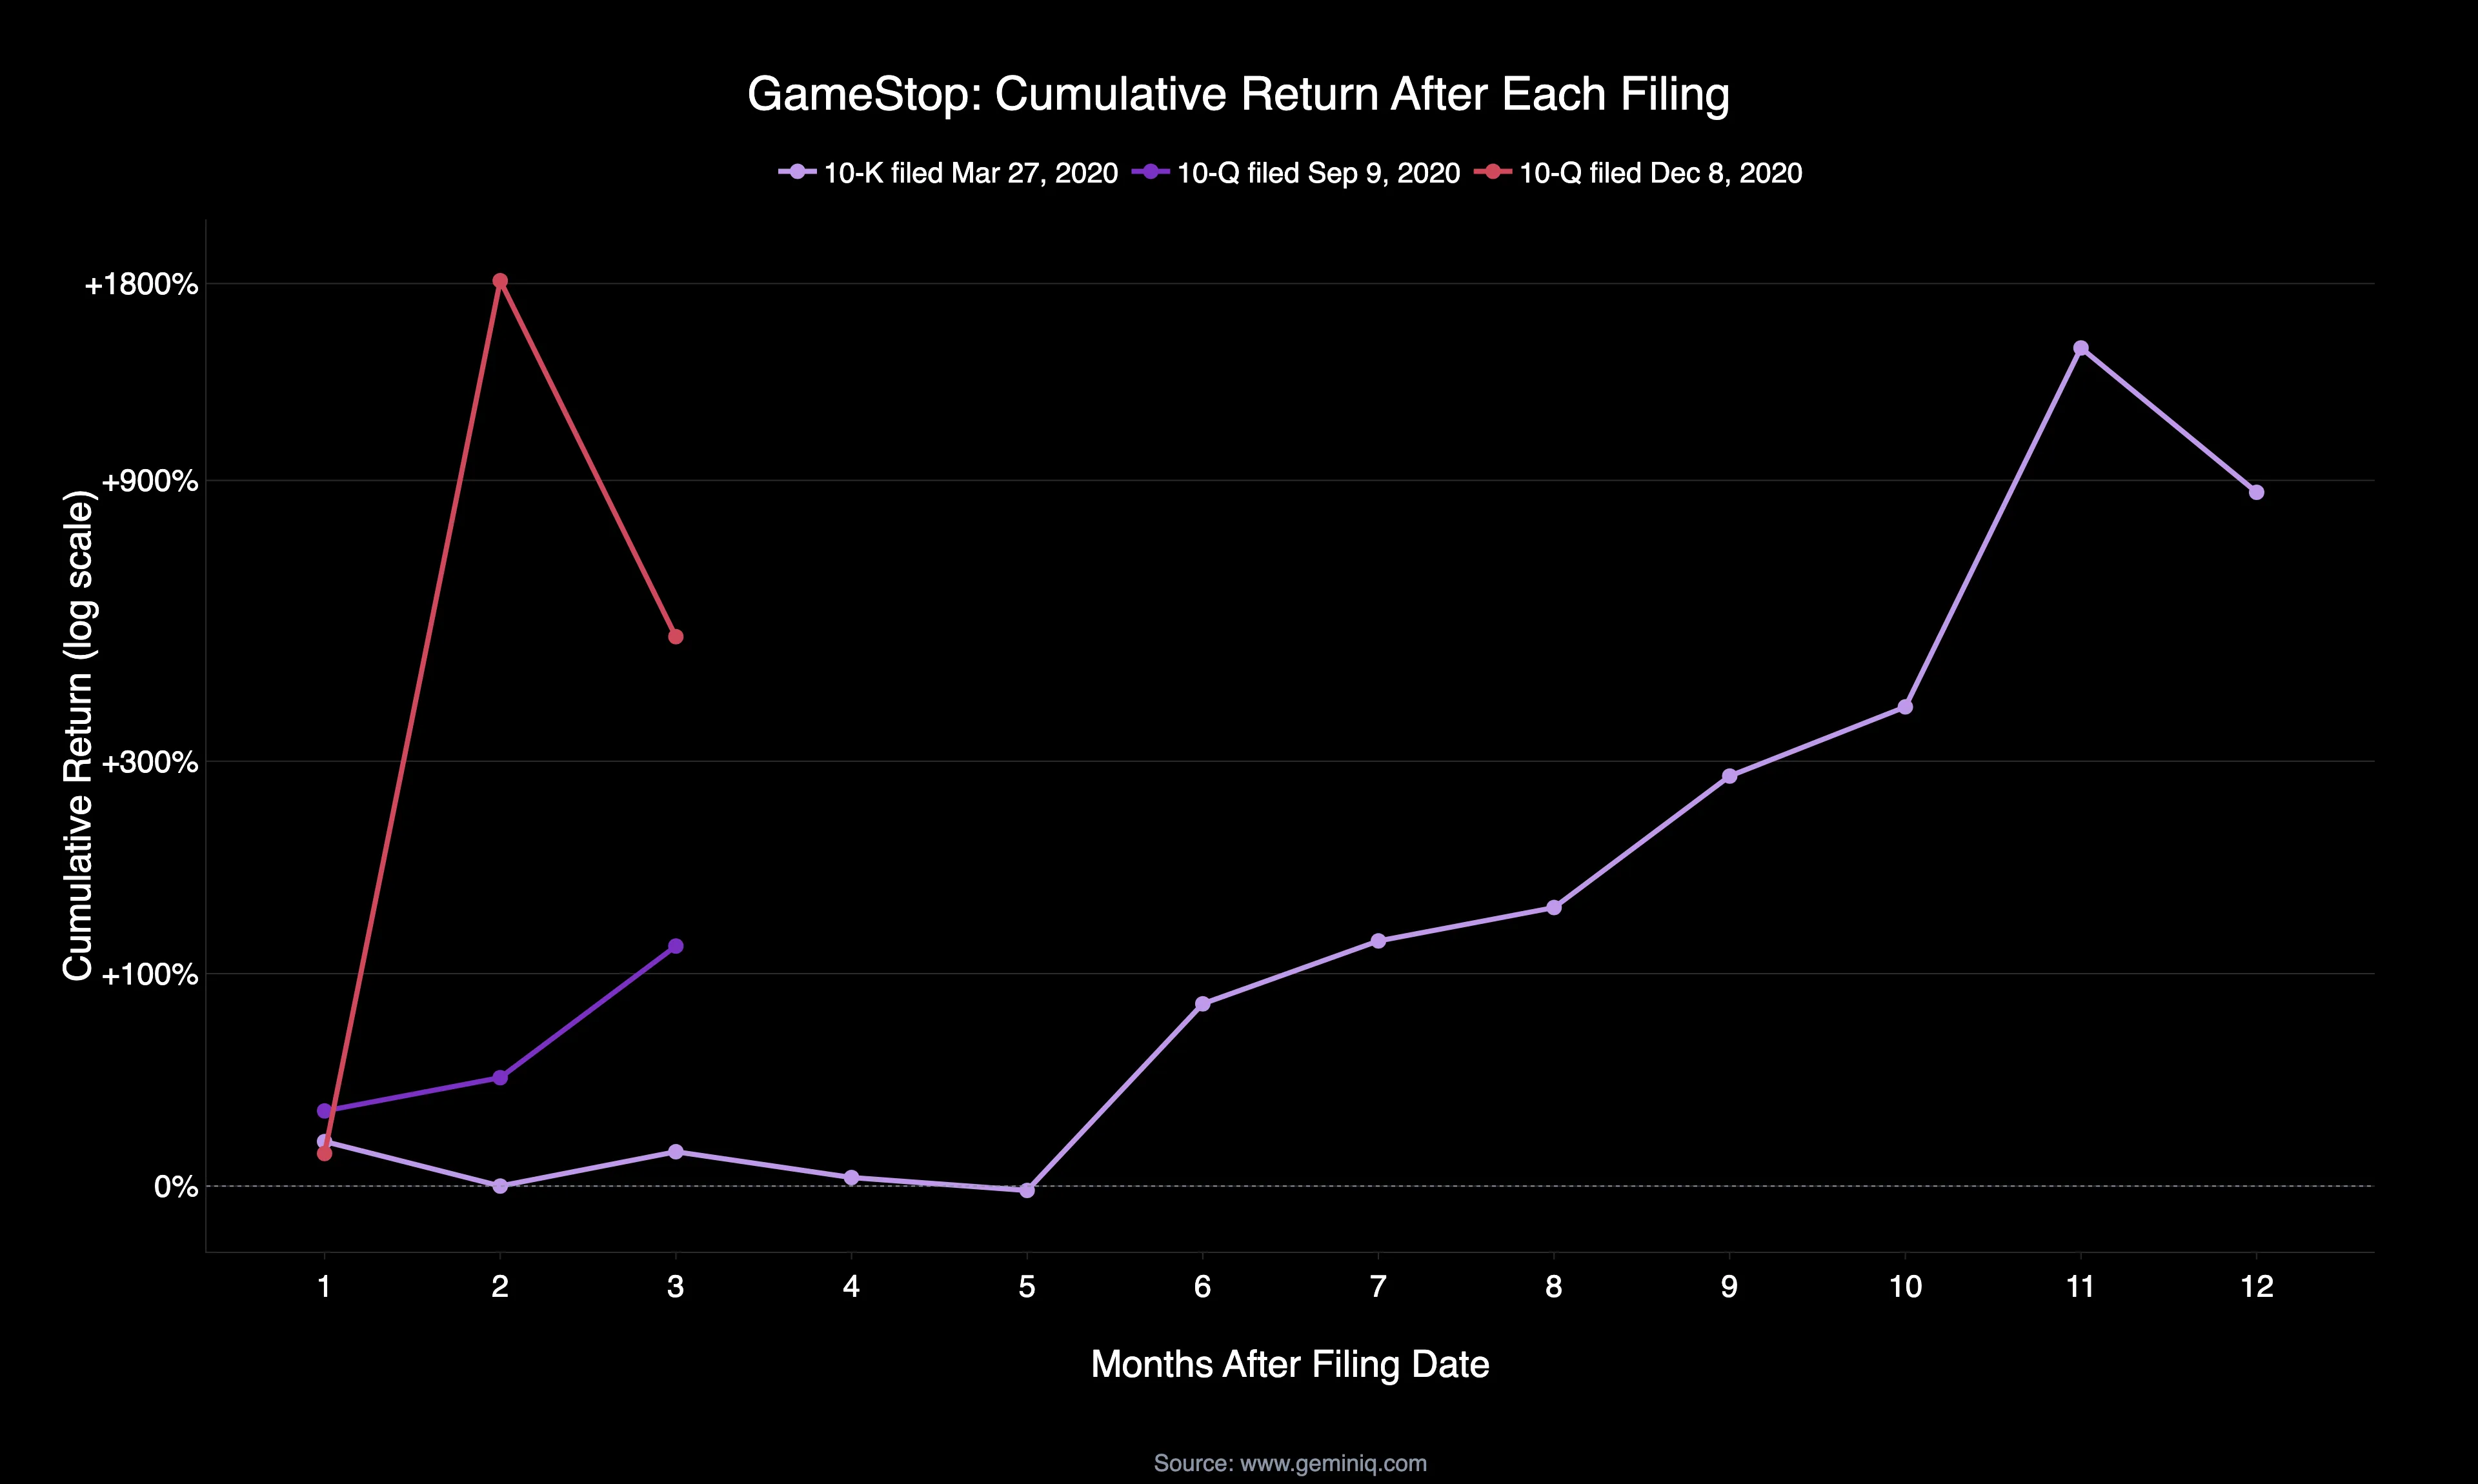
The Filing Data: The 10-K filed March 27, 2020 — the annual report carrying a $470.9 Million net loss and goodwill written to zero — was followed by cumulative returns of +15.64% at one month, +11.85% at three, and -1.42% at five. Then the curve breaks: +81.28% at six months, +281.04% at nine, and +861.85% at twelve. The 10-Q filed September 9, 2020 was followed by +27.76%, +42.45%, and +118.78%. The 10-Q filed December 8, 2020 was followed by +11.22% at one month and +1,818.54% at two (the late-January 2021 peak falls inside that two-month window), settling to +500.59% at three. The next annual report, filed March 23, 2021, was followed by -33.13% over twelve months.
The Signal: These are cumulative figures from each filing date, and they are historical associations for one company across a small number of filings — not a base rate, not a forecast, and not evidence that any filing caused anything. What the sequence establishes is timing. For five months after the worst annual report GameStop ever filed, the stock did approximately nothing. The balance sheet described in that document had already turned. The repricing arrived a full year later, and the twelve months after the market finally agreed produced -33.13%.
Three Filed Facts GameStop's 2020 Price Ignored
Three facts sat in public documents through the second half of 2020, and none of them required a thesis about anything.
Total debt had fallen from $820.8 Million to $241.0 Million, a 70.6% reduction disclosed across eight consecutive filings. Enterprise Value had gone negative, reading -$247.0 Million at the July 2020 quarter close, when $735.1 Million of cash stood against a $260.7 Million market capitalization. And the Altman Z-Score, computed from five filed inputs, had never once entered the distress zone, bottoming at 1.9755 while the equity traded at 0.0466 times sales.
Against that, the retailer was still shrinking in fact, not just in narrative. Revenue fell 40.9% in four years, equity fell from $2,254.1 Million to $436.7 Million, and goodwill went to zero. Both descriptions are accurate, and the market had committed to only one of them. The filings never said GameStop was a good business. They said it was a shrinking business that could pay its bills, and it was priced as a business that could not. That gap was published, timestamped, and free, in a 10-Q filed on December 8, 2020.
Check Your Holdings
The calculation that flagged this takes three filed numbers and no forecast. Pull a company's market capitalization, add its total debt from the individually filed balance sheet lines rather than a single summary figure, and subtract cash and cash equivalents. The result is enterprise value — what the market is charging for the operating business after the cash and the borrowings net out. When that number approaches zero or goes below it, the market is pricing the business itself at nothing, and the claim is precise enough to check.
Then divide trailing free cash flow by market capitalization. A company with a negative enterprise value and positive free cash flow is a specific and rare configuration, and it is the one GameStop occupied at the July 2020 quarter close. In GeminIQ, both figures already sit in the same Calculated Metrics table as Enterprise Value and Free Cash Flow Yield, computed across a company's full filing history rather than the most recent quarter. Sort by period end and read down the two columns together. Where they diverge, the market and the balance sheet are telling different stories, and only one of them is sourced.
Frequently Asked Questions
What was GameStop's enterprise value in 2020?
Negative. At the July 31, 2020 quarter close, GeminIQ's Enterprise Value for GameStop reads -$247.0 Million. It is computed from figures in the 10-Q filed September 9, 2020: a market capitalization of $260.7 Million plus total debt of $250.9 Million, less Cash And Cash Equivalents At Carrying Value of $735.1 Million, Restricted Cash Current of $11.0 Million and Restricted Cash Noncurrent of $12.5 Million. By the October 2020 quarter close the reading was positive again at $321.0 Million.
Why did GameStop's institutional ownership read over 100%?
Because aggregated 13F filings reported more GameStop shares than GameStop had issued. GeminIQ's Institutional Ownership aggregate reads 122.62% at March 2020, 110.13% at June 2020, 117.67% at September 2020 and 113.06% at December 2020 — 293,950,864 institutional shares reported at December 2020 against 260,000,000 shares outstanding. That happens when shares are lent and both the lender and the buyer report holding them, so the aggregate double-counts. 13F data is quarterly and arrives with a filing lag of up to 45 days, so it was never a live read.
Was GameStop actually at risk of bankruptcy in 2020?
The standard academic measure of bankruptcy risk did not say so. GeminIQ's Altman Z-Score for GameStop bottomed at 1.9755 in July 2019 and never crossed the conventional distress threshold of 1.81, spending the window in the grey zone that runs from 1.81 to 2.99. The Z-Score is not a forecast and a grey-zone reading is not an all-clear — it is a statement that the five filed inputs did not combine into a distress signature. The underlying business was contracting for real: revenue fell 40.9% in four years and goodwill went to $0.0 Million.
How much debt did GameStop pay off before the squeeze?
$579.8 Million, or 70.6% of the peak. Total debt fell from $820.8 Million at January 31, 2019 — Long Term Debt Current of $349.2 Million plus Long Term Notes Payable of $471.6 Million — to $241.0 Million at October 31, 2020, being Lines Of Credit Current of $25.0 Million and Long Term Debt Noncurrent of $216.0 Million. The cash flow statements show Repayments Of Long Term Debt of $404.5 Million in the year ended January 2020 and a further $130.3 Million the year after. Operating lease liabilities of $212.9 Million current and $456.7 Million noncurrent sat alongside and were larger than the borrowings.
What did GameStop's last balance sheet before January 2021 show?
The 10-Q for the quarter ended October 31, 2020, filed December 8, 2020, reported Cash And Cash Equivalents At Carrying Value of $445.9 Million, Restricted Cash Current of $140.7 Million and Restricted Cash Noncurrent of $16.0 Million, against Lines Of Credit Current of $25.0 Million and Long Term Debt Noncurrent of $216.0 Million. Total Stockholders Equity was $332.2 Million, Inventory Net was $861.0 Million, and the Current Ratio was 1.0477. GeminIQ's Net Debt reads -$361.6 Million — a net cash position — with trailing Free Cash Flow of $149.5 Million.
Wall Street's data. Main Street's price.
Institutional terminals charge thousands a year for as-filed accuracy. GeminIQ gives you the same thing for a fraction of the cost: financials built directly from raw SEC EDGAR filings, not third-party APIs, with full XBRL traceability back to the original 10-K or 10-Q. No normalized guesswork, just calculated metrics, charts, screeners, and watchlists built on numbers exactly as the company reported them. Start researching now at GeminIQ.com.
All financial figures in this article are drawn from GameStop Corp.'s 10-K and 10-Q filings, filed April 2018 through March 2022 and publicly available on SEC EDGAR. Insider figures are drawn from Form 4 filings and institutional figures from aggregated Form 13F filings over the same period.
Disclaimer: The content in this blog is for educational and entertainment purposes only and does not constitute financial, legal, or tax advice. Investing involves risk, including the loss of principal. The views expressed are my own and not intended as financial advice or a guarantee of future performance.