GM Q3 2026 Earnings: EPS Up 176%, Adjusted EPS Up 32%

By Chad Hartman
Published · Last updated
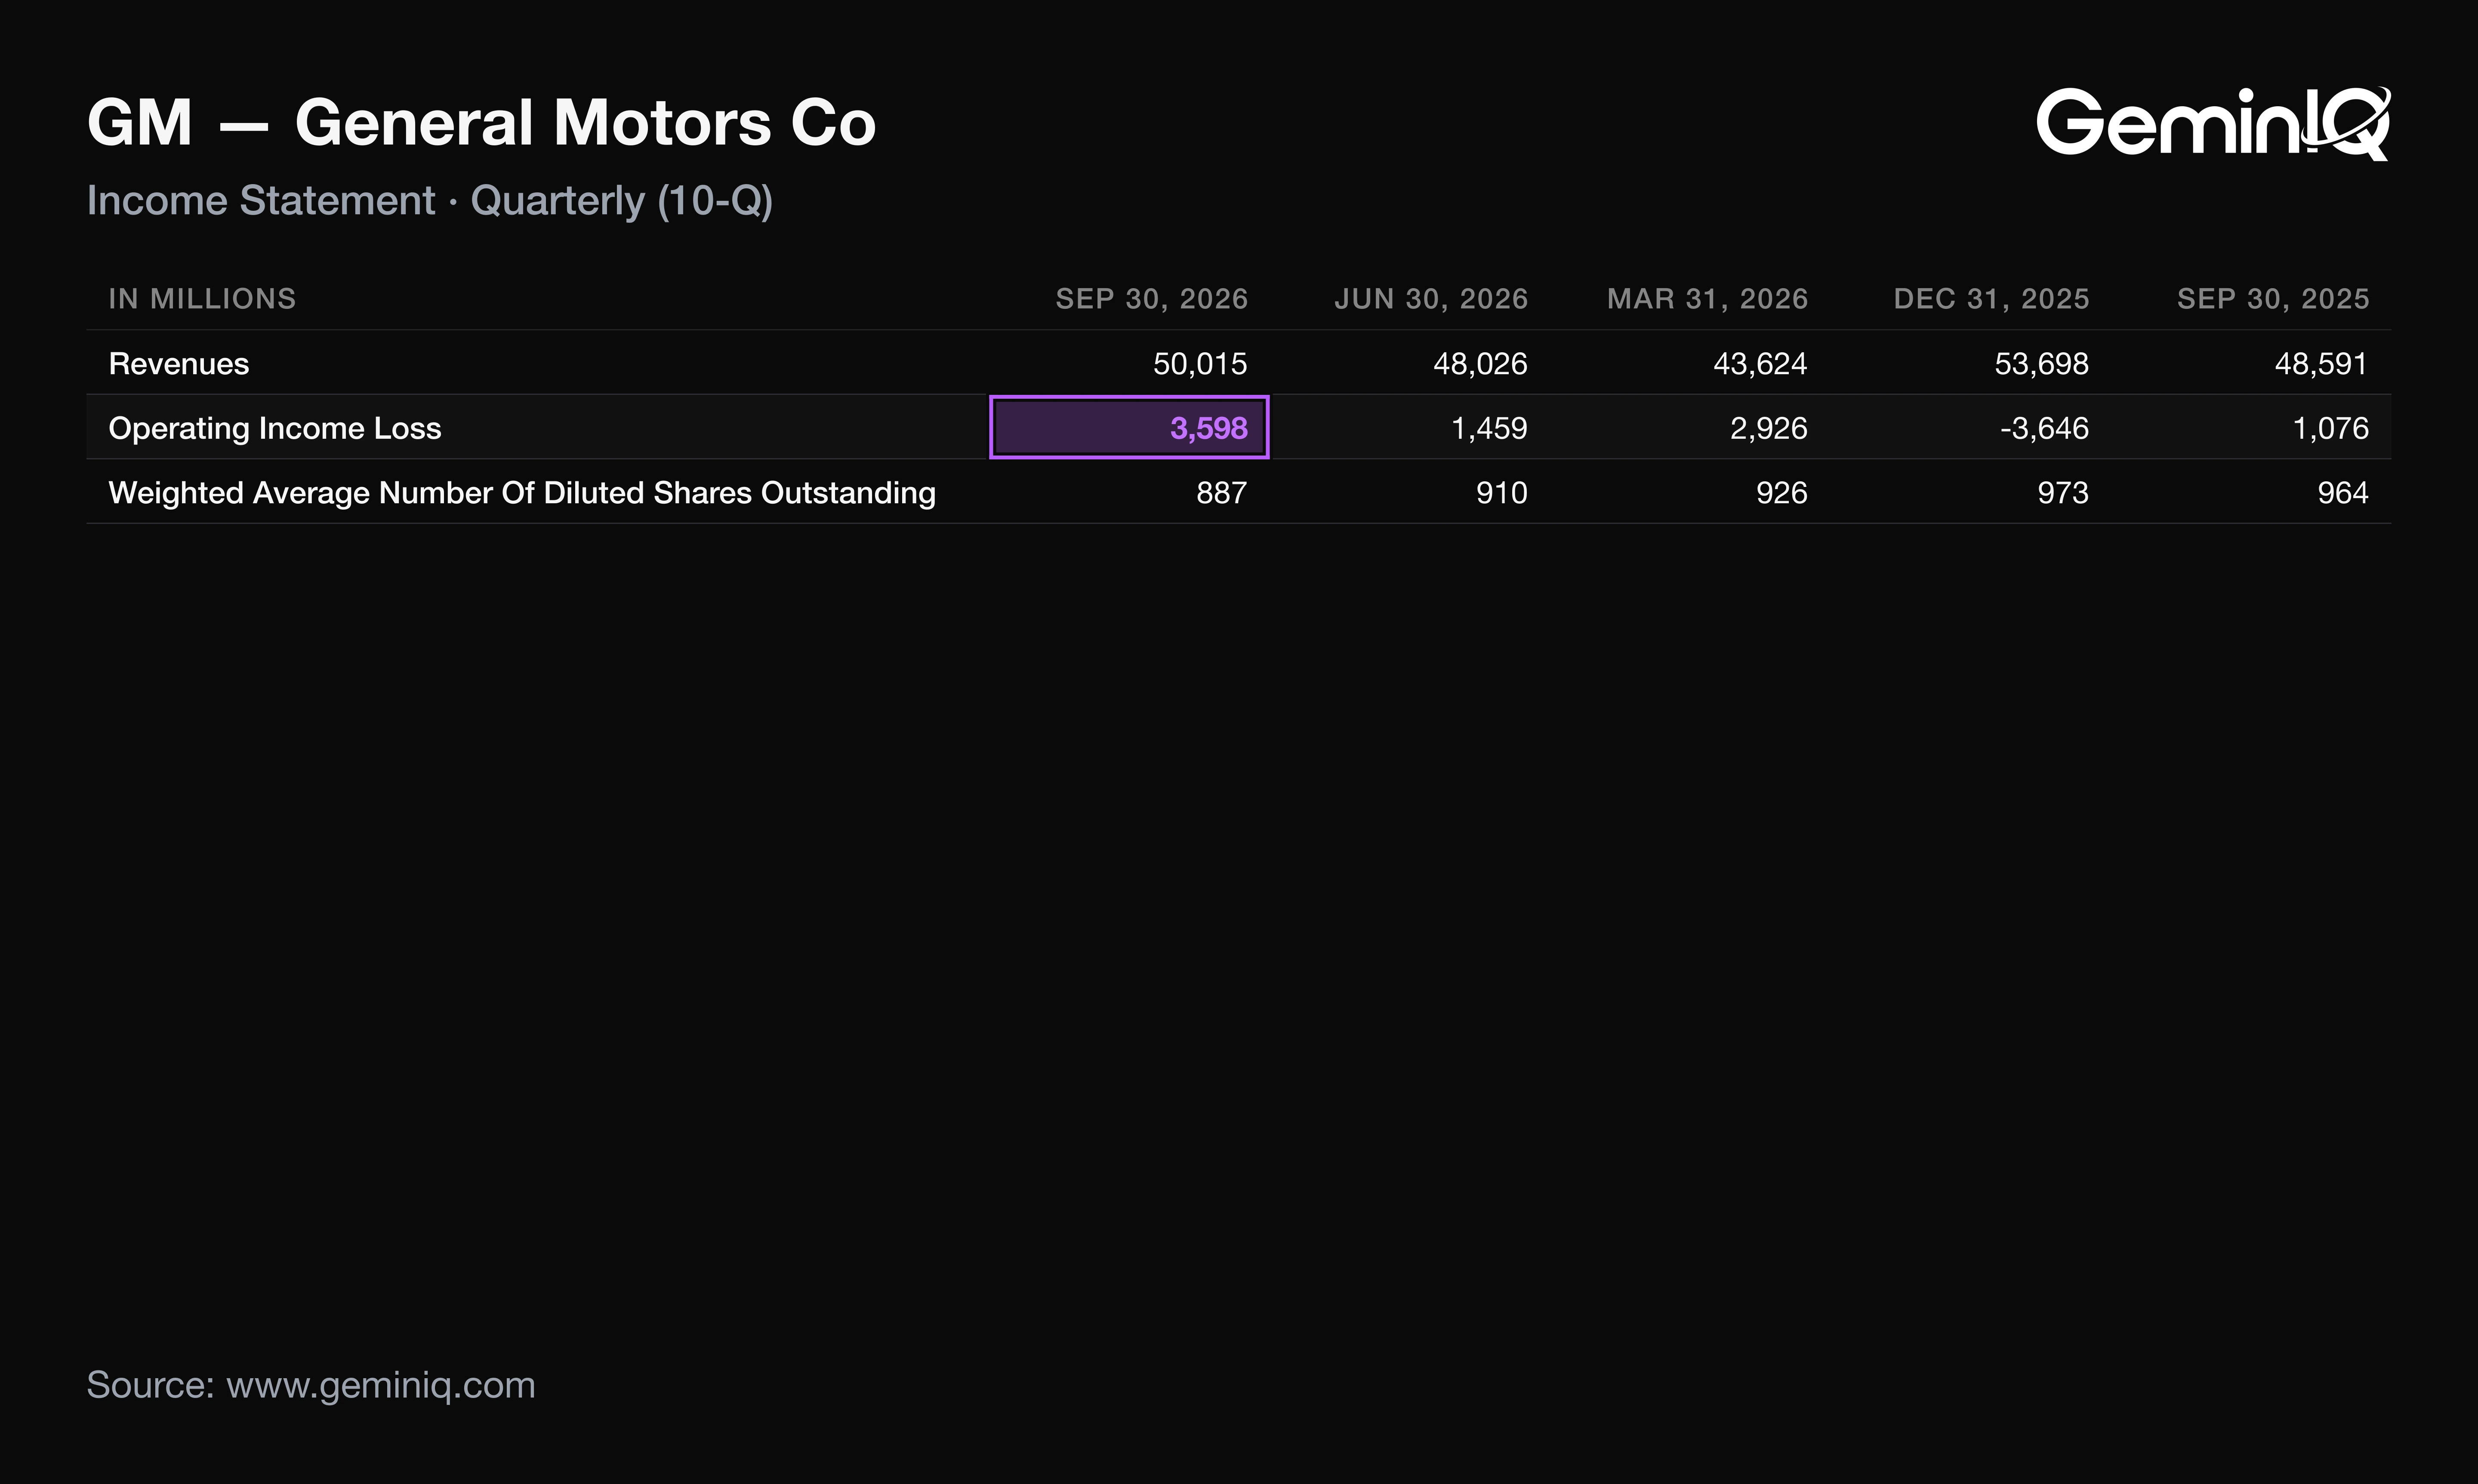
GM (NYSE: GM) reported third-quarter 2026 revenue of $50.02 billion, up 2.9% from a year earlier, and diluted EPS of $3.73, up 176.3%, for the quarter ended September 30, 2026. It released results on October 20, 2026 and filed its 10-Q the same day. Revenue barely moved, so the EPS gain came from the cost line: operating income rose 234.4% to $3.60 billion because the year-ago quarter carried charges this one did not, and the 8-K's own adjusted EPS rose only 32.2%.
| Field | Value |
|---|---|
| Company | GM ($GM) |
| Quarter | Q3 FY2026, period ended September 30, 2026 |
| Earnings release | October 20, 2026 (Form 8-K) |
| 10-Q filed | October 20, 2026 |
| Revenue | $50.02 Billion (+2.9% YoY) |
| Diluted EPS | $3.73 (+176.3% YoY) |
| Operating margin | 7.2% (+5.0 pts YoY) |
| Operating cash flow (TTM) | $23.41 Billion |
| Operating income | $3.60 Billion (+234.4% YoY) |
GM Q3 2026 Revenue, Diluted EPS and Operating Margin
GM's Q3 2026 diluted EPS was $3.73, up from $1.35, on revenue that grew only $1.42 billion. A reader who saw the EPS headline would expect a sales surge. Instead revenue was the third-highest of the last 16 quarters yet barely above last year's.
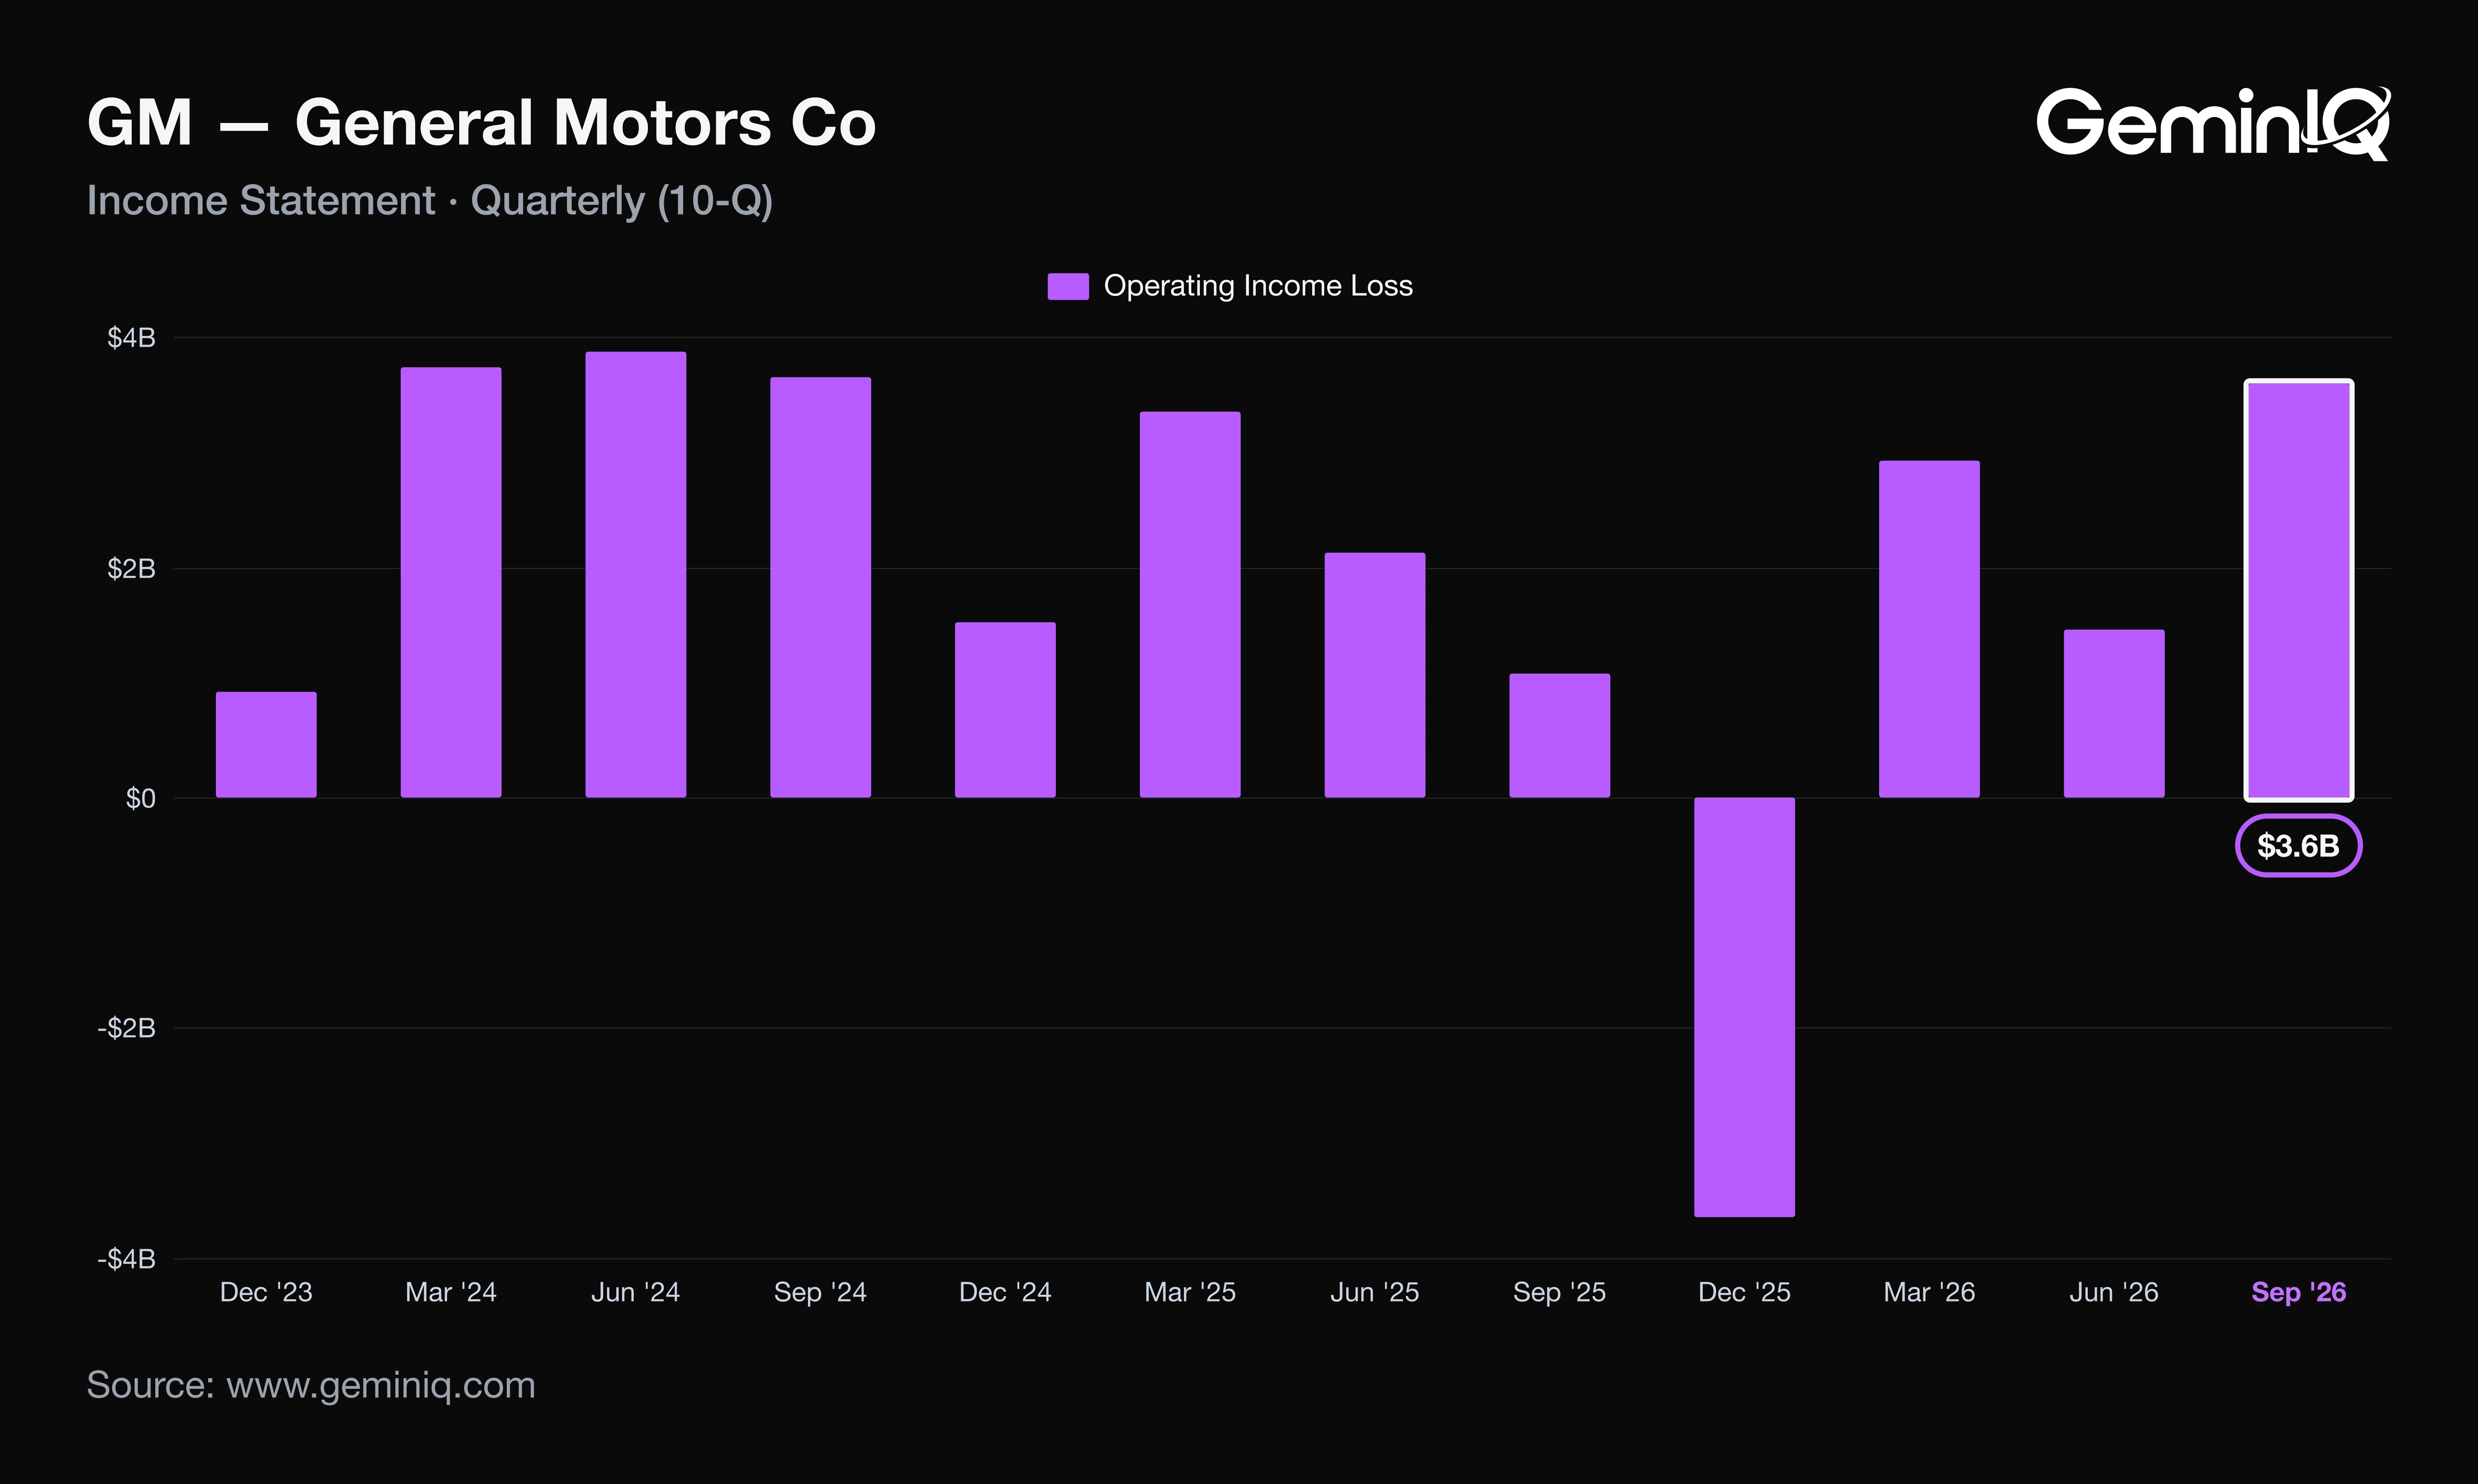
The Data: Operating income rose to $3.60 billion from $1.08 billion, and operating margin reached 7.2% from 2.2%, the fifth-highest of the last 16 quarters. Diluted shares fell 8.0% to 887 million, the lowest of the last 62 quarters.
Why: The lower share count supplies about $0.30 of the $2.38 EPS gain. At last year's 964 million diluted shares, the 8-K's $3.305 billion of net income to common stockholders would have produced $3.43, not $3.73. The other $2.08 is profit, and the 10-Q locates it in cost of sales.
What GM's Q3 2026 10-Q Shows Beyond the Press Release
The 8-K led with EBIT-adjusted of $4,106 million, up 21.6% from $3,376 million, a $730 million gain. GAAP operating income in the 10-Q rose $2.52 billion over the same year. The 21.6% is the better guide to what changed.
The Data: The 10-Q's MD&A attributes lower cost of sales to four items: $1.5 billion less in EV realignment charges, $0.9 billion less in warranty costs, $0.5 billion less in inventory net realizable value adjustments, and $0.3 billion from the absence of last year's OnStar Smart Driver charges. Those sum to $3.2 billion (derived), more than the whole operating income gain. Lower Ultium equity earnings, engineering and manufacturing costs offset part of it, for net favorable Cost of $2.1 billion.
Why: The year-ago quarter was the abnormal one. Management attributes the gain mainly to charges and warranty items that were large in Q3 2025 and small in Q3 2026, so the 234.4% measures a depressed base. Underneath, North America improved: GMNA EBIT-adjusted rose 43.4% to $3,592 million, a margin of 8.7% against the 8.0-10.0% sustained target the MD&A names. GMI fell 87.7% to $28 million. The 10-Q does not say whether the $0.9 billion warranty decline is a one-time reversal or a durable level, and warranty is the only item of the four that could repeat.
Measured from the adjusted line, GM's quarter was a 22% improvement, not a 234% one.
GM Q3 2026 Free Cash Flow, Share Count and Buybacks
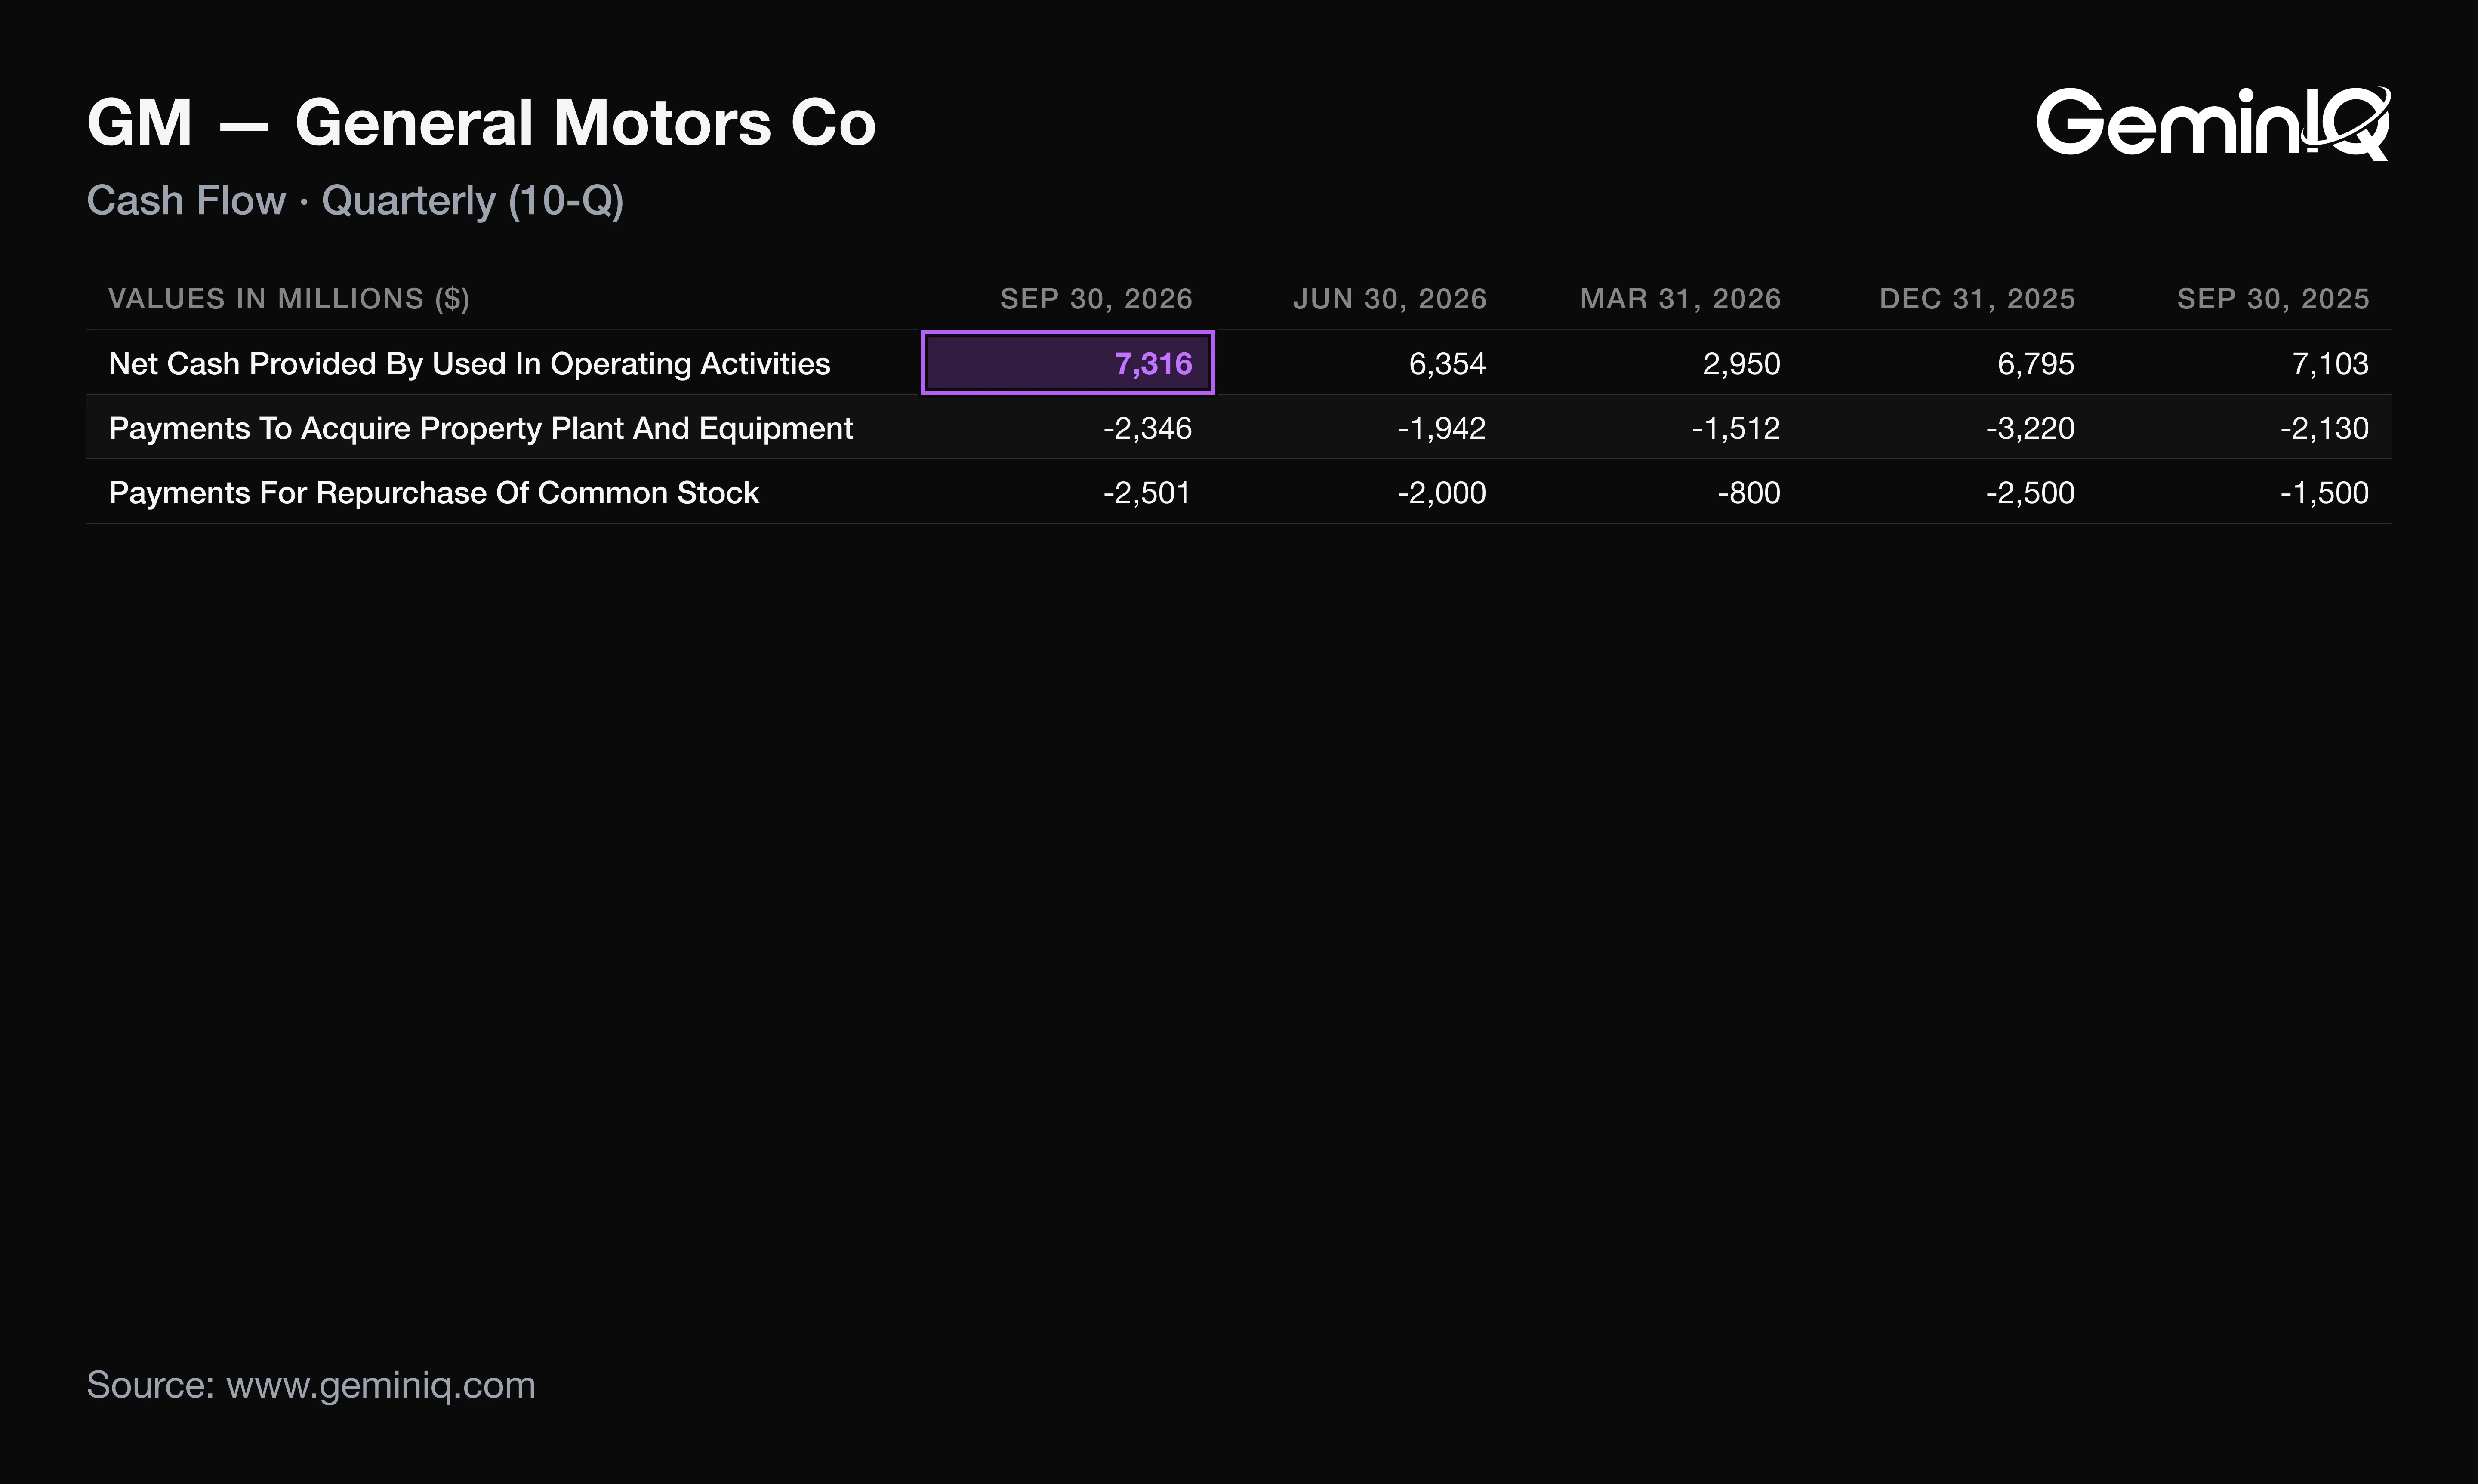
GM's Q3 2026 free cash flow, operating cash flow less capital expenditure, was $4.97 billion, down 0.1% from $4.97 billion a year earlier. The 8-K reports adjusted automotive free cash flow up 40.0%, so the two measures disagree on direction.
The Data: Operating cash flow was $7.32 billion, up 3.0% and the second-highest of the last 16 quarters, while capital expenditure rose 10.1% to $2.35 billion. GeminIQ's pre-calculated Free Cash Flow for the trailing year was $14.39 billion, down 3.4%. The 8-K's automotive operating cash flow was $8,049 million, up 32.6%.
Why: The 8-K measures cover the automotive segment and add back items its guidance reconciliation labels adjustments ($3.7 billion for 2026). The 10-Q statement consolidates GM Financial and adds nothing back. Cash is also paying for earlier charges: the restructuring reserve fell from $3.95 billion at the start of the year to $1.74 billion after $4.70 billion of payments in nine months, so reported cash flow absorbs charges the income statement booked earlier.
The share count did fall. The 10-Q shows 65 million shares repurchased for $5.3 billion in nine months, and the 8-K puts period-end shares at 849 million against 904 million at the end of 2025. That is 2.6% below Q3's 872 million basic average (derived), so Q4's average starts lower before any purchases under the new $20.0 billion authorization.
GM's 2026 Guidance After Q3
GM's 8-K narrowed full-year 2026 EBIT-adjusted guidance to $14.5-15.5 billion from $14.0-16.0 billion, leaving the $15.0 billion midpoint unchanged. It raised adjusted automotive free cash flow guidance to $11.5-12.5 billion from $9.5-11.5 billion.
The Data: The company guided EPS-diluted-adjusted of $12.75-13.75, from $12.00-14.00, a midpoint of $13.25 against $13.00. It guided EPS-diluted of $9.72-10.72, against $7.94 reported for the nine months. That implies fourth-quarter diluted EPS of $1.78-2.78 (derived), against $3.73 in Q3.
Why: The Q2 8-K raised EBIT-adjusted guidance for the second time this year; this one only tightened it. Q3 also included a $254 million gain on the sale of an equity method investment, disclosed in the 10-Q's equity-method note. The company's guidance excludes future special items, so the implied Q4 moves with any it records.
How GM Stock Has Moved After Past Earnings Reports
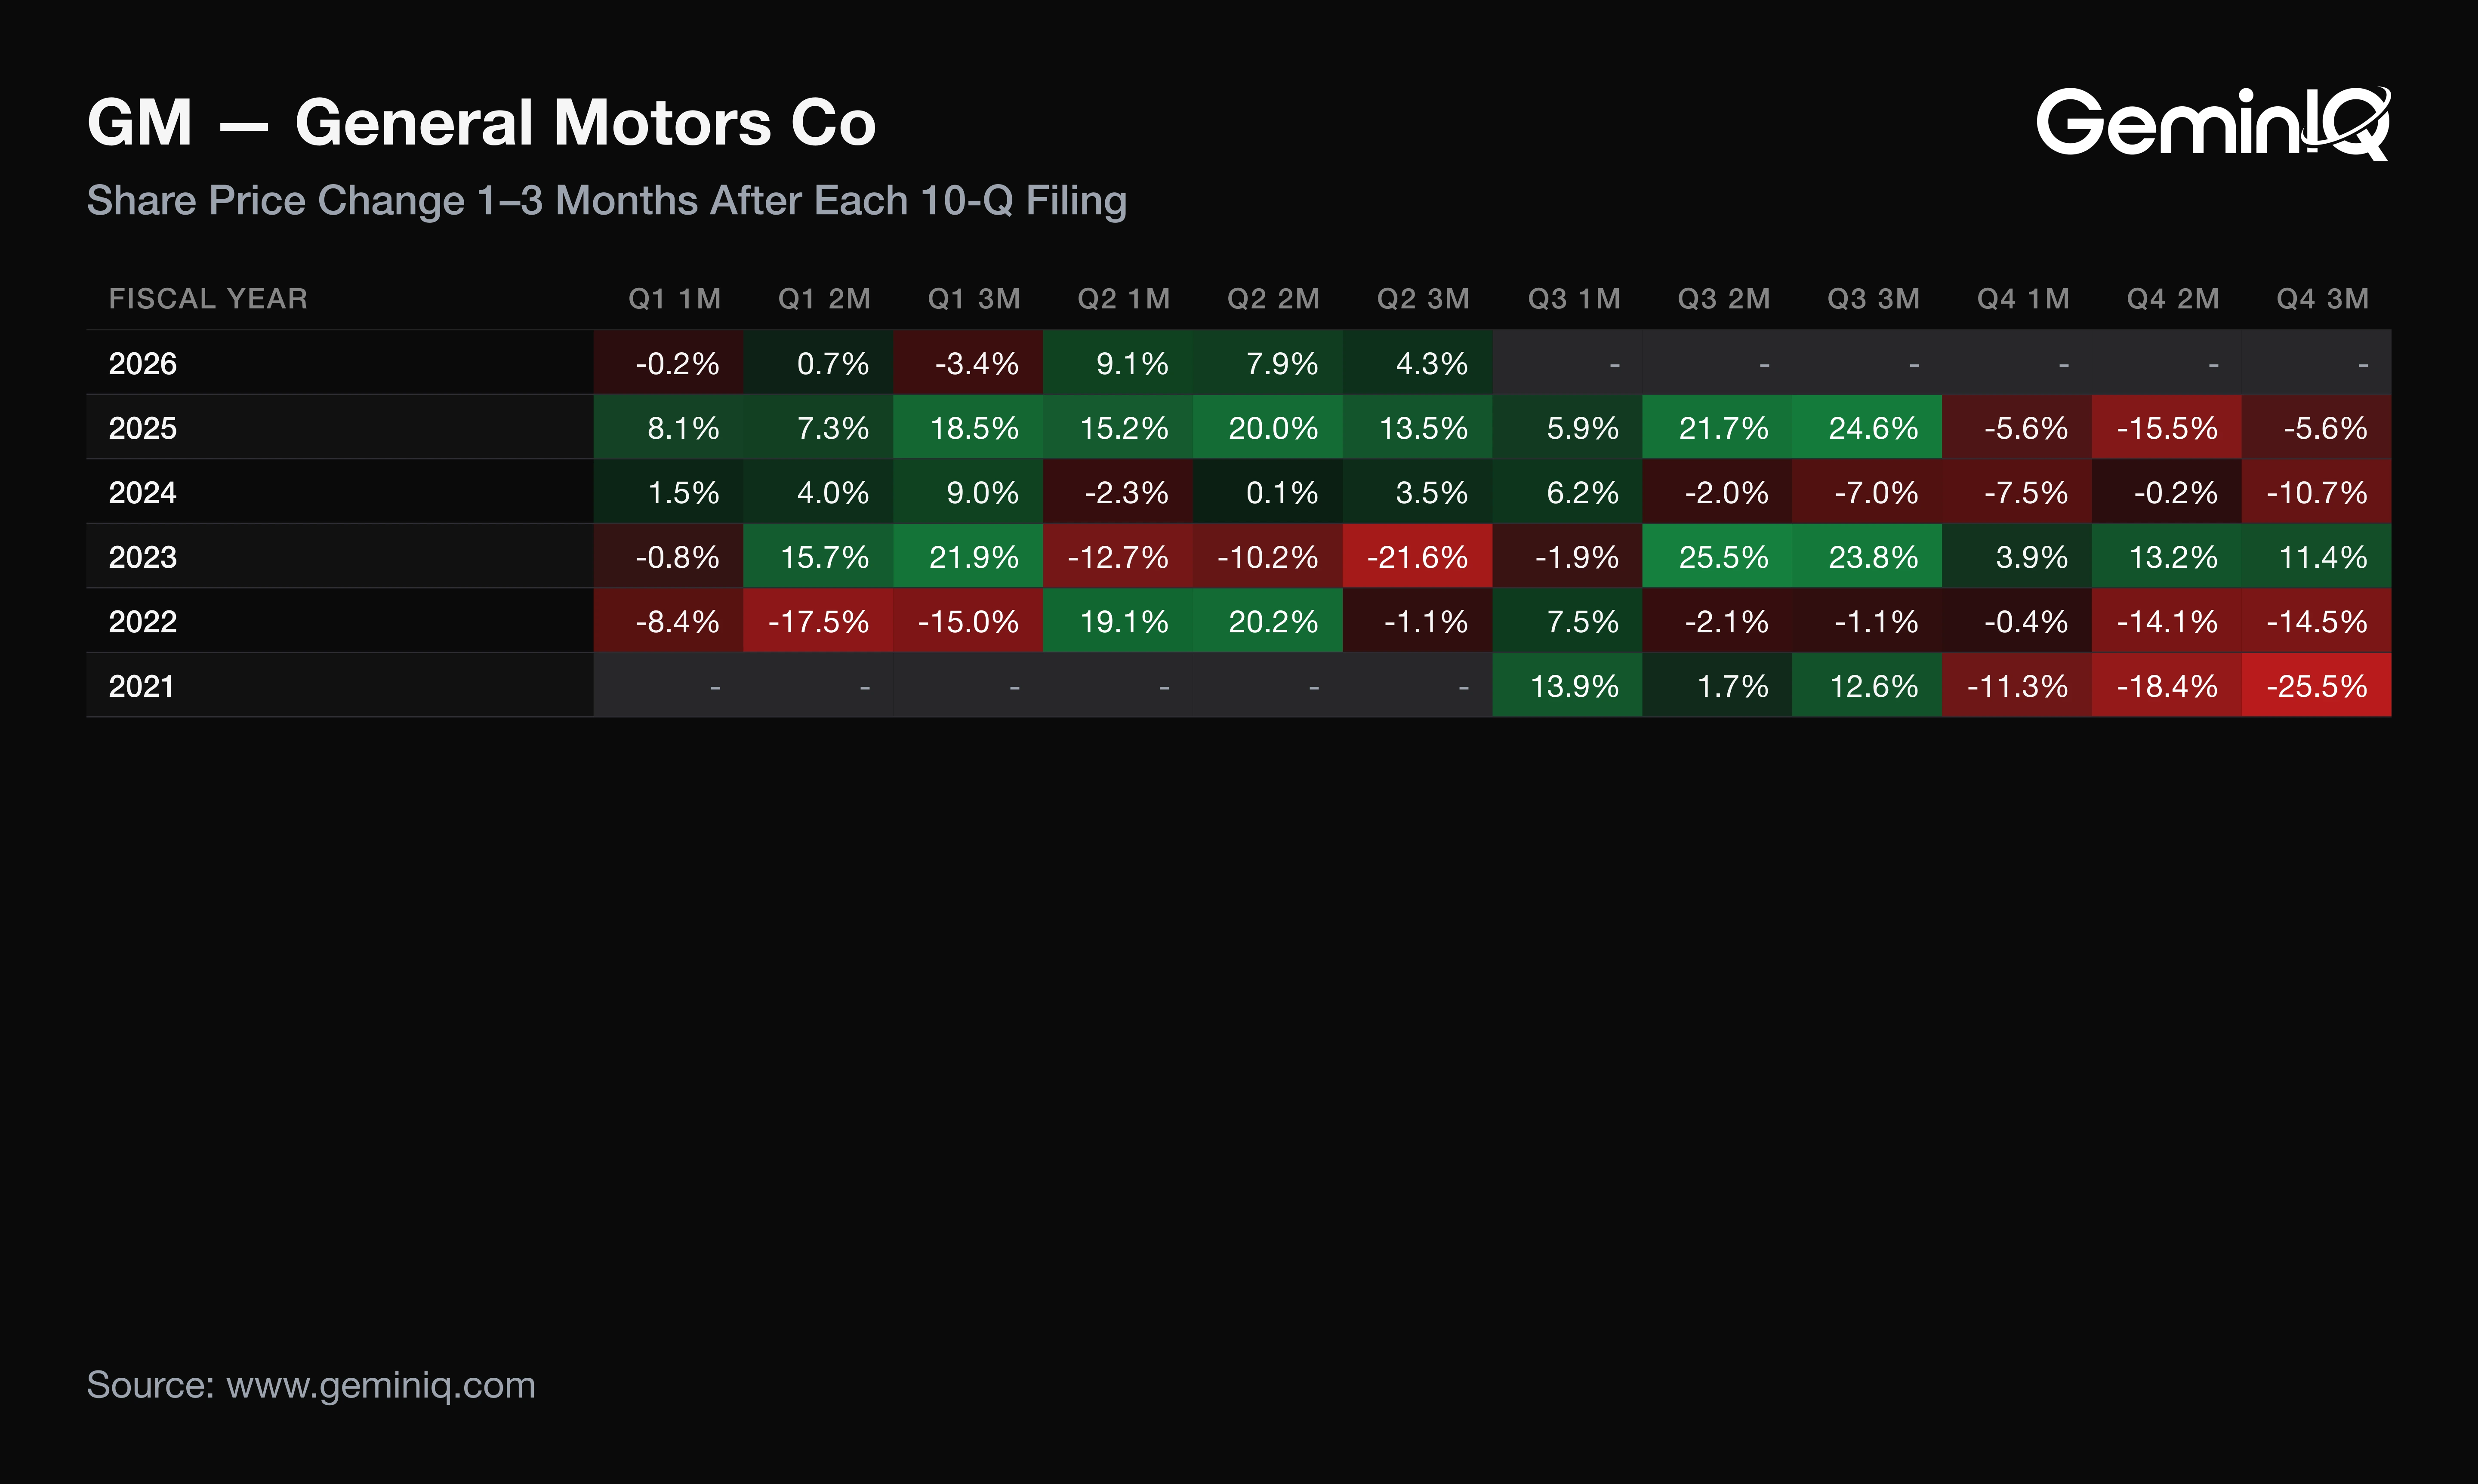
Across GM's last 12 10-Q filings with completed one-month windows (filed October 24, 2023 to July 21, 2026), the median one-month return was +2.7%, positive after 7 of 12. These figures describe how GM's stock moved after its past filings; they are a historical association, not a forecast.
The Data: The one-month range ran from -7.5% after the filing of January 28, 2025 to +15.2% after July 22, 2025. The three-month median was +6.6%, positive after 8 of 12, and the same January 2025 filing produced the three-month low of -10.7%. Past Q3 filings were followed by one-month returns of -1.9%, +6.2% and +5.9%. The Q3 2026 filing has no completed window yet.
Why: The one-month range spans 22.7 points (derived) against a median of 2.7, so the median describes few individual filings. The GeminIQ Earnings Reaction Heat Map shows each window.
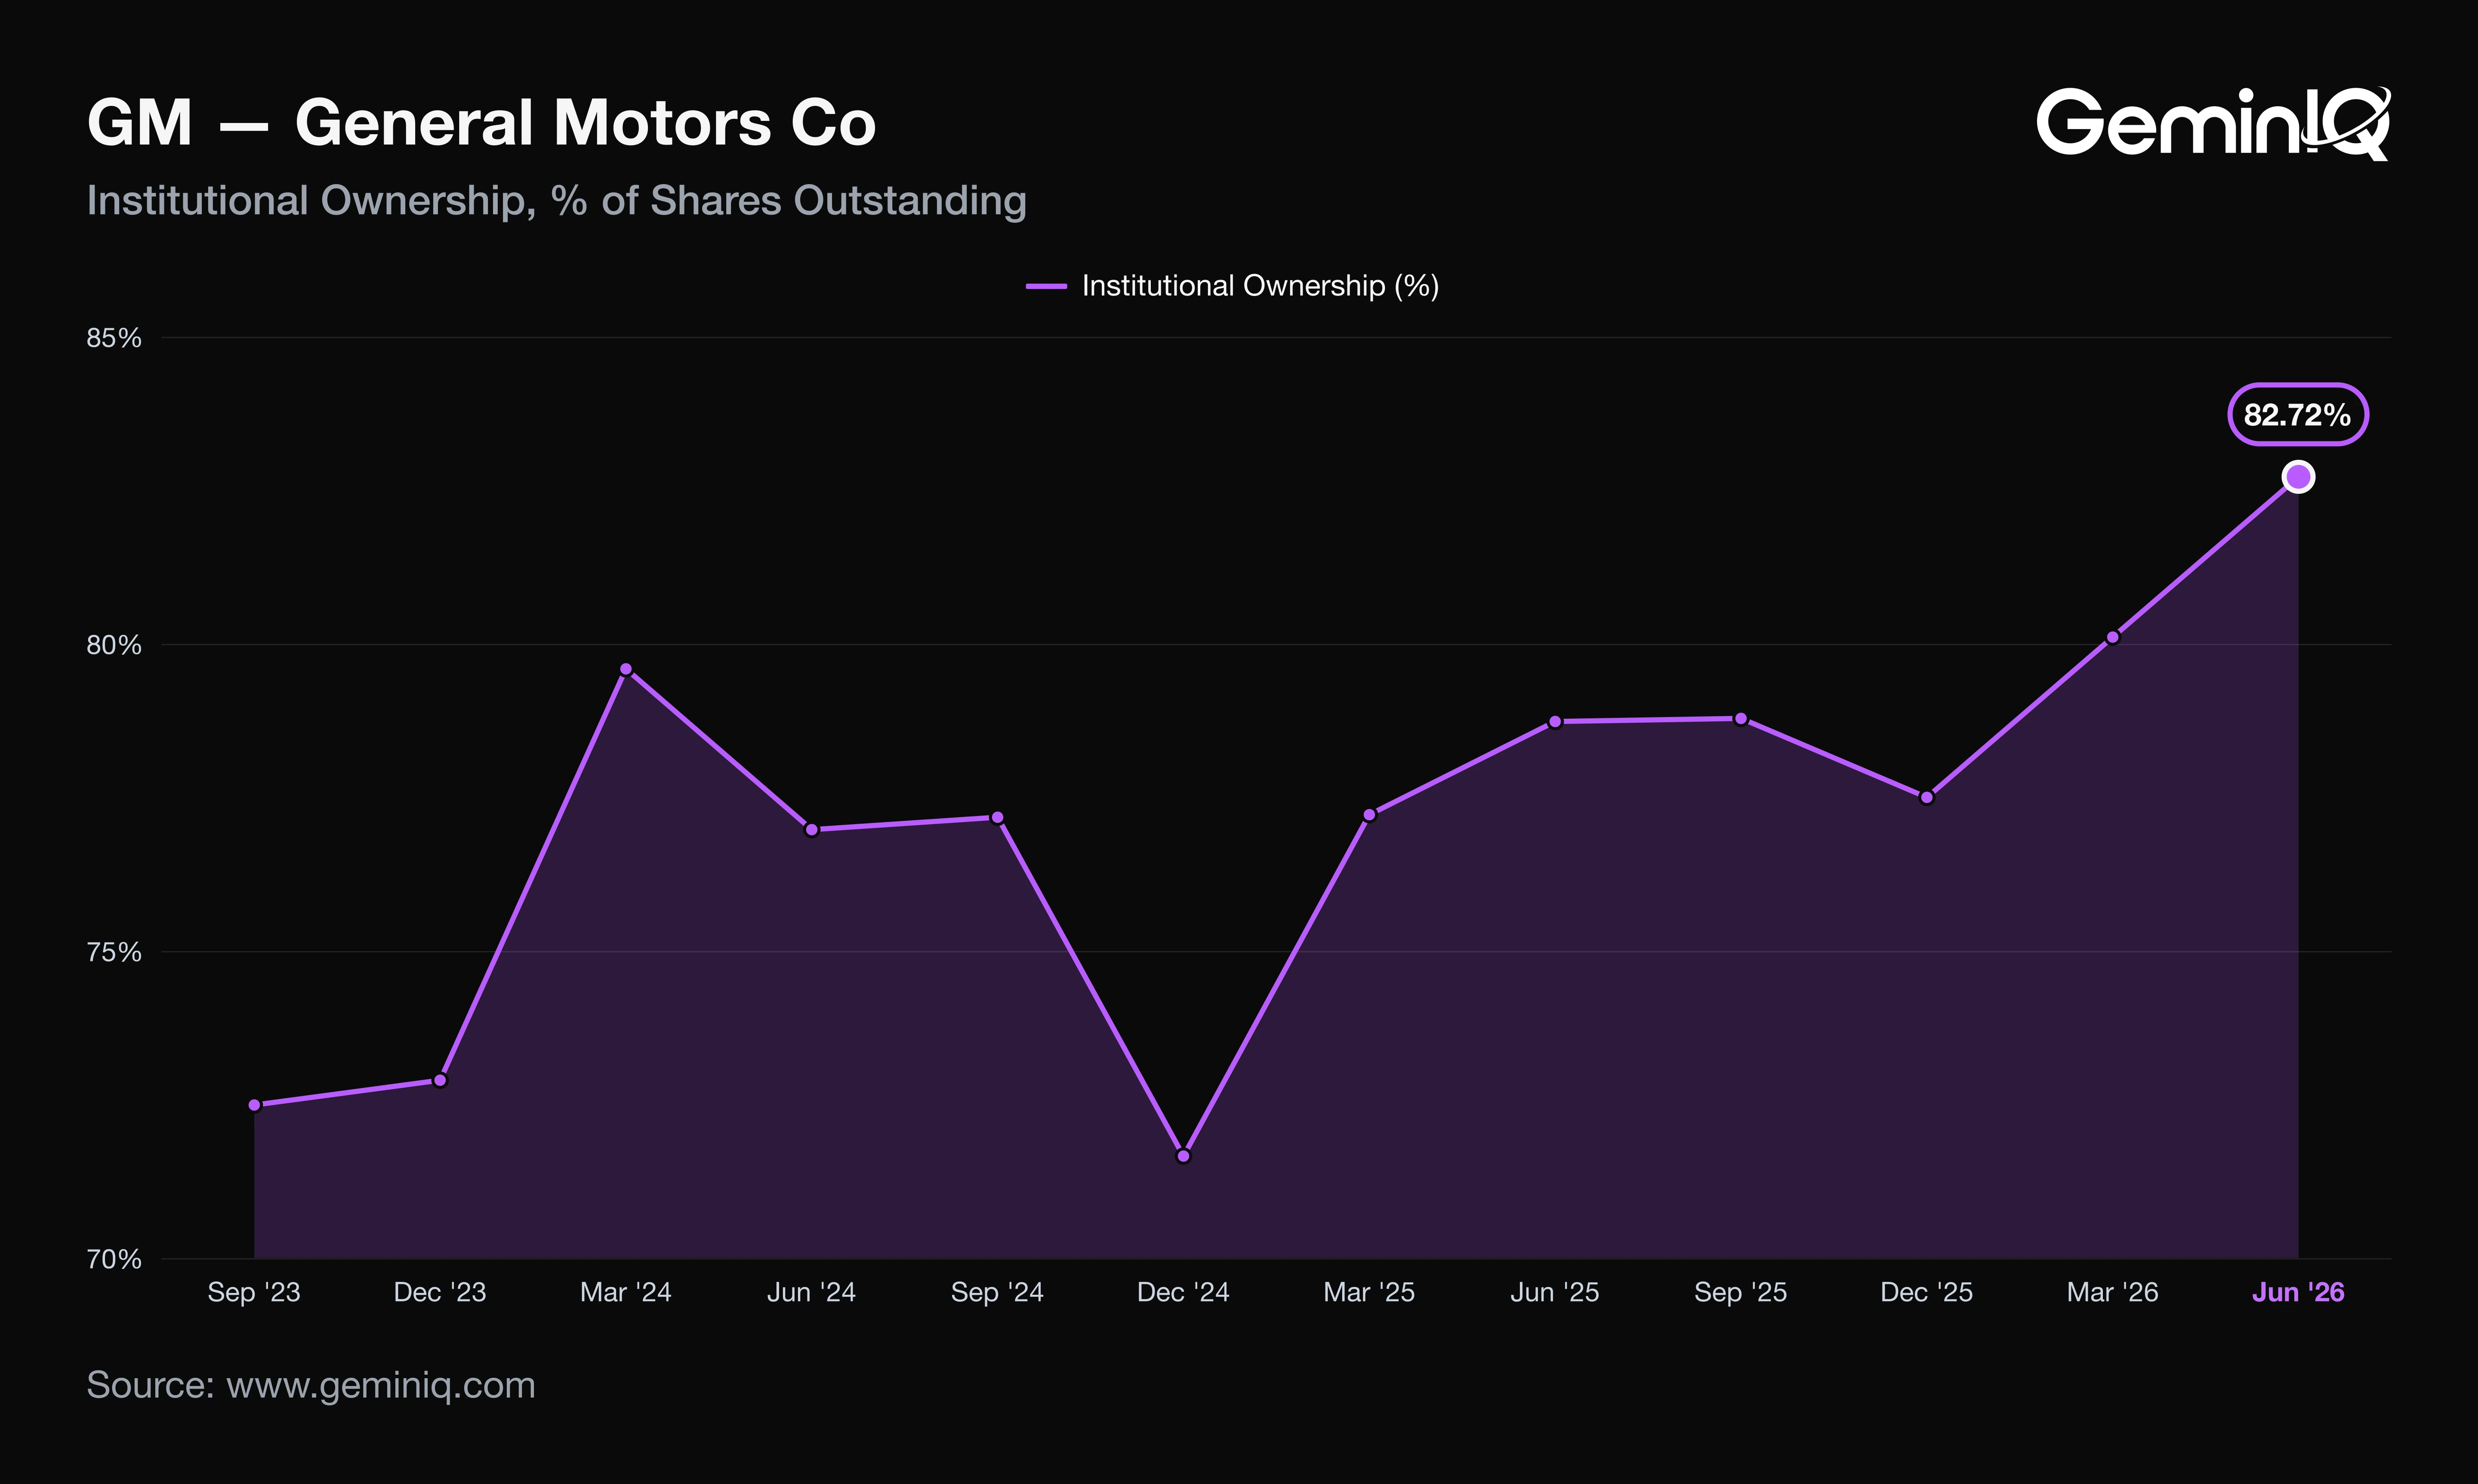
Institutions held 82.72% of GM at June 30, 2026 in SEC Form 13F data, up 3.99 points from 78.74% a year earlier and the highest of the last 16 quarters. The September 30 13F had not been filed at publication. Form 4 filings through August 3, 2026 show 34 insider sales totaling $290.0 million and no purchases in the prior 12 months, 67% of it by Mary Barra, against 8 sales and one $608,000 purchase in the 12 months before.
When profit jumps on flat sales, the size of the prior year's charge schedule, not the growth rate, sets how much of the gain can repeat.
Frequently Asked Questions
When does GM report earnings?
GM reported Q3 2026 results on October 20, 2026 and filed its 10-Q the same day. Last year it filed its fourth-quarter results on January 27, 2026, and the year before on January 28, 2025, a pattern in its filing record, not a forecast of the next date.
Does GM pay a dividend?
Yes. GM paid $215.0 million in dividends in Q3 2026 and $1.18 billion over the trailing year, up 83.3% from $646.0 million. The 10-Q says the board raised the quarterly dividend by $0.03 to $0.18 per share in January 2026, and the 8-K declares $0.18 payable December 17, 2026 to holders of record on December 4.
Is GM doing well financially?
GM's trailing operating profit margin was 2.22% at Q3 2026 against 4.41% a year earlier, while trailing net profit margin was 2.41% against 2.32%. GeminIQ's pre-calculated Operating Profit Margin and Net Profit Margin still carry charges recorded earlier in the trailing year. Return on Invested Capital (ROIC) was 9.19% against 11.00%, and the Current Ratio was 1.09x against 1.23x.
Wall Street's data. Main Street's price.
Institutional terminals charge thousands a year for as-filed accuracy. GeminIQ gives you the same thing for a fraction of the cost: financials built directly from raw SEC EDGAR filings, not third-party APIs, with full XBRL traceability back to the original 10-K or 10-Q. No normalized guesswork, just calculated metrics, charts, screeners, and watchlists built on numbers exactly as the company reported them. Start researching now at GeminIQ.com.
All financial figures cited in this article reference GENERAL MOTORS COMPANY's Q3 2026 10-Q (filed October 20, 2026, period ending September 30, 2026), with guidance and management commentary drawn from the company's Form 8-K earnings release (filed October 20, 2026). All SEC filings are publicly available at SEC EDGAR and SEC EDGAR.
Disclaimer: The content in this blog is for educational and entertainment purposes only and does not constitute financial, legal, or tax advice. Investing involves risk, including the loss of principal. The views expressed are my own and not intended as financial advice or a guarantee of future performance.