
Invested Capital Formula: A Worked Example From Apple's 10-Q

By Chad Hartman
Published · Last updated
Revenue is a single line on an income statement. Net income is a single line on the same statement. Invested capital is not a line anywhere. No filing reports it directly, which means every platform displaying a number labeled "invested capital" has already made three or four methodology decisions before that number reaches a screen. Which debt counts. Whether the current portion of long-term debt belongs in the total. How much cash is excess versus operationally necessary. Whether the figure comes from one period's balance sheet or an average of two. The only way to know whether you trust one of those numbers is to build it yourself once.
This guide does exactly that — one company, one filing, start to finish. It builds invested capital by hand from Apple's most recently filed 10-Q — Q2 FY2026 (filed May 1, 2026, period ending March 28, 2026) — locating each of the three inputs in the filing and tracing it back to the XBRL tag behind it.
For the plain-English definition, the formula on its own, and how the metric is calculated consistently across every company in the database, see the Invested Capital metric page — the full definition and formula live there. This post assumes you have that and want to watch the arithmetic actually run.
Table of Contents
- The Invested Capital Formula
- Step 1: Find Total Equity
- Step 2: Find Total Debt — and Why the Current Portion Is Included
- Step 3: Calculate Excess Cash
- Step 4: Put It Together — Apple's Invested Capital, Start to Finish
- "Invested Capital" vs. "Total Invested Capital" vs. "Average Invested Capital"
- Invested Capital in Corporate Finance vs. Private Equity
- Why Invested Capital Differs So Much Across Platforms
- When Invested Capital Breaks
- Where Invested Capital Shows Up: ROIC, Screens, and Beyond
- Frequently Asked Questions
The Invested Capital Formula
GeminIQ calculates invested capital using the financing approach — building the number from the funding side of the balance sheet:
Invested Capital = Total Equity + Total Debt − Excess Cash
Total Equity is Total Shareholders' Equity exactly as reported, carrying the Stockholders Equity tag. Total Debt is the interest-bearing borrowings defined in Step 2. Excess Cash is total cash less an Operating Cash Reserve, which GeminIQ estimates at 2% of trailing-twelve-month revenue, caps at total cash, and floors at zero.
Three inputs, one subtraction. The formula is not the hard part. Two of the three inputs — Total Debt and Excess Cash — require a judgment call the raw filing never makes for you, and the next three steps show exactly how GeminIQ's Calculated Metrics view makes that call, built from the same filing referenced above.
Step 1: Find Total Equity
What Is Total Equity in the Invested Capital Formula?
Total Equity is the simplest of the three inputs. It reports directly on the balance sheet as a single line, with no judgment calls required — the book value of everything shareholders own, net of treasury stock. Pulling it from GeminIQ's Financial Statements view means it arrives with the XBRL tag attached, rather than folded into a normalized "equity" line that may or may not match what the company actually filed.
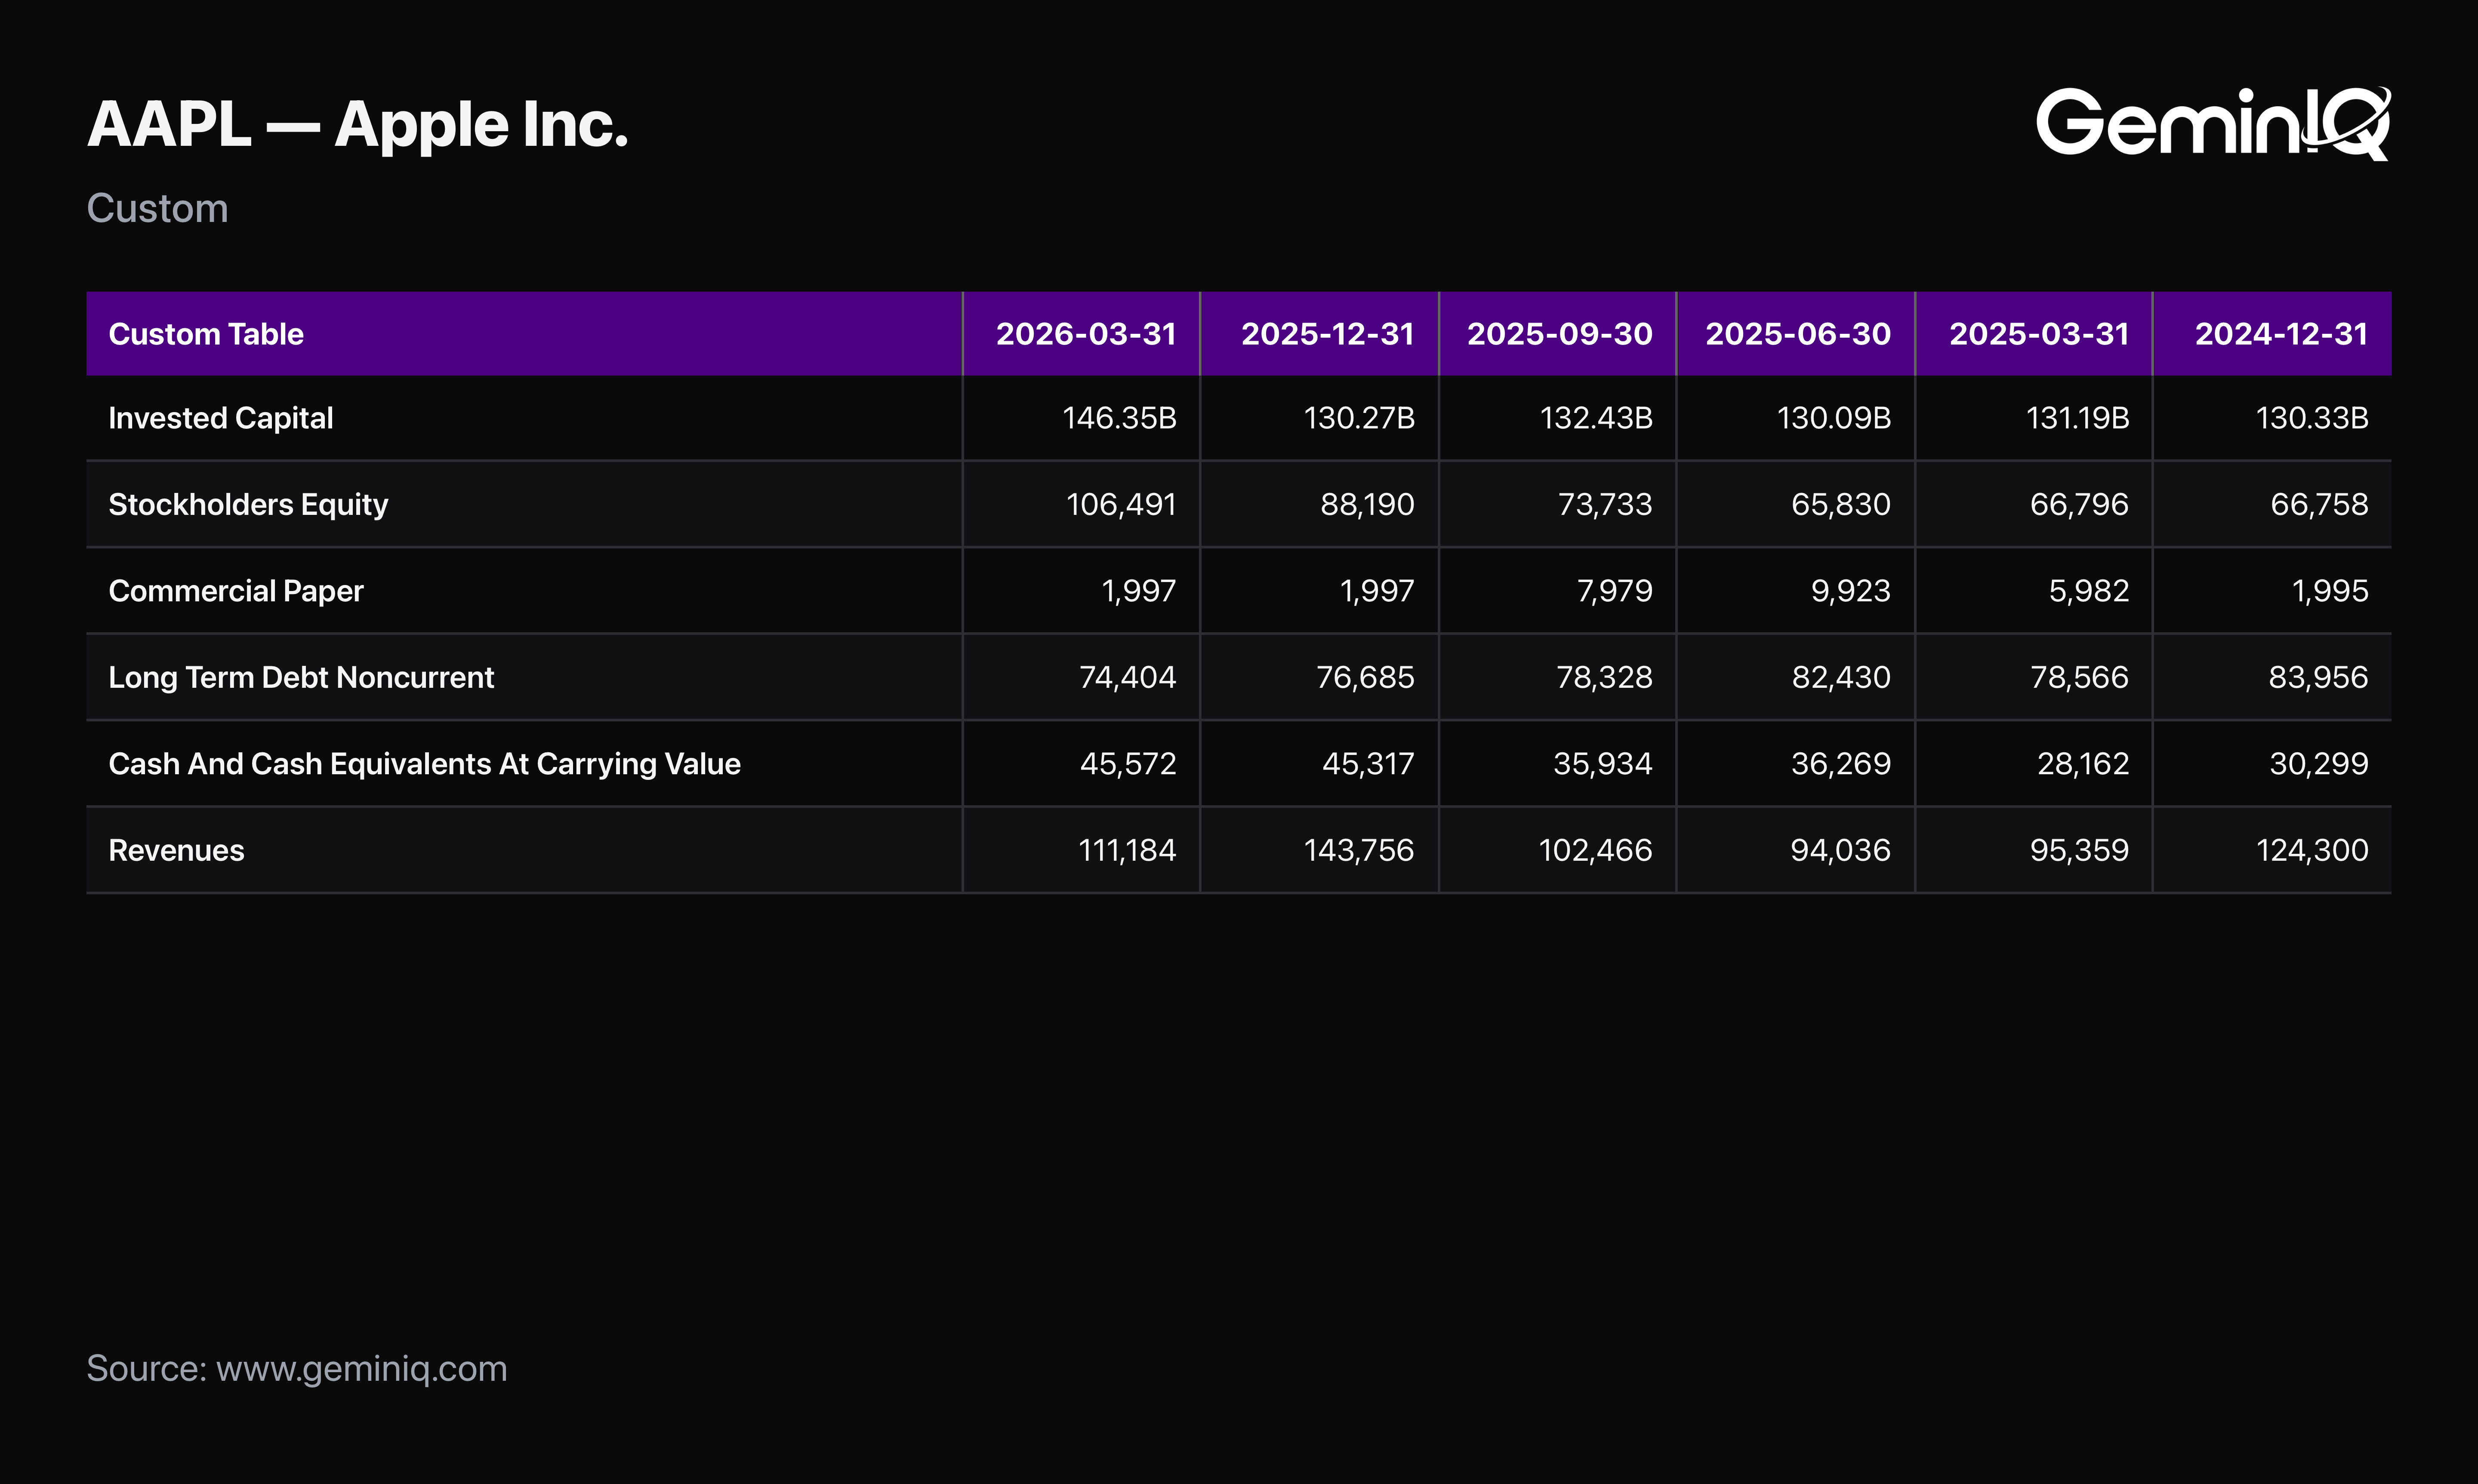
The Data: Apple's balance sheet as of March 28, 2026 reports Total Shareholders' Equity (the Stockholders Equity tag) of $106.5 Billion. A year earlier, the same line stood at $66.8 Billion. The $39.7 Billion swing reflects four consecutive quarters of net income compounding faster than buybacks and dividends returned it — and a Retained Earnings balance that flipped from an -$15.6 Billion accumulated deficit to a $12.4 Billion positive balance over the same year.
When it breaks: Total Equity can run negative for companies with aggressive buyback histories or large accumulated deficits — several large, profitable companies sit in exactly this position. Negative equity does not automatically signal distress; more often it signals a company returning more capital to shareholders than it retains. It does, however, mechanically depress invested capital, and in extreme cases can push the whole figure negative — at which point ROIC becomes undefined.
Step 2: Find Total Debt — and Why the Current Portion Is Included
What Counts as Total Debt for Invested Capital?
This is where invested capital calculations most commonly diverge, and GeminIQ's definition is broader than some investors expect. Total Debt for invested capital purposes includes every interest-bearing borrowing on the balance sheet — commercial paper and similar short-term instruments, the current portion of long-term debt, and the non-current portion of long-term debt. Nothing interest-bearing is left out: the current maturity of term debt is a real obligation the company must fund, so it belongs in the capital base just as the commercial paper and the long-dated notes do.
That is a narrower definition than the "Total Debt" used in a Debt-to-Equity Ratio calculation, which typically counts every interest-bearing obligation regardless of maturity. For invested capital, GeminIQ isolates the debt that represents ongoing, structural financing: non-current term debt that stays on the balance sheet for years, and revolving short-term instruments like commercial paper that companies continuously roll over rather than pay down. A maturity already scheduled for repayment out of existing cash within twelve months is a different economic animal from either one.
The Data: Apple's Q2 FY2026 balance sheet reports Commercial Paper of $2.0 Billion, Long Term Debt Current of $8.3 Billion, and Long Term Debt Noncurrent of $74.4 Billion. All three summed give $84.7 Billion in total interest-bearing debt, and the full $84.7 Billion counts toward invested capital — Commercial Paper, the $8.3 Billion current portion of term debt, and the non-current term debt alike.
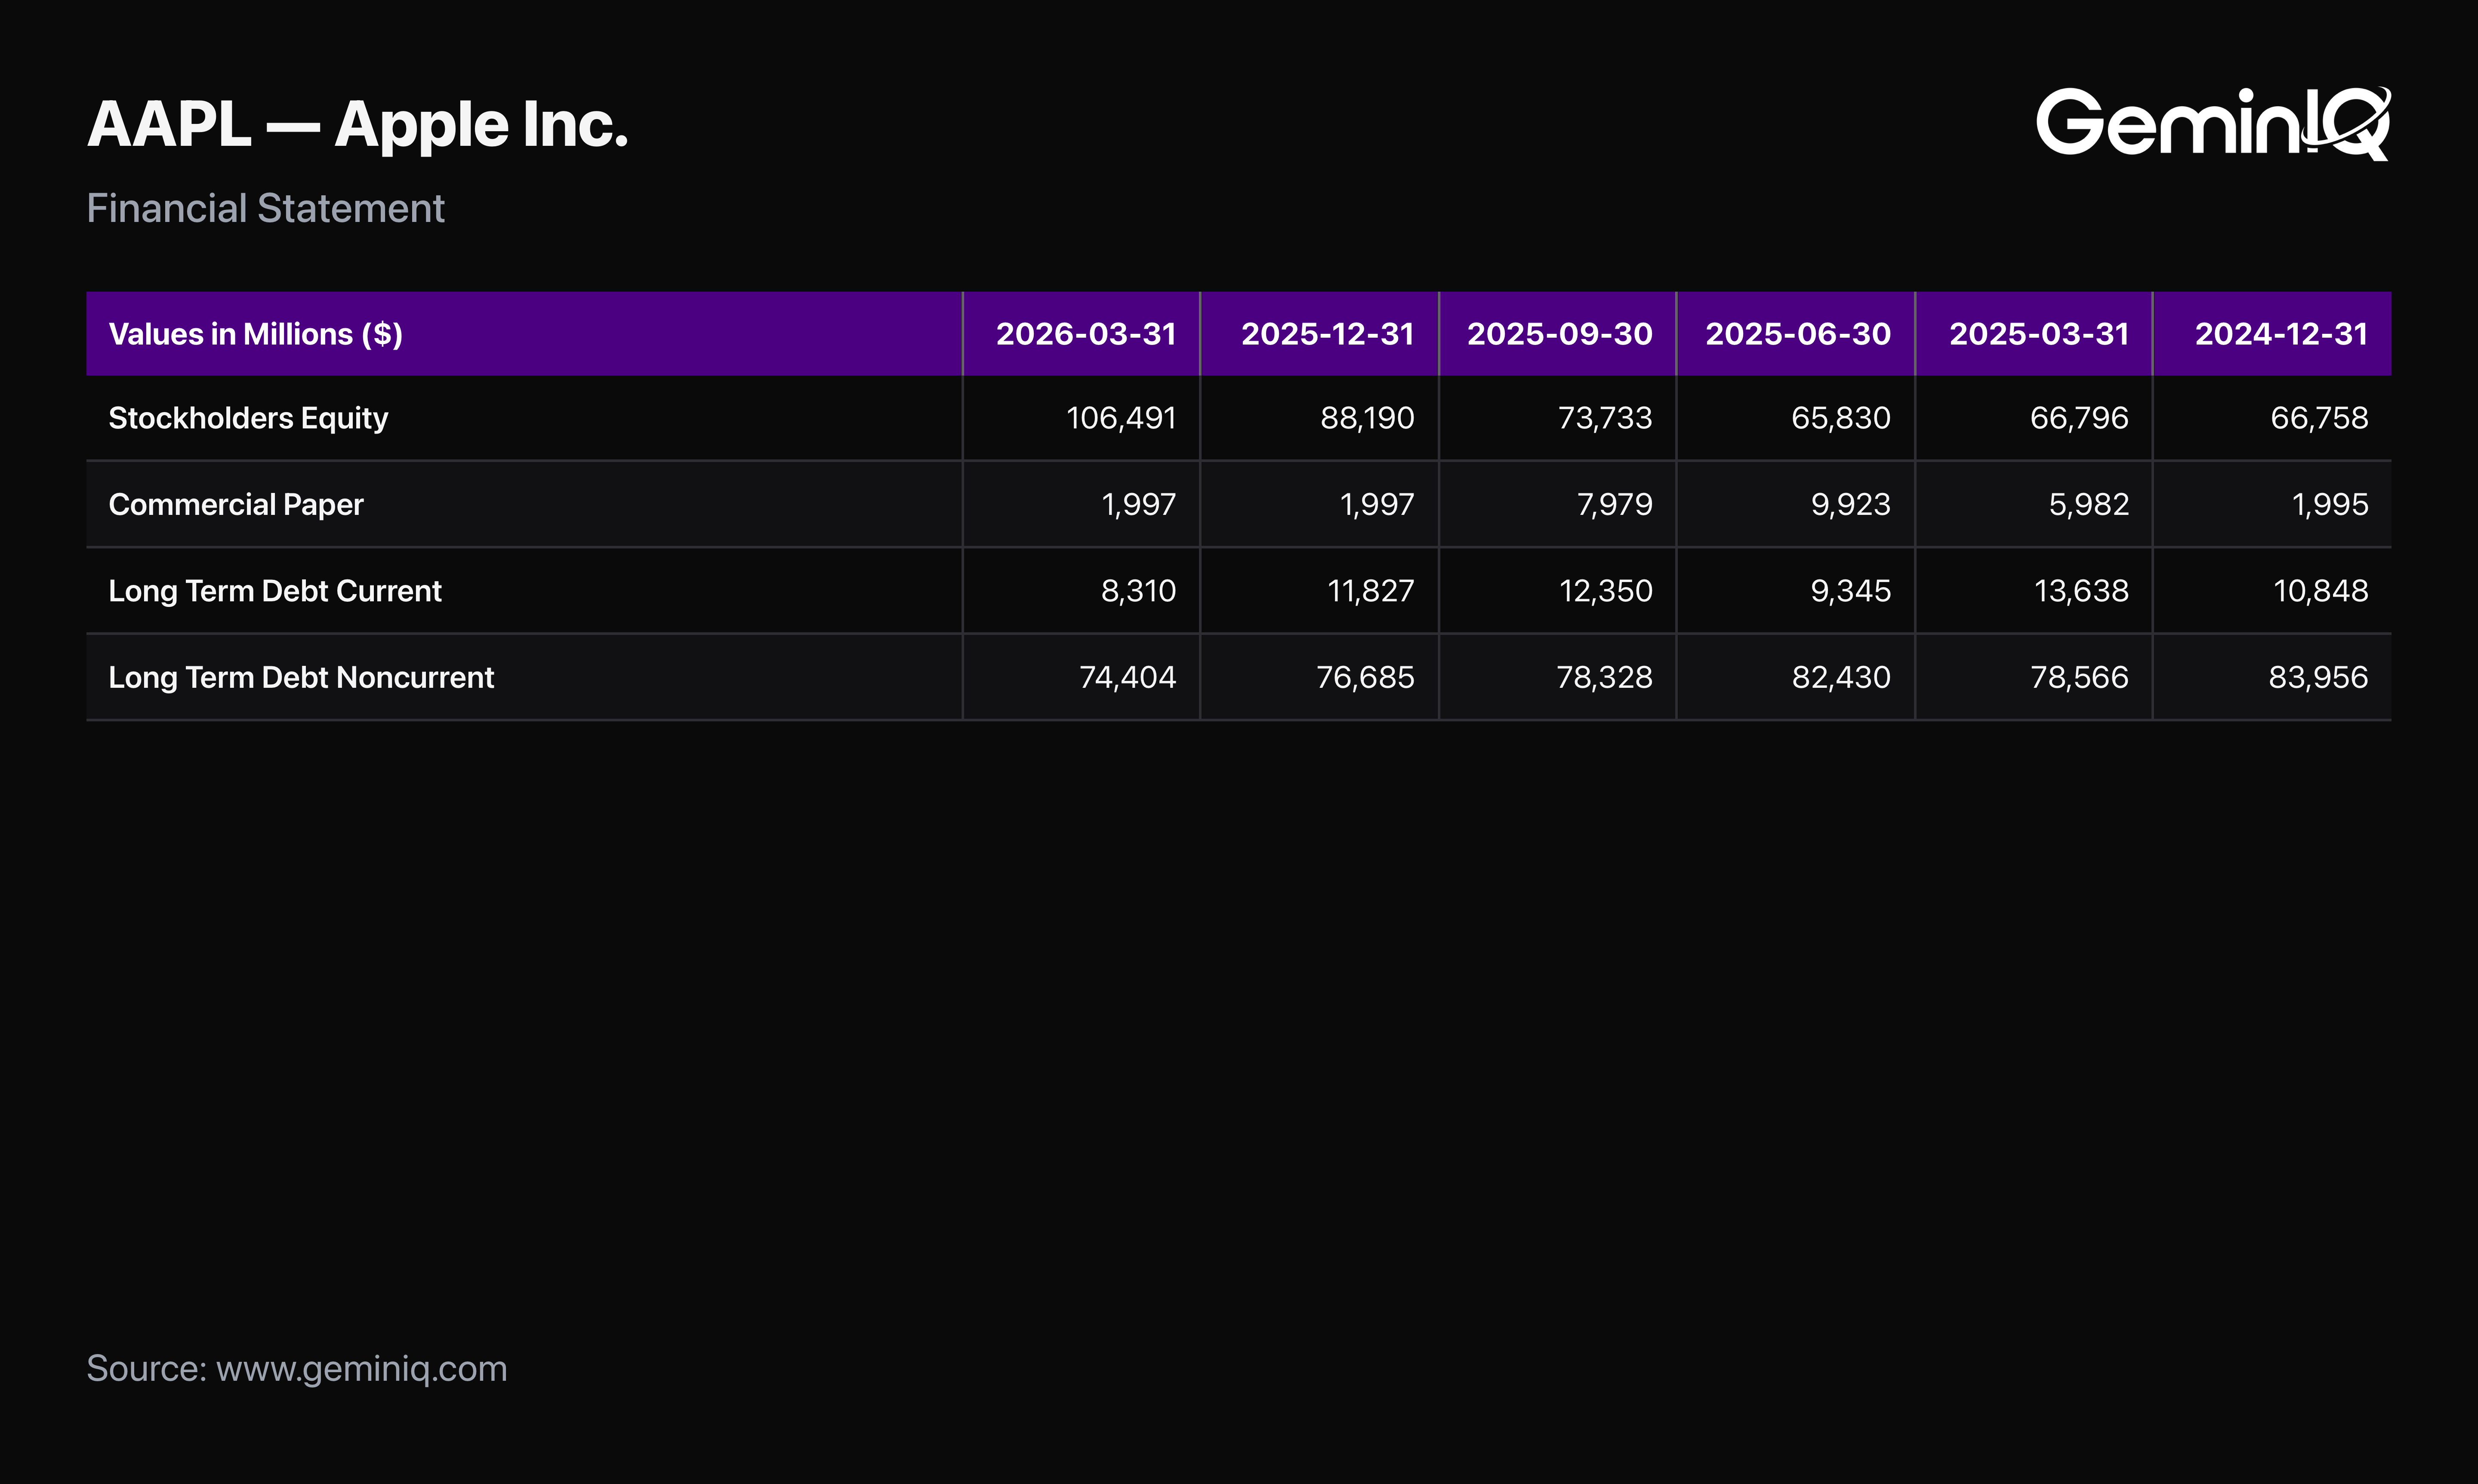
When it breaks: A platform that excludes the current portion of long-term debt from invested capital shows a smaller capital base — and, mechanically, a higher ROIC — than one that includes it, the way GeminIQ does. Neither convention is wrong on its face, but the two are not comparable to each other, and an $8 Billion-or-larger current-debt balance can move the resulting ROIC by a full percentage point or more. When a by-hand calculation doesn't match a platform figure, this is the first place to check.
Step 3: Calculate Excess Cash
What Is Excess Cash?
Cash on the balance sheet above what a business needs for day-to-day operations is a financial asset, not deployed operating capital. Counting all of it toward invested capital understates ROIC for exactly the businesses where ROIC is most useful as a quality signal: capital-light, cash-rich ones. GeminIQ estimates the operating cash a business actually needs at 2% of trailing-twelve-month revenue and treats everything above that threshold as excess.
Operating Cash Reserve = min(Total Cash, 2% × Revenue TTM) Excess Cash = Total Cash − Operating Cash Reserve (floored at zero)
The Data: Apple's Cash And Cash Equivalents At Carrying Value stood at $45.6 Billion as of March 28, 2026, against Revenue TTM of $451.4 Billion. Two percent of that revenue figure is $9.0 Billion — the Operating Cash Reserve. Subtract it from total cash and Excess Cash comes to $36.5 Billion.
When it breaks: The 2%-of-revenue rule is a standard corporate finance estimate, not a figure any company discloses. It holds up well as a consistent, comparable benchmark across the entire market, but a business with genuinely unusual working capital needs — heavy inventory financing, large customer deposits — may need meaningfully more or less operating cash in reality. Treat the excess cash figure as a reasonable estimate, not a number the company itself would sign off on.
Step 4: Put It Together — Apple's Invested Capital, Start to Finish
With all three inputs built from the same filing, the arithmetic runs in one line:
Invested Capital = Total Equity + Total Debt − Excess Cash $106.5 Billion + $84.7 Billion − $36.5 Billion = $154.7 Billion
$154.7 Billion is the capital base Apple must generate an operating return on, as of the Q2 FY2026 filing. It is not the $371.1 Billion in total assets. It is not the $264.6 Billion in total liabilities. Invested capital keeps the full interest-bearing debt load from Step 2 but strips out the cash Apple is not actually deploying into the business, and what is left is a more precise number than any headline balance sheet total.
"Invested Capital" vs. "Total Invested Capital" vs. "Average Invested Capital"
These three terms circulate almost interchangeably across financial media, and that interchangeability is exactly where the confusion starts. They are not three metrics. They are the same calculation, used two different ways.
Invested Capital and Total Invested Capital are the same figure: the point-in-time number built above, $154.7 Billion for Apple as of March 28, 2026. "Total" describes what the figure already is — a combination of debt and equity capital — rather than a separate methodology. If one source calls it "invested capital" and another calls it "total invested capital" for the same company and period, the two numbers should match, assuming both apply the same debt and excess cash conventions from Steps 2 and 3.
Average Invested Capital is genuinely different, and it is the figure that actually feeds ROIC:
Average Invested Capital = (Invested Capital, current period + Invested Capital, same period prior year) ÷ 2
The averaging exists because ROIC measures a flow — NOPAT generated over a trailing twelve months — against a capital base, and a single point-in-time snapshot creates a timing mismatch with that flow. A company that raised a large amount of capital mid-year would have a period-end invested capital figure that includes months during which the new capital wasn't yet generating returns, artificially depressing ROIC. Averaging the current period against the same period one year earlier smooths that mismatch into a figure that better represents the capital base actually deployed across the trailing year.
The Data: Apple's invested capital one year earlier — Q2 FY2025, period ended March 29, 2025 — was $144.8 Billion, built from Total Equity of $66.8 Billion, Total Debt for invested capital of $98.2 Billion, and Excess Cash of $20.2 Billion. Average that against the current period's $154.7 Billion and Average Invested Capital comes to $149.7 Billion — exactly what feeds the ROIC calculation. Divide NOPAT TTM of $122.3 Billion by that $149.7 Billion and the result is 81.7%, matching GeminIQ's displayed ROIC TTM. Every input traces cleanly back to two filings.
The practical distinction: a headline figure described simply as a company's "invested capital" is almost always the point-in-time figure. When a ROIC number is being reconstructed from its components, the denominator in play is the average. Dividing NOPAT by a single period's invested capital instead of the two-period average is one of the more common by-hand errors, and it produces a ROIC that won't reconcile with GeminIQ's pre-calculated figure even when every other input matches exactly.
Invested Capital in Corporate Finance vs. Private Equity
One more thing worth clearing up before leaving the worked example, because it trips people up when they search the term: two entirely different concepts share this name, and search results return both without warning that they measure different things.
Everything above describes the corporate finance meaning — a balance sheet figure for an operating company, calculated from that company's own filings, used as the denominator in ROIC. It answers how much capital is deployed inside one business.
Private equity uses "invested capital" to mean something else: the portion of a fund's committed capital that has actually been called and deployed into portfolio companies, as distinct from capital that limited partners have promised but the fund has not yet drawn. A fund with $1 Billion in commitments that has deployed $600 Million has $600 Million of invested capital, regardless of what any portfolio company's balance sheet says. It is the denominator in fund-level return measures — multiple on invested capital, distributions to paid-in capital — and it describes the flow of money from investors into deals, not the capital structure of an operating business.
The distinction is not academic. The corporate figure is calculable from a 10-K or 10-Q by anyone. The private equity figure lives in fund reporting that limited partners receive and the public does not. When a search result for "invested capital" describes capital calls, dry powder, or vintage years, it is answering the fund question. The build above, and every invested capital figure on GeminIQ, answers the operating company question.
Why Invested Capital Differs So Much Across Platforms
Pull the same company's invested capital from two different financial websites and a mismatch of 10% or more is common. It is rarely a data error — it is four methodology decisions compounding on top of each other.
The debt definition is the largest source of divergence: whether the current portion of long-term debt is included, as shown in Step 2, whether operating lease liabilities are folded into debt, and whether preferred stock is treated as debt or equity all shift the total meaningfully. The excess cash assumption is the second: some platforms subtract all cash from invested capital, some subtract none, and GeminIQ's 2%-of-revenue threshold sits between those extremes. The financing-versus-operating approach choice is the third — GeminIQ builds the figure from the funding side, and the Invested Capital metric page explains why that approach is more robust than working from the asset side. Point-in-time versus average invested capital is the fourth — and the one that produces the most confusion, because a platform that shows a single "invested capital" figure without specifying whether it is a snapshot or a two-period average leaves the reader unable to reconcile it against a ROIC figure at all.
Operating lease treatment under ASC 842 deserves a specific callout. Since the standard took effect, most operating leases now appear on the balance sheet as both a lease liability and a right-of-use asset — line items that did not exist in this form before 2019. A platform that folds lease liabilities into debt while another's convention does not will produce a materially different invested capital figure for any company with a large real estate or equipment lease footprint. Restaurant chains, retailers, and airlines are the clearest examples, and this is not a minor edge case — it is a structural difference in how two platforms read the identical balance sheet.
GeminIQ's pre-calculated Invested Capital applies one consistent convention — the financing approach, the debt definition in Step 2, and the 2% excess cash rule — across every company in the database, sourced directly from XBRL-tagged filings rather than a normalized third-party feed. That number will not match every other platform. It will be internally consistent across the entire universe, which is the property that actually matters when comparing invested capital or ROIC across companies.
When Invested Capital Breaks
Invested capital holds up as a denominator for most businesses across most periods. Three situations distort it enough to warrant a second look.
Large goodwill impairments shrink invested capital mechanically. A $10 Billion goodwill write-down reduces equity by roughly that amount net of any tax benefit, which shrinks invested capital in the same period — even though nothing about the business's actual operations changed. Any ROIC spike immediately following a large impairment deserves a check on whether the invested capital base still represents normal operating capital, not just a mathematically lower one.
Negative invested capital is the more severe failure mode. Companies with aggressive buyback histories or large accumulated deficits can push book equity negative enough that Total Equity plus Total Debt falls below Excess Cash, producing a negative figure. GeminIQ treats ROIC as null in these periods rather than displaying a number implying a meaningful "return" on a capital-deficient structure.
Businesses mid-cycle on a major capital investment — a new plant, an acquisition, a large capex ramp — show temporarily inflated invested capital before the new assets generate proportional operating returns. That is not a calculation error. It is a genuine, if temporary, mismatch between capital deployed and capital earning a return, and the trend across several years reads more reliably than any single period.
Where Invested Capital Shows Up: ROIC, Screens, and Beyond
Invested capital is rarely the end goal of an analysis on its own. It is the foundation underneath several of the metrics and screens value investors rely on most, starting with Return on Invested Capital: NOPAT divided by average invested capital, and the single most important quality metric for evaluating whether a business creates or destroys economic value over time.
Its influence extends into screening as well. GeminIQ's Quality Compounder screen filters directly on ROIC at or above 20%, which means every result depends on an invested capital figure calculated consistently across the entire company universe. Joel Greenblatt's Magic Formula, replicable through GeminIQ's screener, ranks companies on ROIC and earnings yield together — invested capital is the hidden variable underneath the ROIC half of that ranking.
Any screen or ratio built on ROIC is only as reliable as the invested capital calculation underneath it. Knowing exactly how that number gets built — which debt counts, how excess cash is estimated, whether the figure is point-in-time or averaged — is what makes it possible to trust, or productively question, everything built on top of it.
Frequently Asked Questions
Is "total invested capital" a different metric from "invested capital"?
No. Both terms refer to the same point-in-time calculation — Total Equity plus Total Debt minus Excess Cash. "Total" describes the fact that the figure combines debt and equity capital; it is not a separate methodology. The term to actually watch for is "average invested capital," a distinct, two-period calculation used specifically as the ROIC denominator.
What does invested capital mean in private equity?
Something different from the meaning used throughout this guide. In private equity, invested capital is the share of a fund's committed capital that has actually been called and deployed into portfolio companies, and it serves as the denominator in fund-level return measures like multiple on invested capital. The corporate finance figure built above measures capital deployed inside a single operating business and comes straight from that company's balance sheet. The two are unrelated calculations that happen to share a name.
Is invested capital the same as enterprise value?
No, though the two share components. Enterprise Value uses market capitalization — the current stock price times shares outstanding — plus total debt, minus all cash. Invested capital uses book equity, the balance sheet figure rather than the market price, plus a narrower debt definition, minus only excess cash above an operating threshold. Enterprise value is a market-based acquisition-cost concept; invested capital is a book-based operating-capital concept, and the two produce very different numbers for the same company whenever the market price diverges meaningfully from book value.
Can invested capital be negative?
Yes, though it is uncommon and usually signals an unusual capital structure rather than a calculation error. It occurs when Total Equity plus Total Debt falls below Excess Cash — most often for companies with large accumulated deficits or years of aggressive share buybacks that have pushed book equity toward or below zero. GeminIQ treats ROIC as null in these periods rather than computing a number from a capital-deficient base.
Does invested capital include operating lease liabilities?
That depends on the platform and the approach. Under ASC 842, most operating leases now appear on the balance sheet as lease liabilities and right-of-use assets. Whether a given invested capital calculation folds those lease liabilities into "debt" is a specific methodology choice that varies by source, and for lease-heavy businesses — restaurant chains, retailers, airlines — it can shift the figure meaningfully. Always check what debt definition a platform uses before comparing invested capital across companies with different lease footprints.
Why doesn't my by-hand invested capital calculation match GeminIQ's number?
Three causes account for most mismatches, in order of frequency: excluding the current portion of long-term debt from Total Debt, which Step 2 includes; using a different excess cash assumption than the 2%-of-revenue rule; or comparing a point-in-time figure against what is actually the two-period average used in ROIC. Checking which of the three applies almost always resolves the discrepancy.
Wall Street's data. Main Street's price.
Institutional terminals charge thousands a year for as-filed accuracy. GeminIQ gives you the same thing for a fraction of the cost: financials built directly from raw SEC EDGAR filings, not third-party APIs, with full XBRL traceability back to the original 10-K or 10-Q. No normalized guesswork, just calculated metrics, charts, screeners, and watchlists built on numbers exactly as the company reported them. Start researching now at GeminIQ.com.
All financial figures cited in this article reference Apple Inc.'s Q2 FY2026 10-Q (filed May 1, 2026, period ending March 28, 2026). All SEC filings are publicly available at SEC EDGAR.
Disclaimer: The content in this blog is for educational and entertainment purposes only and does not constitute financial, legal, or tax advice. Investing involves risk, including the loss of principal. The views expressed are my own and not intended as financial advice or a guarantee of future performance.