
Jefferies (JEF) Q3 2026 Earnings: Revenue Up 11%, Tax Rate Down 9 Pts

By Chad Hartman
Published · Last updated
Jefferies (JEF) reported total revenues of $3.23 billion for the quarter ended August 31, 2026, up 11.1%, and diluted EPS of $1.08, up 6.9% from $1.01, in its September 28 release (Form 8-K). The 10-Q filed October 9 then added $23.3 million to net earnings attributable to common shareholders and cut the quarter's effective tax rate to 17.9% from the release's 24.8%, with pretax earnings unchanged at $351.0 million. Net earnings rose 18.9% on pretax growth of 5.8%, and the tax line supplied the difference.
| Field | Value |
|---|---|
| Company | Jefferies ($JEF) |
| Quarter | Q3 FY2026, period ended August 31, 2026 |
| Earnings release | September 28, 2026 (Form 8-K) |
| 10-Q filed | October 9, 2026 |
| Revenue | $3.23 Billion (+11.1% YoY) |
| Diluted EPS | $1.08 per the 8-K (+6.9% YoY from $1.01); the 10-Q adds $23.3M to common earnings after the release |
| Operating margin | 10.9% (-0.5 pts YoY) |
| Operating cash flow (TTM) | $4.42 Billion |
| Effective tax rate | 17.9% (24.8% in the 8-K; 26.9% a year earlier) |
Jefferies Q3 2026 Revenue, Net Earnings and Margins
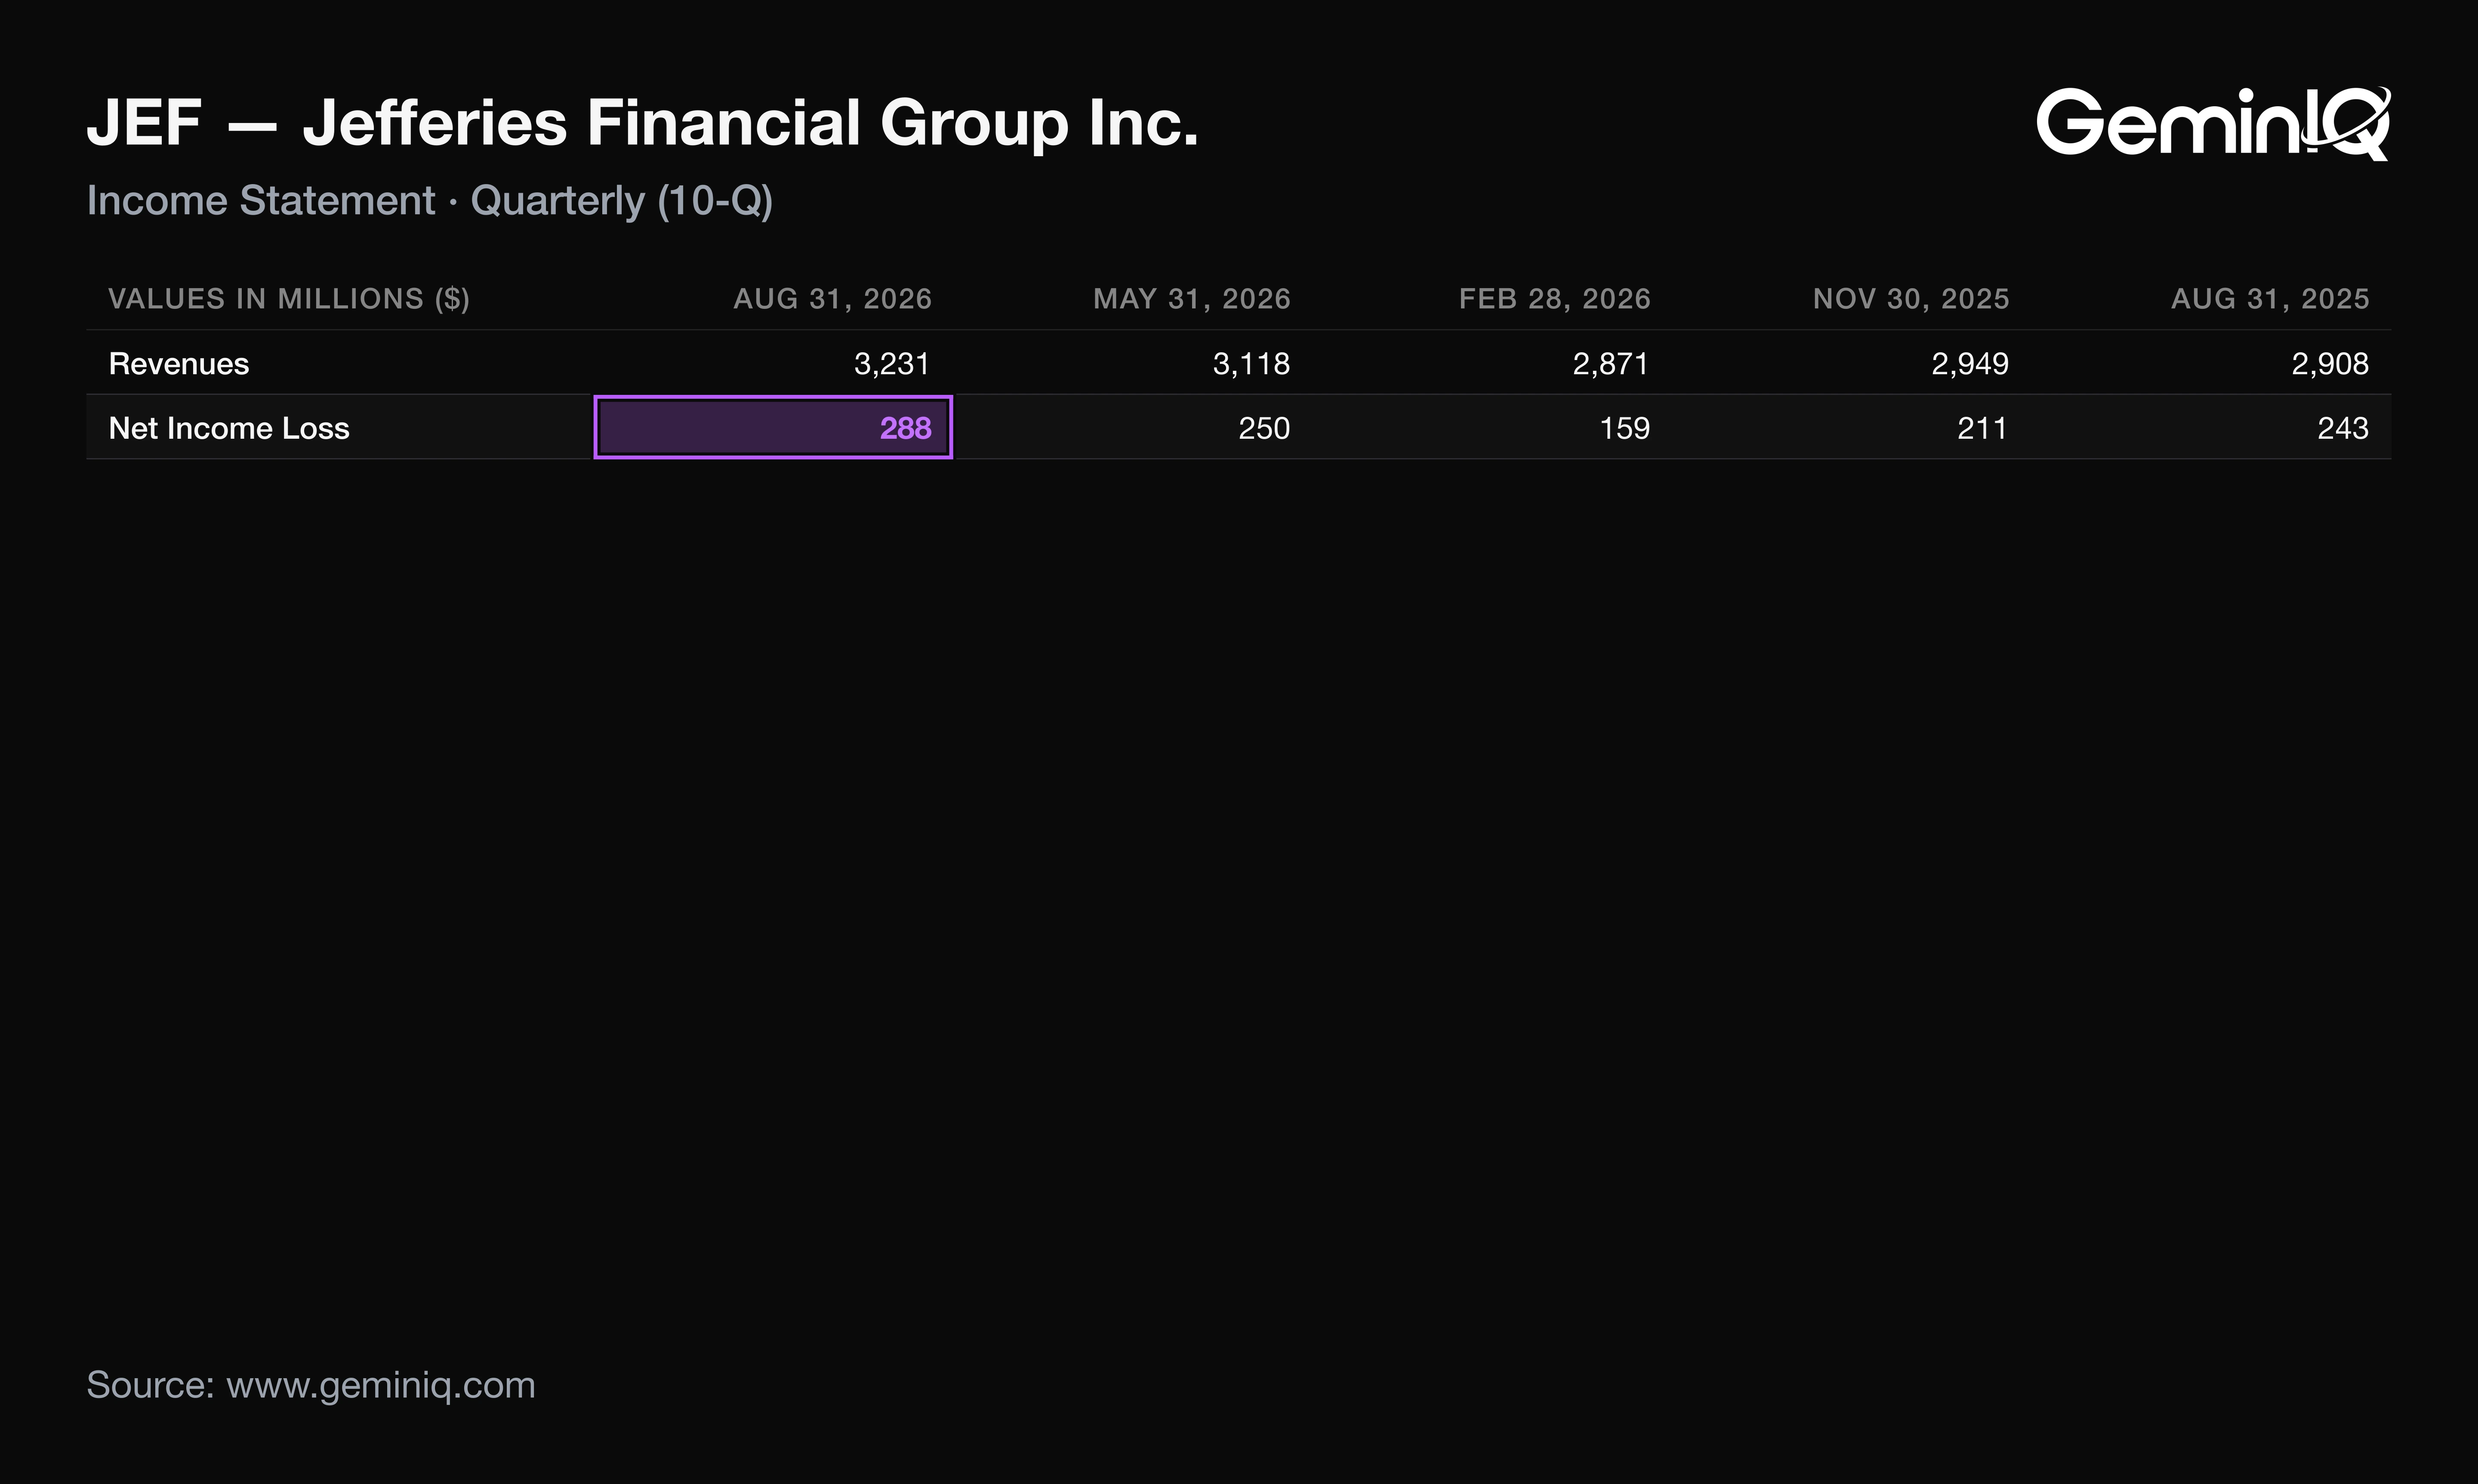
Jefferies' Q3 2026 total revenues were $3.23 billion, up 11.1% from $2.91 billion a year earlier and the highest of the last 16 quarters. Net revenues, after interest expense, rose a slower 8.5% to $2.22 billion, and two business lines carried them.
The Data: Advisory revenue was a record $817.8 million, up 24.7%, and Equities reached $626.2 million, up 28.7%. Fixed income fell 25.6% to $176.0 million, and Asset Management fell 51.6% to $85.6 million from $176.9 million. Operating margin was 10.9%, the second-highest of the last 16 quarters, yet 0.5 points below the 11.4% of a year earlier.
Why: Investment Banking and Equities added roughly $335.6 million of net revenue; Fixed income and Asset Management gave back roughly $151.9 million. Compensation rose 10.1% to $1.19 billion, outrunning the 8.5% revenue gain, so the compensation ratio edged to 53.7% from 52.9%. Pretax earnings grew 5.8%, slower than revenue. Record lines did not widen the margin.
What Jefferies' Q3 2026 10-Q Shows Beyond the Press Release
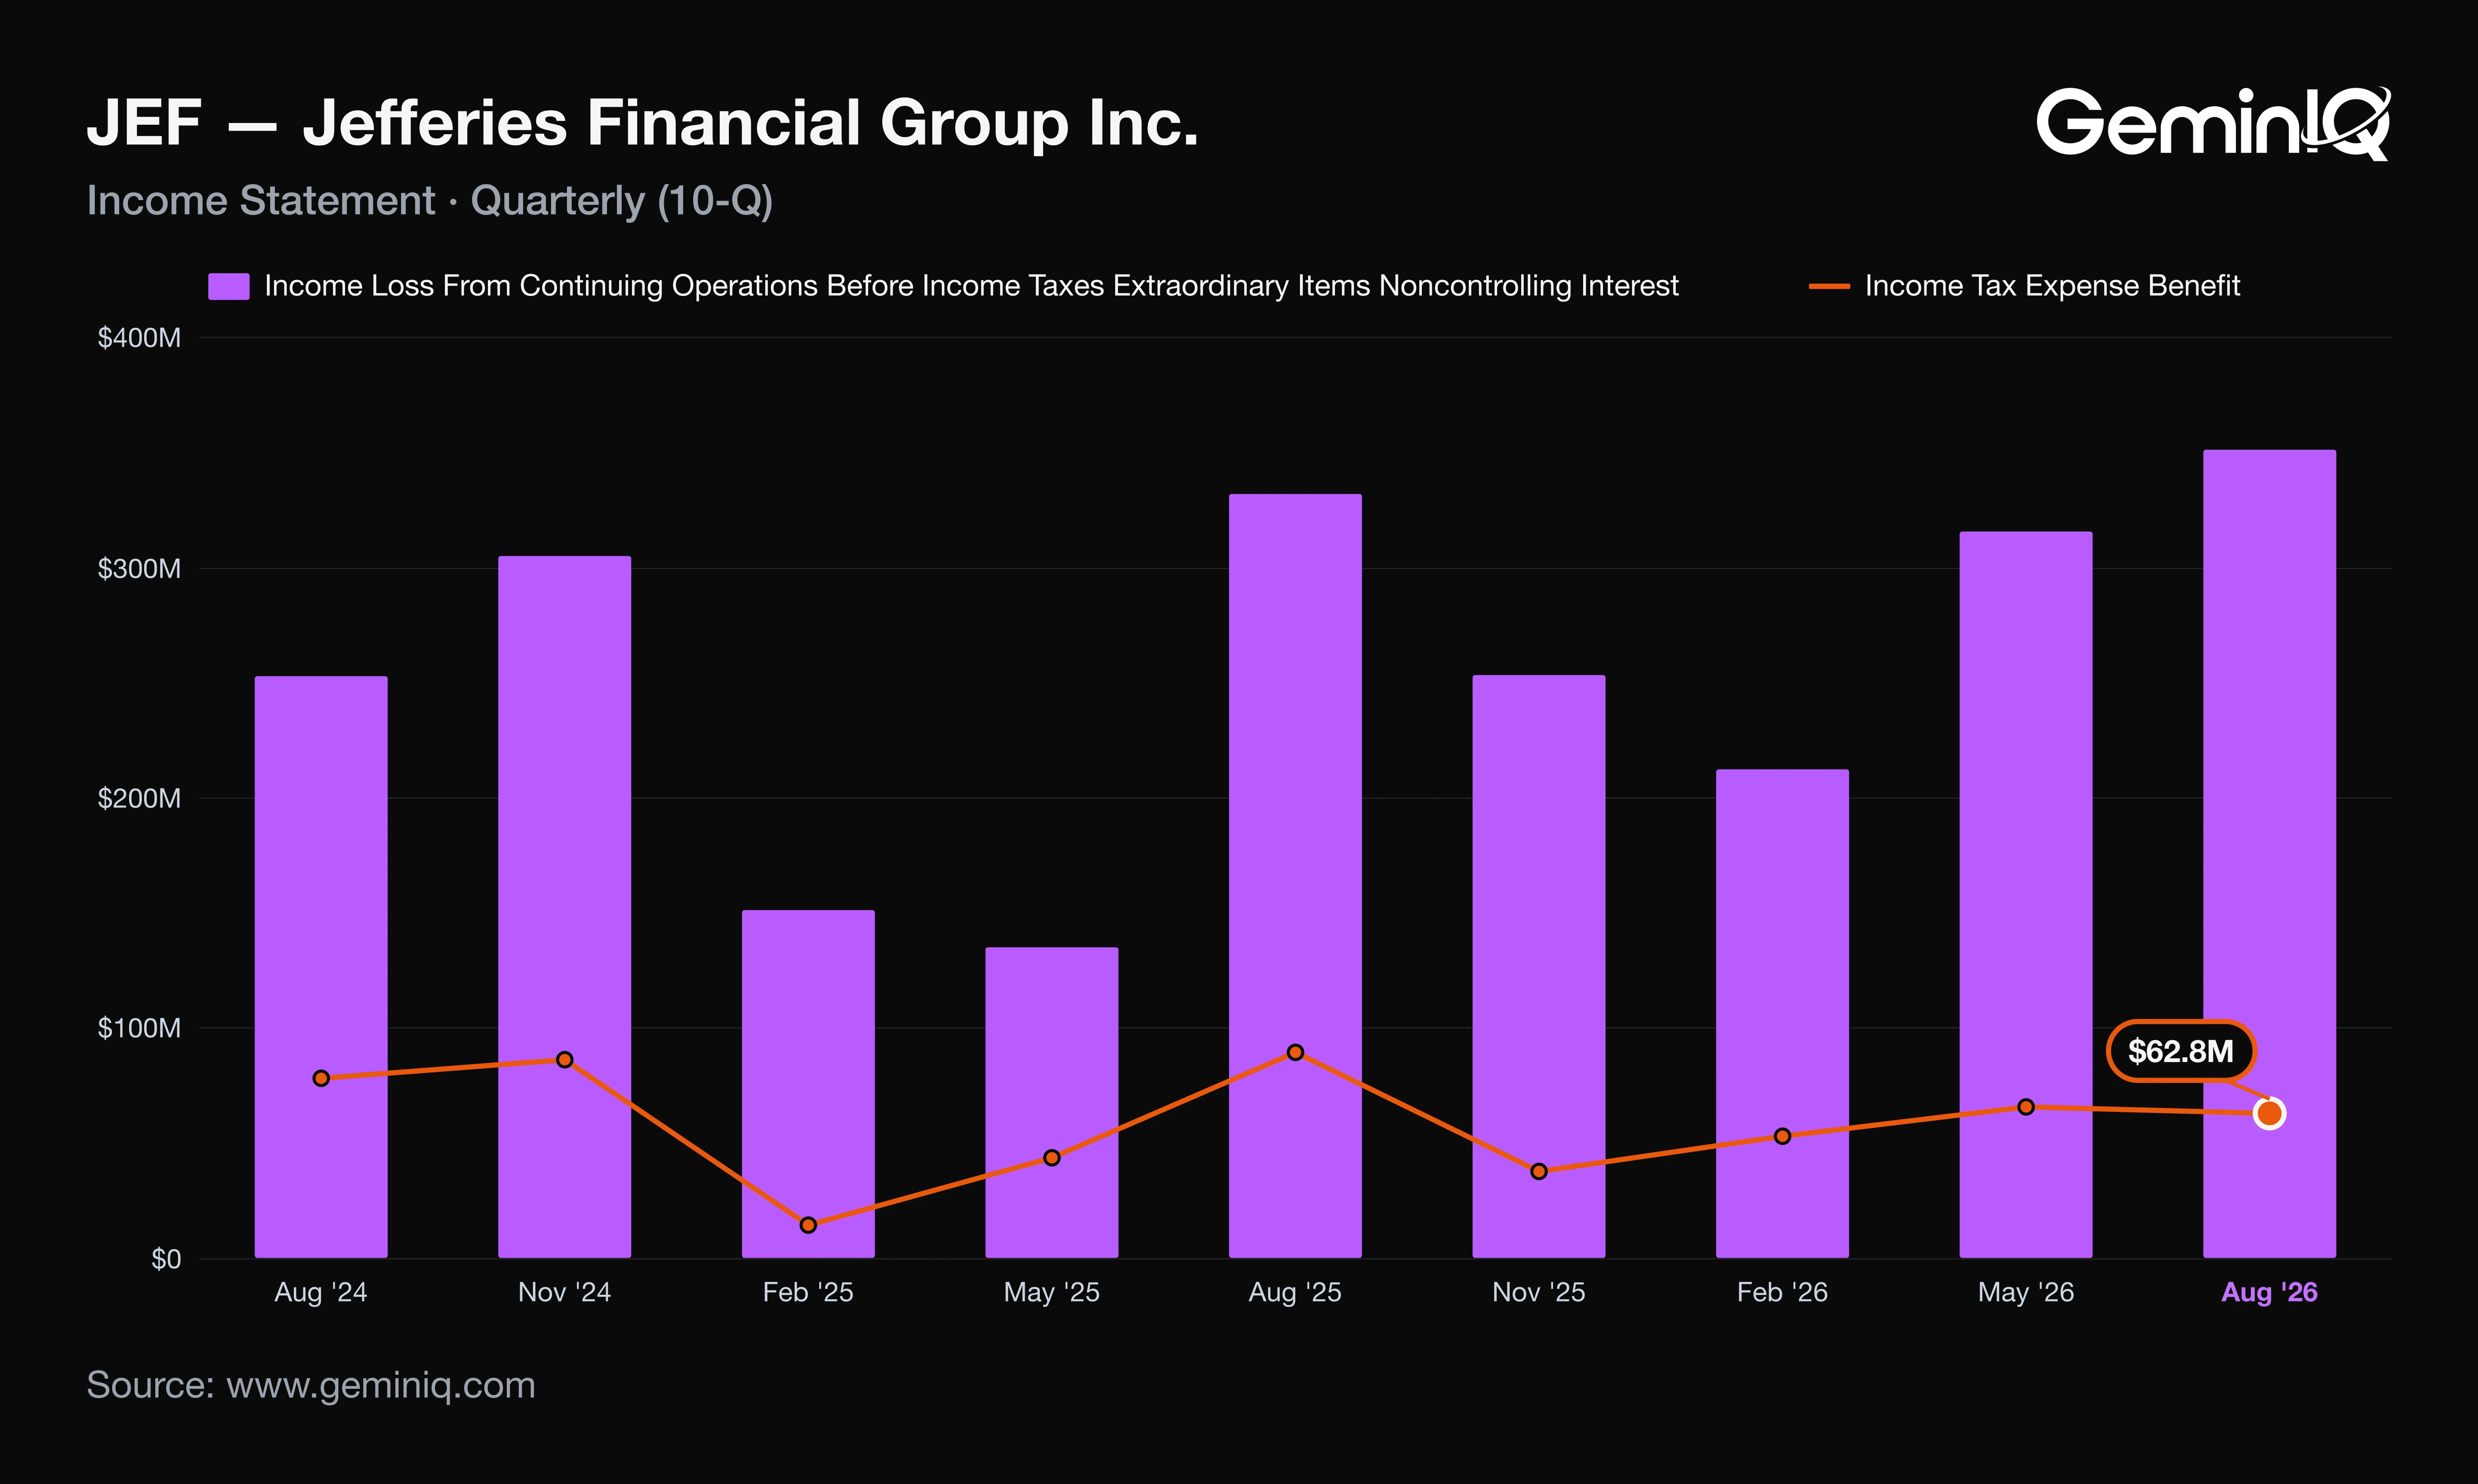
The 10-Q reports net earnings attributable to common shareholders of $283.9 million, $23.3 million above the $260.6 million in the September 28 release. Pretax earnings did not move: $351.0 million in both documents. Tax did.
The Data: Income tax expense in the 10-Q is $62.8 million, against $87.0 million in the release, an effective rate of 17.9% against 24.8% and the 26.9% of Q3 2025. The nine-month rate is 20.6%, against 23.8% a year earlier. Net earnings were $288.3 million, up 18.9%, on pretax growth of 5.8%.
Why: The 10-Q's "Post-Closing Adjustments" section attributes the change to excess tax benefits on share-based awards, which raised the deferred tax asset by $24.2 million and lowered tax expense by the same amount. It credits the lower rate to those benefits, investment tax credits and lower state and local taxes. Had the rate held at last year's 26.9%, tax would have been about $94.4 million and net earnings about $256.6 million, up 5.8%, the same pace as pretax earnings. Roughly $31.6 million of the quarter's profit came from the tax line. The release did label its figures preliminary, so a revision was disclosed in advance; its size, 8.9% of common earnings, was not. The release's $1.08 of diluted EPS predates the adjustment.
Readers who want the method can follow how to read a 10-Q.
Jefferies Q3 2026 Operating Cash Flow, Buybacks and Share Count
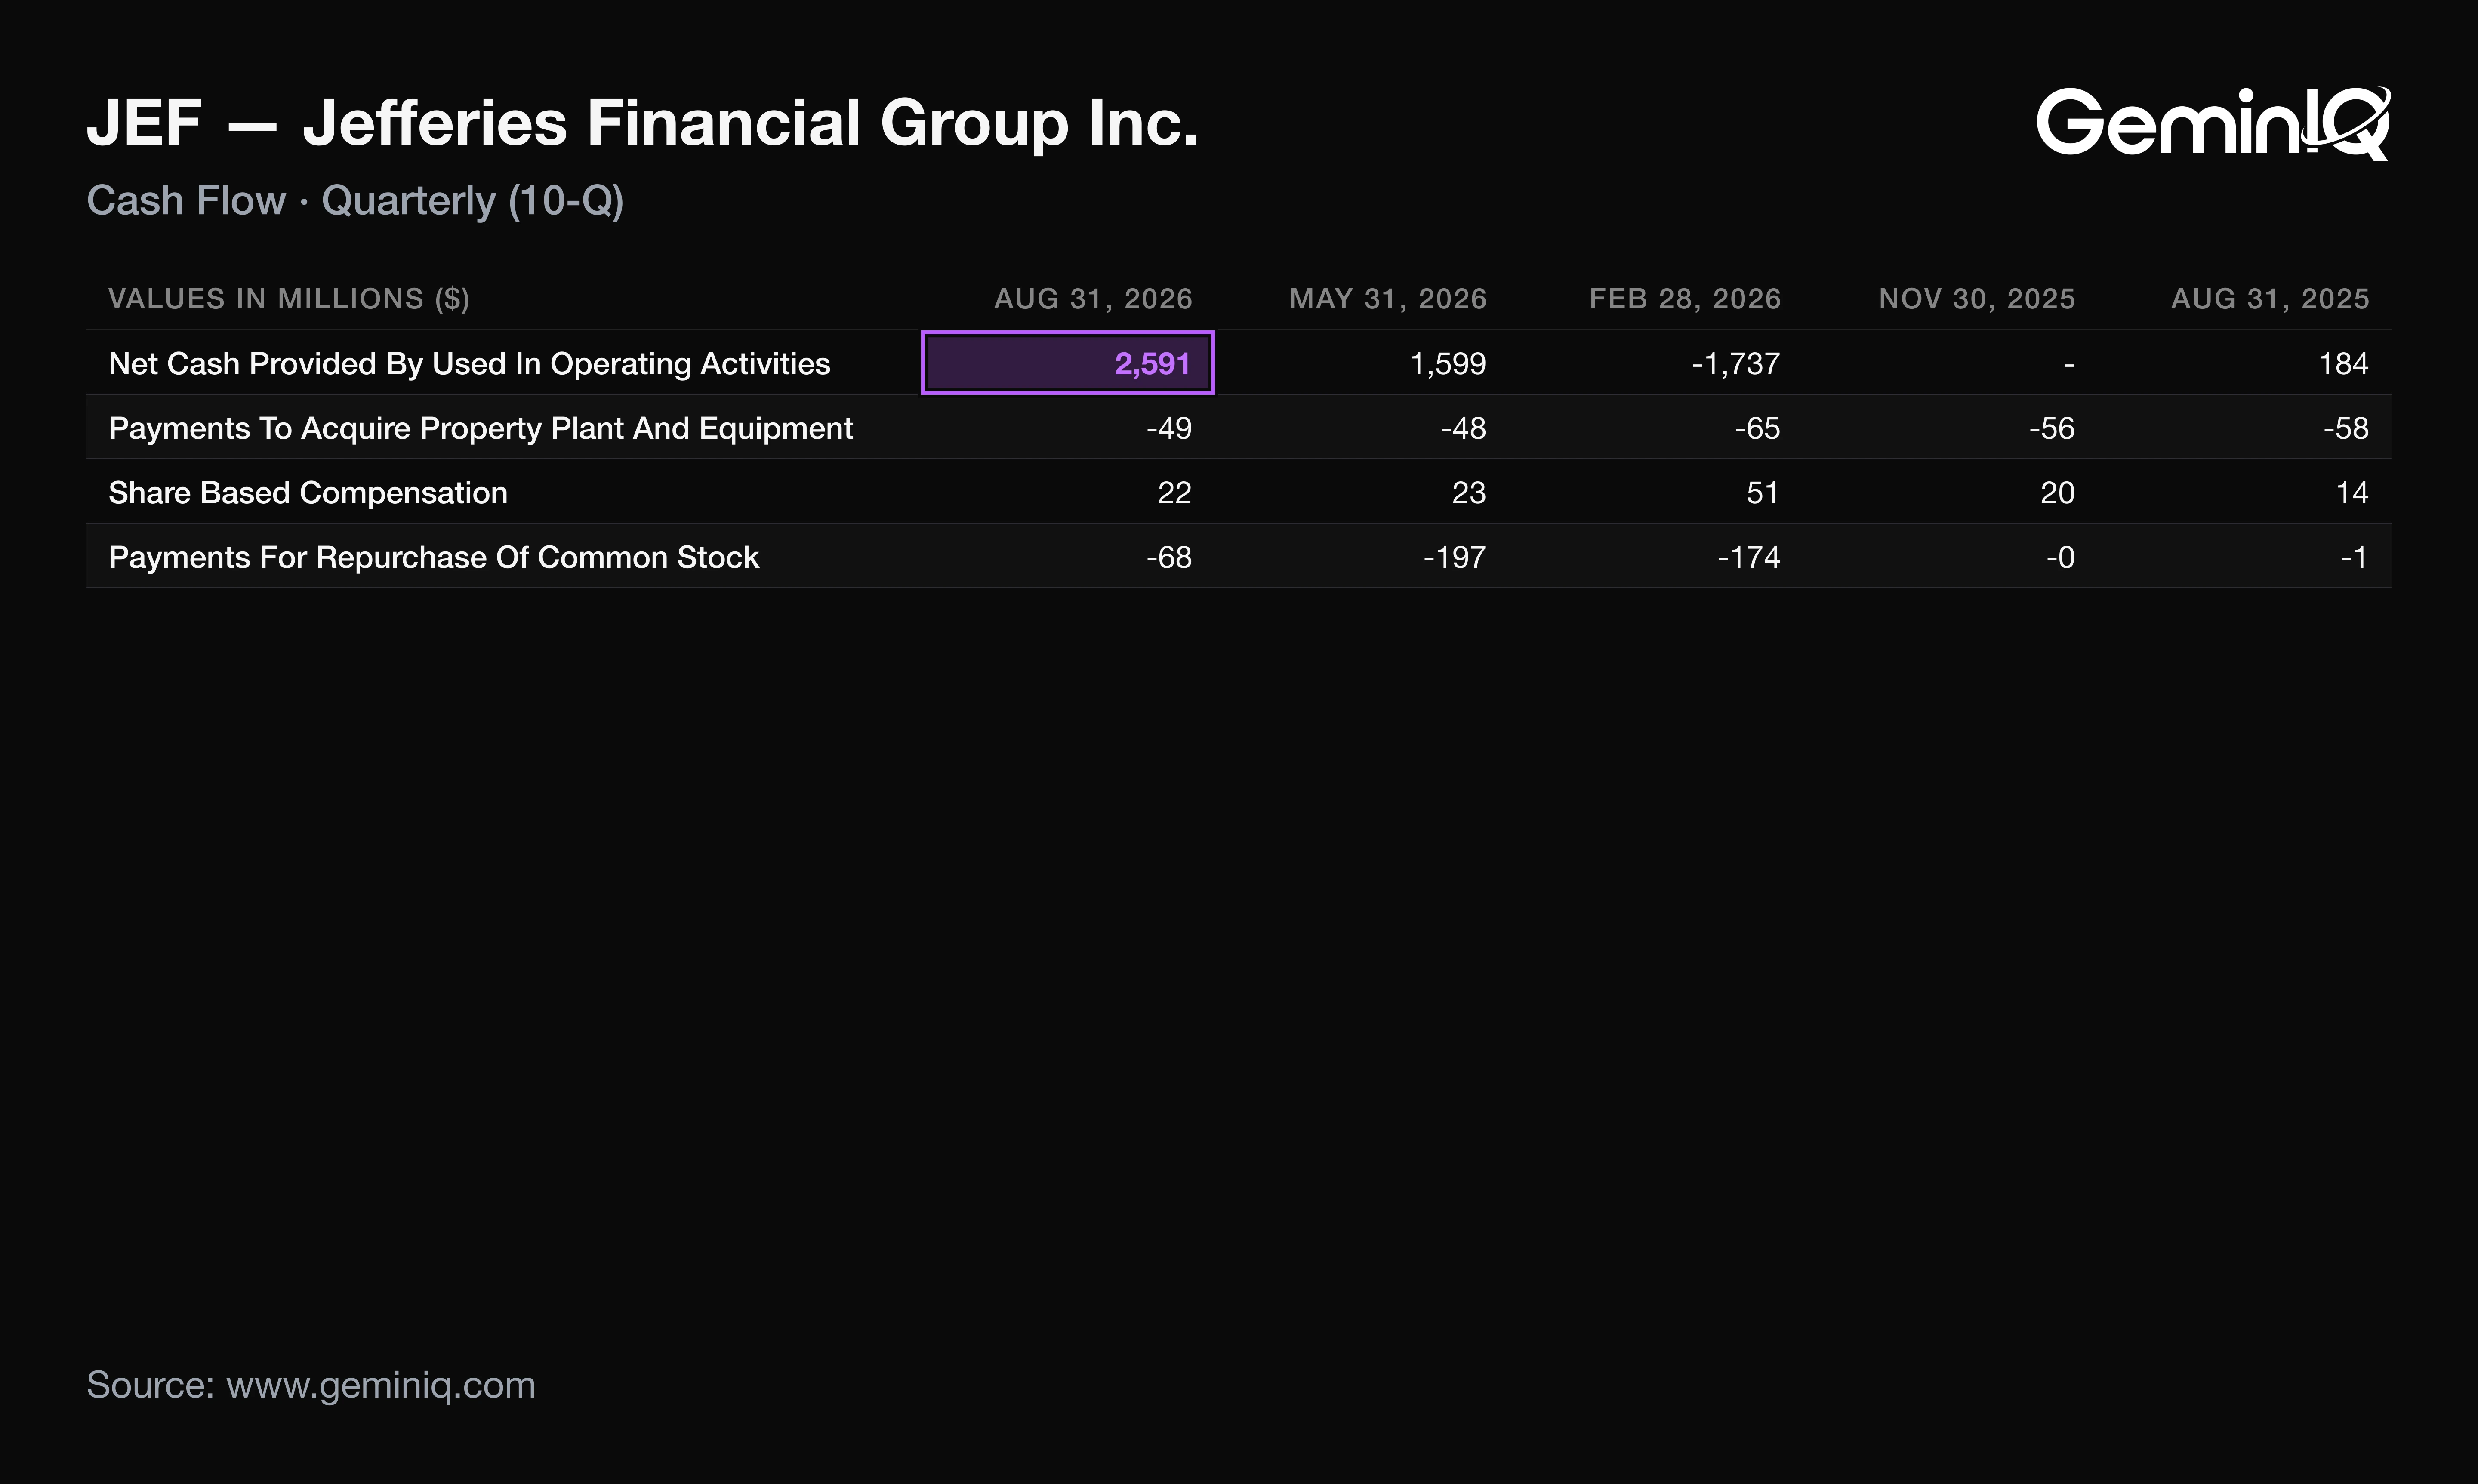
Jefferies' Q3 2026 operating cash flow was $2.59 billion, against $184.2 million a year earlier, the highest of the last 16 quarters and of the 69 quarters since 2009. Net earnings of $288.3 million explain about a ninth of it.
The Data: Operating cash flow was $1.60 billion in Q2 and $4.42 billion over the trailing twelve months, against negative $1.75 billion a year earlier. Capital expenditure was only $49.3 million. Dividends paid were $91.9 million. The company repurchased 1.3 million shares for $70 million in the quarter, and 8.3 million for $441.2 million this year, of which 2.0 million shares and $108.2 million were net-share tax withholding. Shares outstanding were 229.7 million, against 206.3 million at November 30, 2025, a rise of 11%. Long-term debt rose $2.56 billion to $18.46 billion.
Why: For a securities firm, operating cash flow absorbs changes in trading positions and customer balances, so the rest of the $2.59 billion came from non-cash items and operating assets and liabilities, not from earnings. GeminIQ's pre-calculated trailing-twelve-month Free Cash Flow of $4.20 billion is therefore a balance-sheet swing, not a profit figure. On the share count, buybacks did not shrink it: SMBC's preferred shares converted into 27.6 million non-voting common shares on June 30, and SMBC held 19.6% on a fully diluted basis at quarter end. Conversion also cut preferred dividends to $7.1 million from $28.6 million, which is why common earnings rose 26.7% while the release's per-share figure rose 6.9%.
How JEF Stock Has Moved After Past Earnings Reports
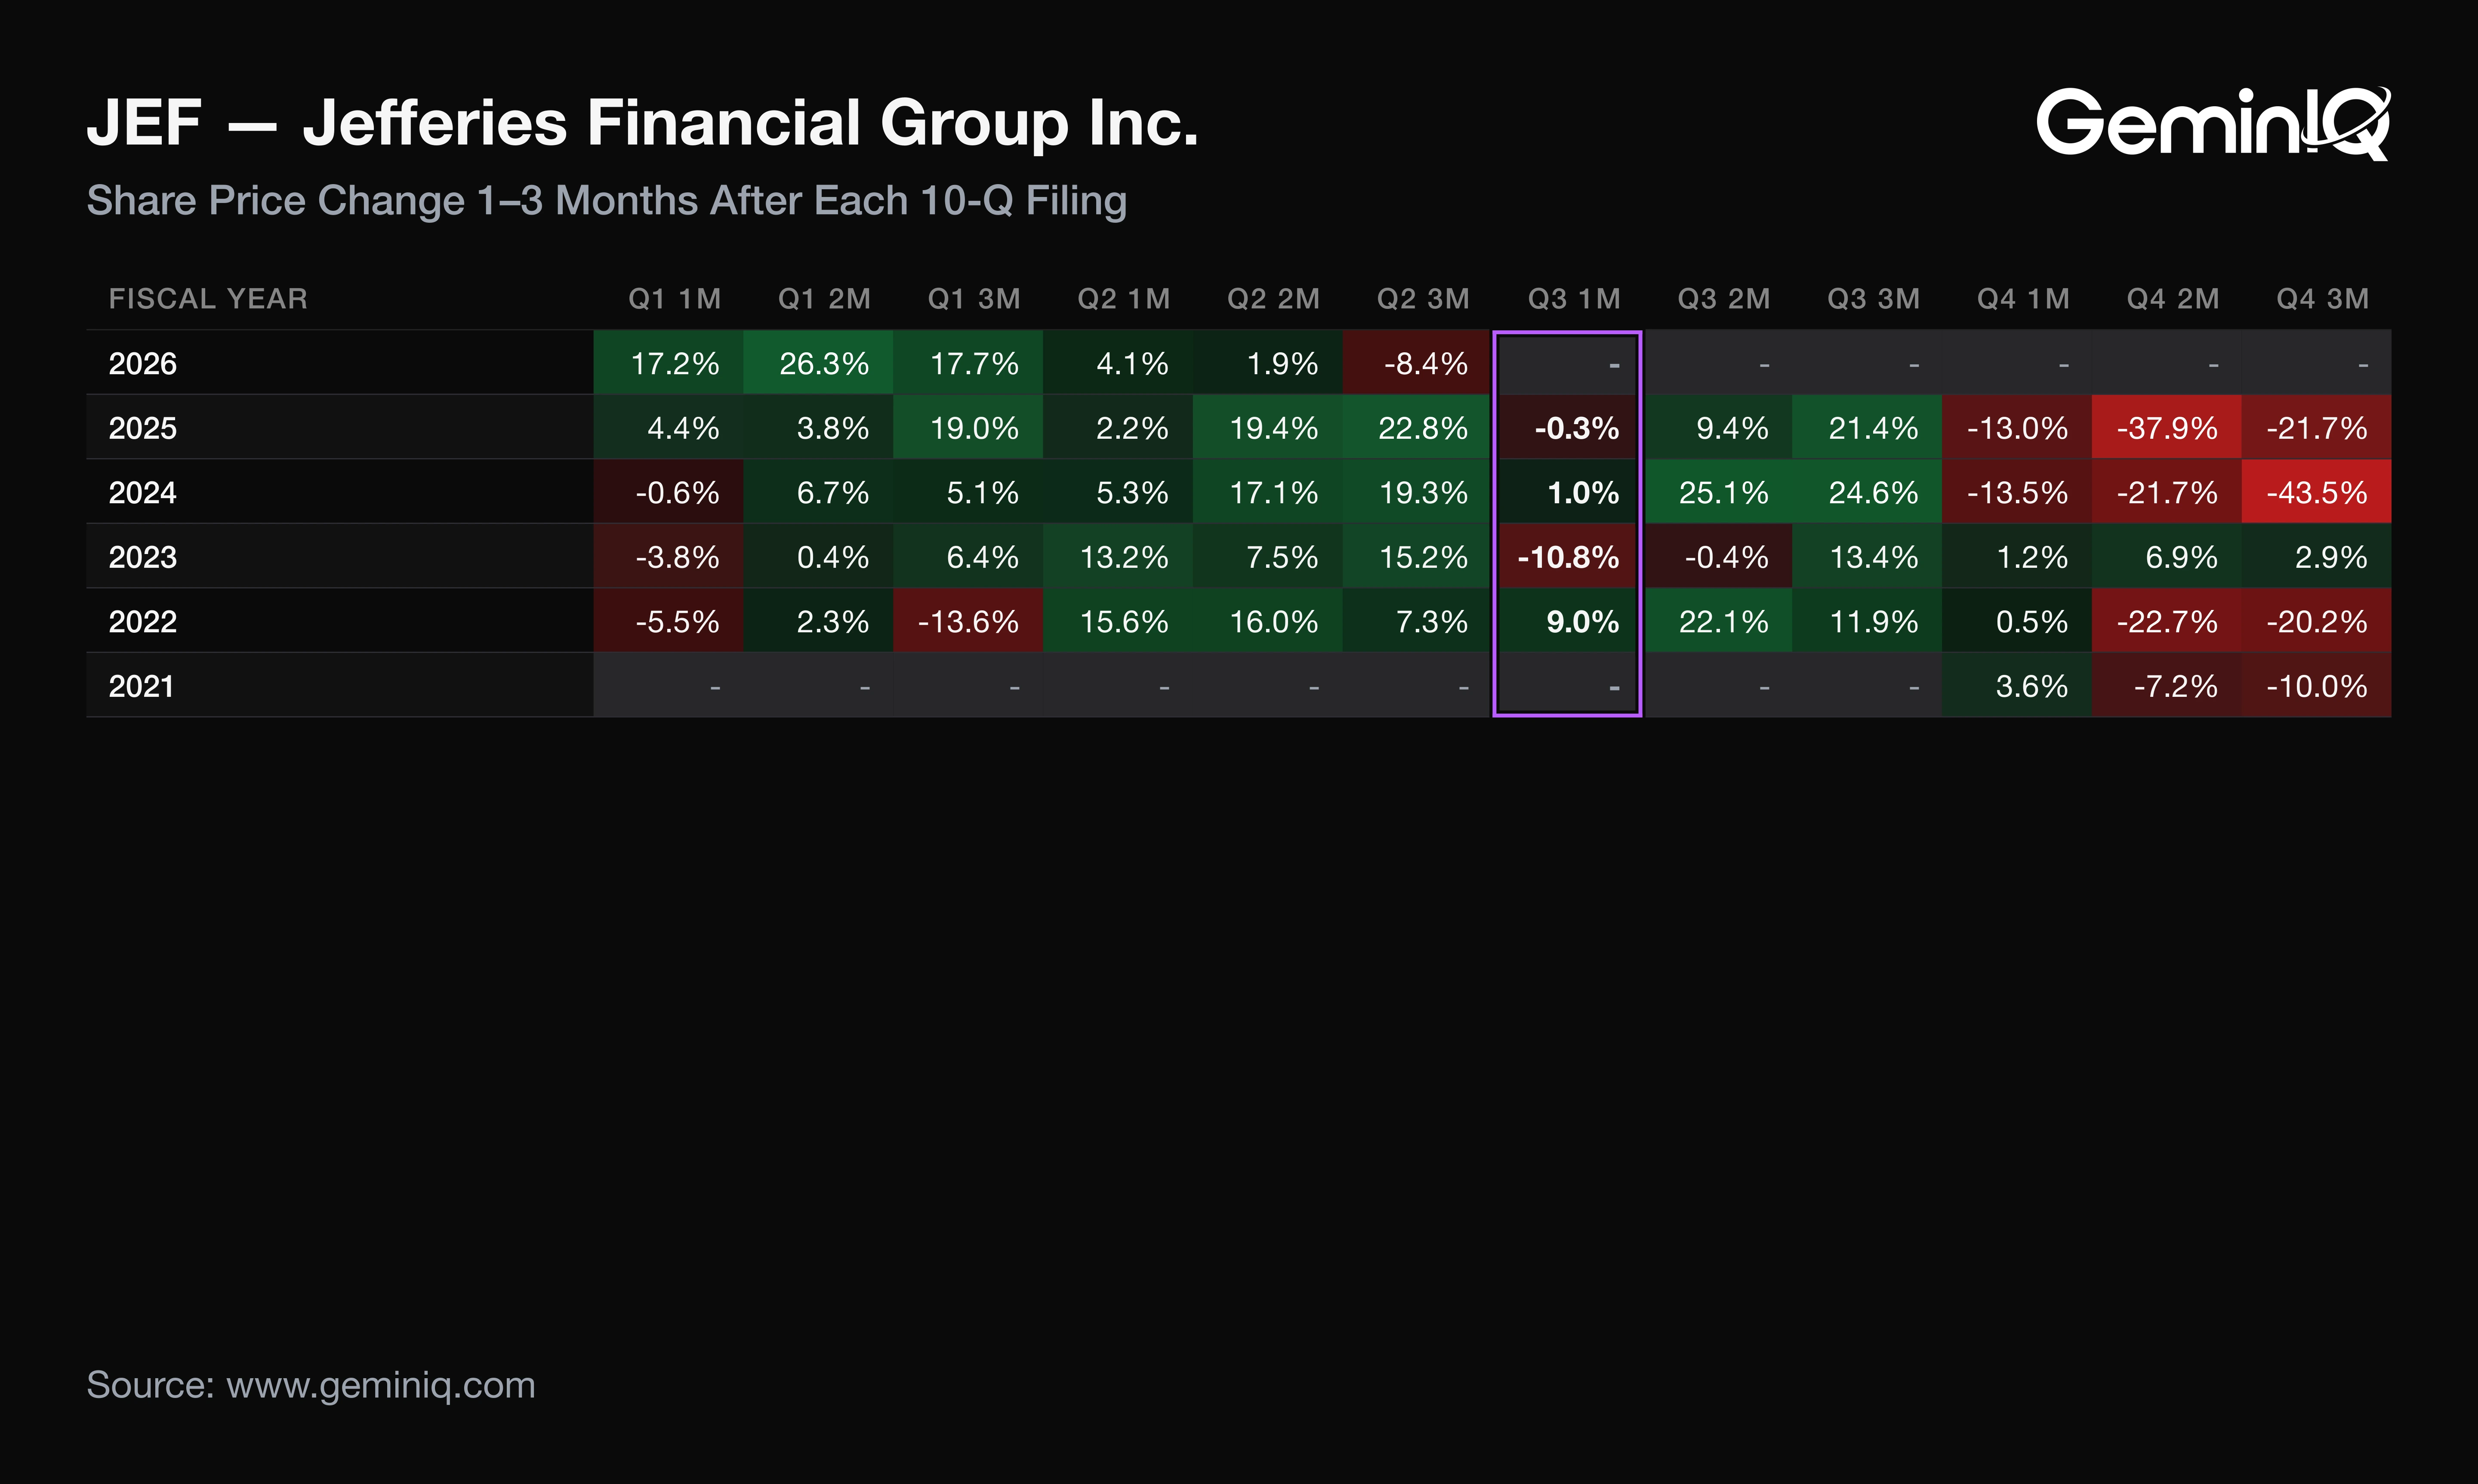
Across Jefferies' last 12 10-Q filings, filed October 6, 2023 to July 9, 2026, the one-month return afterward had a median of +1.1%, positive 7 times. The three-month median was +15.6%, positive 9 times.
The Data: One-month returns ran from -13.5% (filed January 28, 2025) to +17.2% (filed April 7, 2026). Three-month returns ran from -43.5% to +24.6%. After the last three Q3 filings, one-month returns were -10.8%, +1.0% and -0.3%, and three-month returns +13.4%, +24.6% and +21.4%. The new filing's window has not elapsed. GeminIQ's 13F institutional holdings show 64.94% ownership at June 30, 2026, up 0.47 points in a year and the fourth-highest of the last 16 quarters; the September 30 quarter has not been filed yet.
Why: The median is small next to the spread. A one-month median of +1.1% sits inside a range 30.7 points wide, so the typical filing was followed by little, and the extremes were large. These figures describe how Jefferies' stock moved after its past filings; they are a historical association, not a forecast. The Earnings Reaction Heat Map lays out each window, and GeminIQ's earnings-reaction study covers the pattern more broadly.
Past reactions describe how the stock moved; what the next filing's tax line does is a separate fact, and a release dated before the 10-Q can only preview it.
Frequently Asked Questions
When does Jefferies report earnings?
Jefferies released Q3 2026 results on September 28, 2026 and filed its 10-Q on October 9, 2026. Last year it filed its fourth-quarter results on January 28, 2026, and the year before on January 28, 2025. That is a filing pattern, not a forecast of the next date.
Does Jefferies pay a dividend?
Yes. Jefferies paid $91.9 million in dividends in the quarter ended August 31, 2026 and $370.0 million over the trailing twelve months, up 2.2% from $362.2 million. Per its 8-K, the board declared $0.40 per share, payable November 25, 2026 to holders of record on November 16.
Is Jefferies profitable?
Yes. Jefferies earned $288.3 million in the quarter and $697.6 million in the first nine months of fiscal 2026. GeminIQ's pre-calculated Net Profit Margin was 7.47% over the trailing twelve months, against 6.48% a year earlier, and trailing ROIC was 7.12%, against 5.43%.
What was Jefferies' Q3 2026 revenue?
Jefferies' Q3 2026 total revenues were $3.23 billion, up 11.1%, and net revenues after interest expense were $2.22 billion, up 8.5%. Nine-month total revenues were $9.22 billion, against $7.87 billion a year earlier.
Wall Street's data. Main Street's price.
Institutional terminals charge thousands a year for as-filed accuracy. GeminIQ gives you the same thing for a fraction of the cost: financials built directly from raw SEC EDGAR filings, not third-party APIs, with full XBRL traceability back to the original 10-K or 10-Q. No normalized guesswork, just calculated metrics, charts, screeners, and watchlists built on numbers exactly as the company reported them. Start researching now at GeminIQ.com.
All financial figures cited in this article reference Jefferies Financial Group Inc.'s Q3 2026 10-Q (filed October 9, 2026, period ending August 31, 2026), with guidance and management commentary drawn from the company's Form 8-K earnings release (filed September 28, 2026). All SEC filings are publicly available at SEC EDGAR and SEC EDGAR.
Disclaimer: The content in this blog is for educational and entertainment purposes only and does not constitute financial, legal, or tax advice. Investing involves risk, including the loss of principal. The views expressed are my own and not intended as financial advice or a guarantee of future performance.