
KB Home (KBH) Q3 2026 Earnings: EPS Down 35%, Cash Flow -$135M

By Chad Hartman
Published · Last updated
KB Home (KBH) reported Q3 2026 revenue of $1.30 billion, down 20% year over year, and diluted EPS of $1.05, down 35%, for the quarter ended August 31, 2026; the earnings release came September 22 and the 10-Q was filed October 8. The 10-Q's cash flow statement carries what the release's tables do not: operating cash flow of -$135.4 million, the second-lowest of the last 16 quarters, in a quarter that reported $65.3 million of net income. Buybacks and dividends totaled $65.2 million anyway, with $415.0 million of credit-facility borrowings outstanding.
| Field | Value |
|---|---|
| Company | KB Home ($KBH) |
| Quarter | Q3 FY2026, period ended August 31, 2026 |
| Earnings release | September 22, 2026 (Form 8-K) |
| 10-Q filed | October 8, 2026 |
| Revenue | $1.30 Billion (-20.0% YoY) |
| Diluted EPS | $1.05 (-34.8% YoY) |
| Operating margin | 5.2% (-2.9 pts YoY) |
| Operating cash flow (TTM) | $74.96 Million |
| Operating cash flow (quarter) | -$135.4 Million |
KB Home Q3 2026 Revenue, EPS and Margins
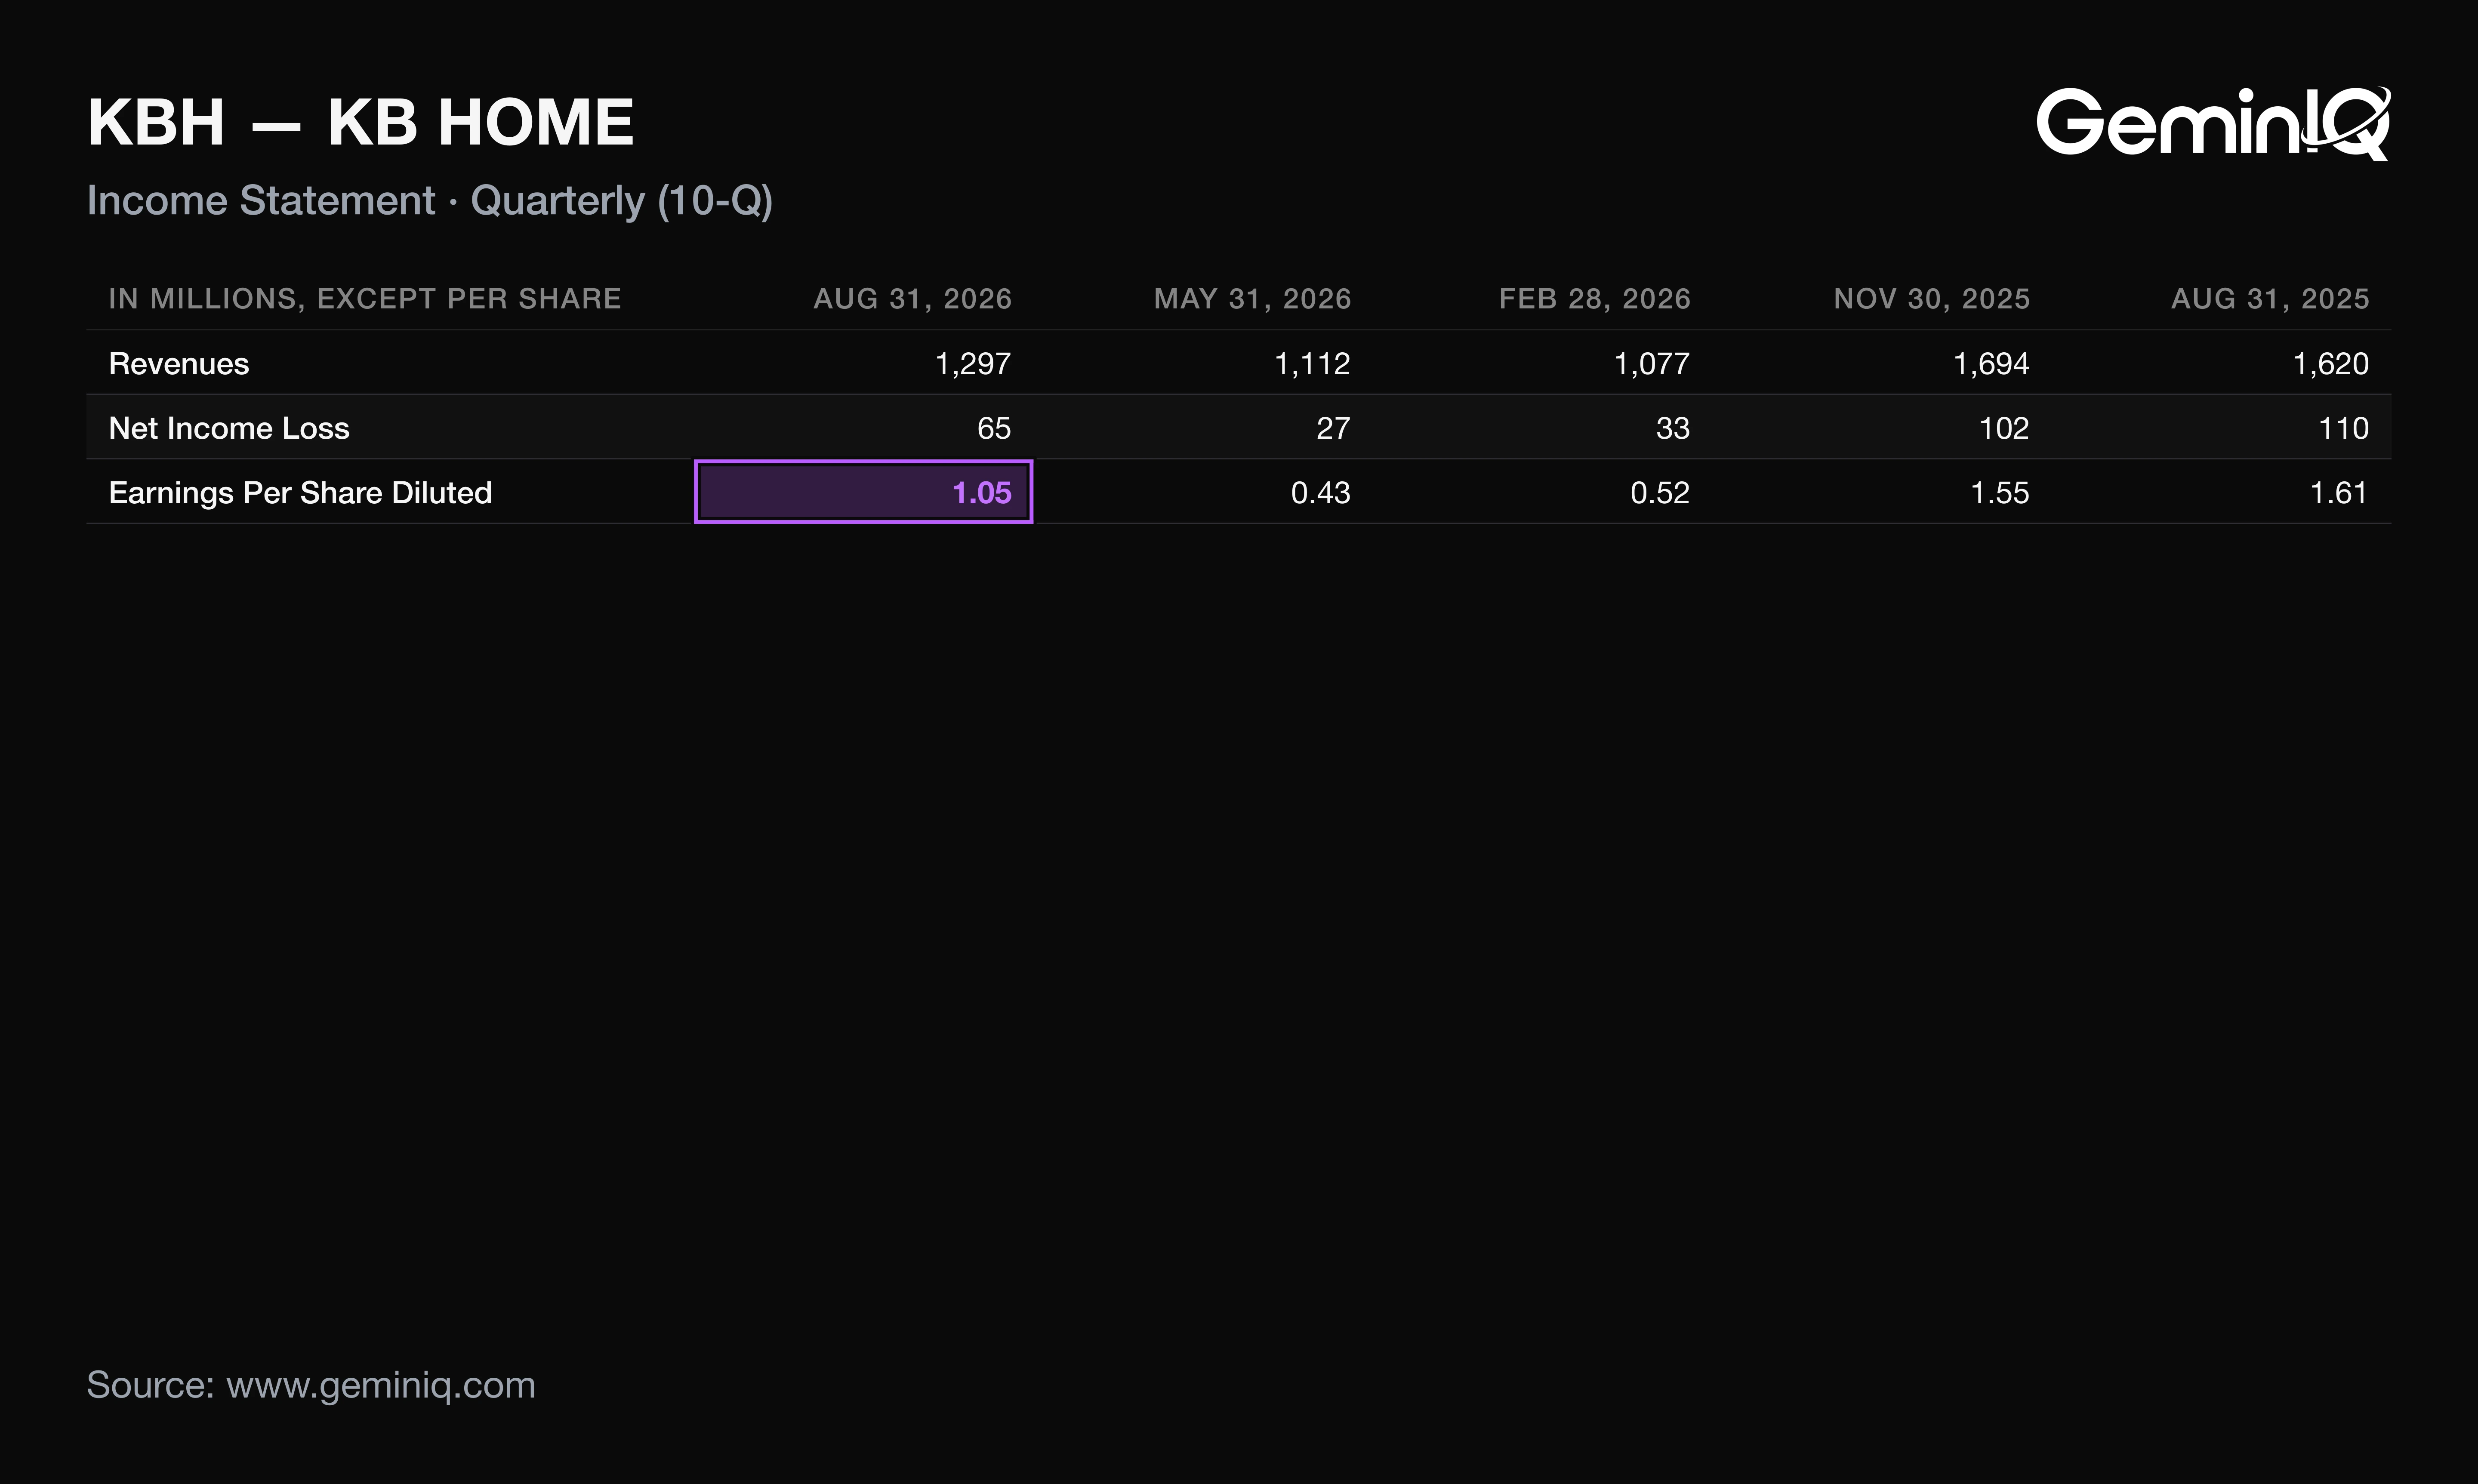
KB Home's Q3 2026 diluted EPS was $1.05, down 34.8% from $1.61 a year earlier and up from $0.43 in Q2, the third-lowest of the last 16 quarters. EPS fell less than the earnings behind it, and two items outside operations did the cushioning.
A reader who saw EPS fall 35% would expect net income to have fallen about as much. Instead it fell 40.6%.
The Data: Revenue was $1.30 billion, down 20.0% and the third-lowest of the last 16 quarters, on 2,732 homes delivered (down 19%) at an average selling price of $473,000 against $475,700. Pretax income fell 43% to $81.2 million, including a $3.5 million gain on the sale of an equity investment. Net income was $65.3 million, a net margin of 5.0%. Diluted shares were 61.76 million, down 8.8% and the lowest of the last 16 quarters, and the effective tax rate was 19.6% against 23.3% (8-K). Housing gross margin was 16.5% against 18.2%; SG&A rose to 11.3% of housing revenues from 10.0%.
Why: Volume, not price, drove revenue. The 10-Q attributes the margin slide to pricing pressure, higher relative land costs and reduced operating leverage, and the 8-K attributes the lower tax rate to excess tax benefits from stock-based compensation. Had the tax rate held at 23.3%, net income would have been about $62.3 million and EPS about $1.01. The smaller share count supplied roughly six points of the gap between the 40.6% net income decline and the 34.8% EPS decline. The tax cushion is a one-quarter item: the company guided its Q4 rate to about 26%.
What KB Home's Q3 2026 10-Q Adds on Operating Cash Flow
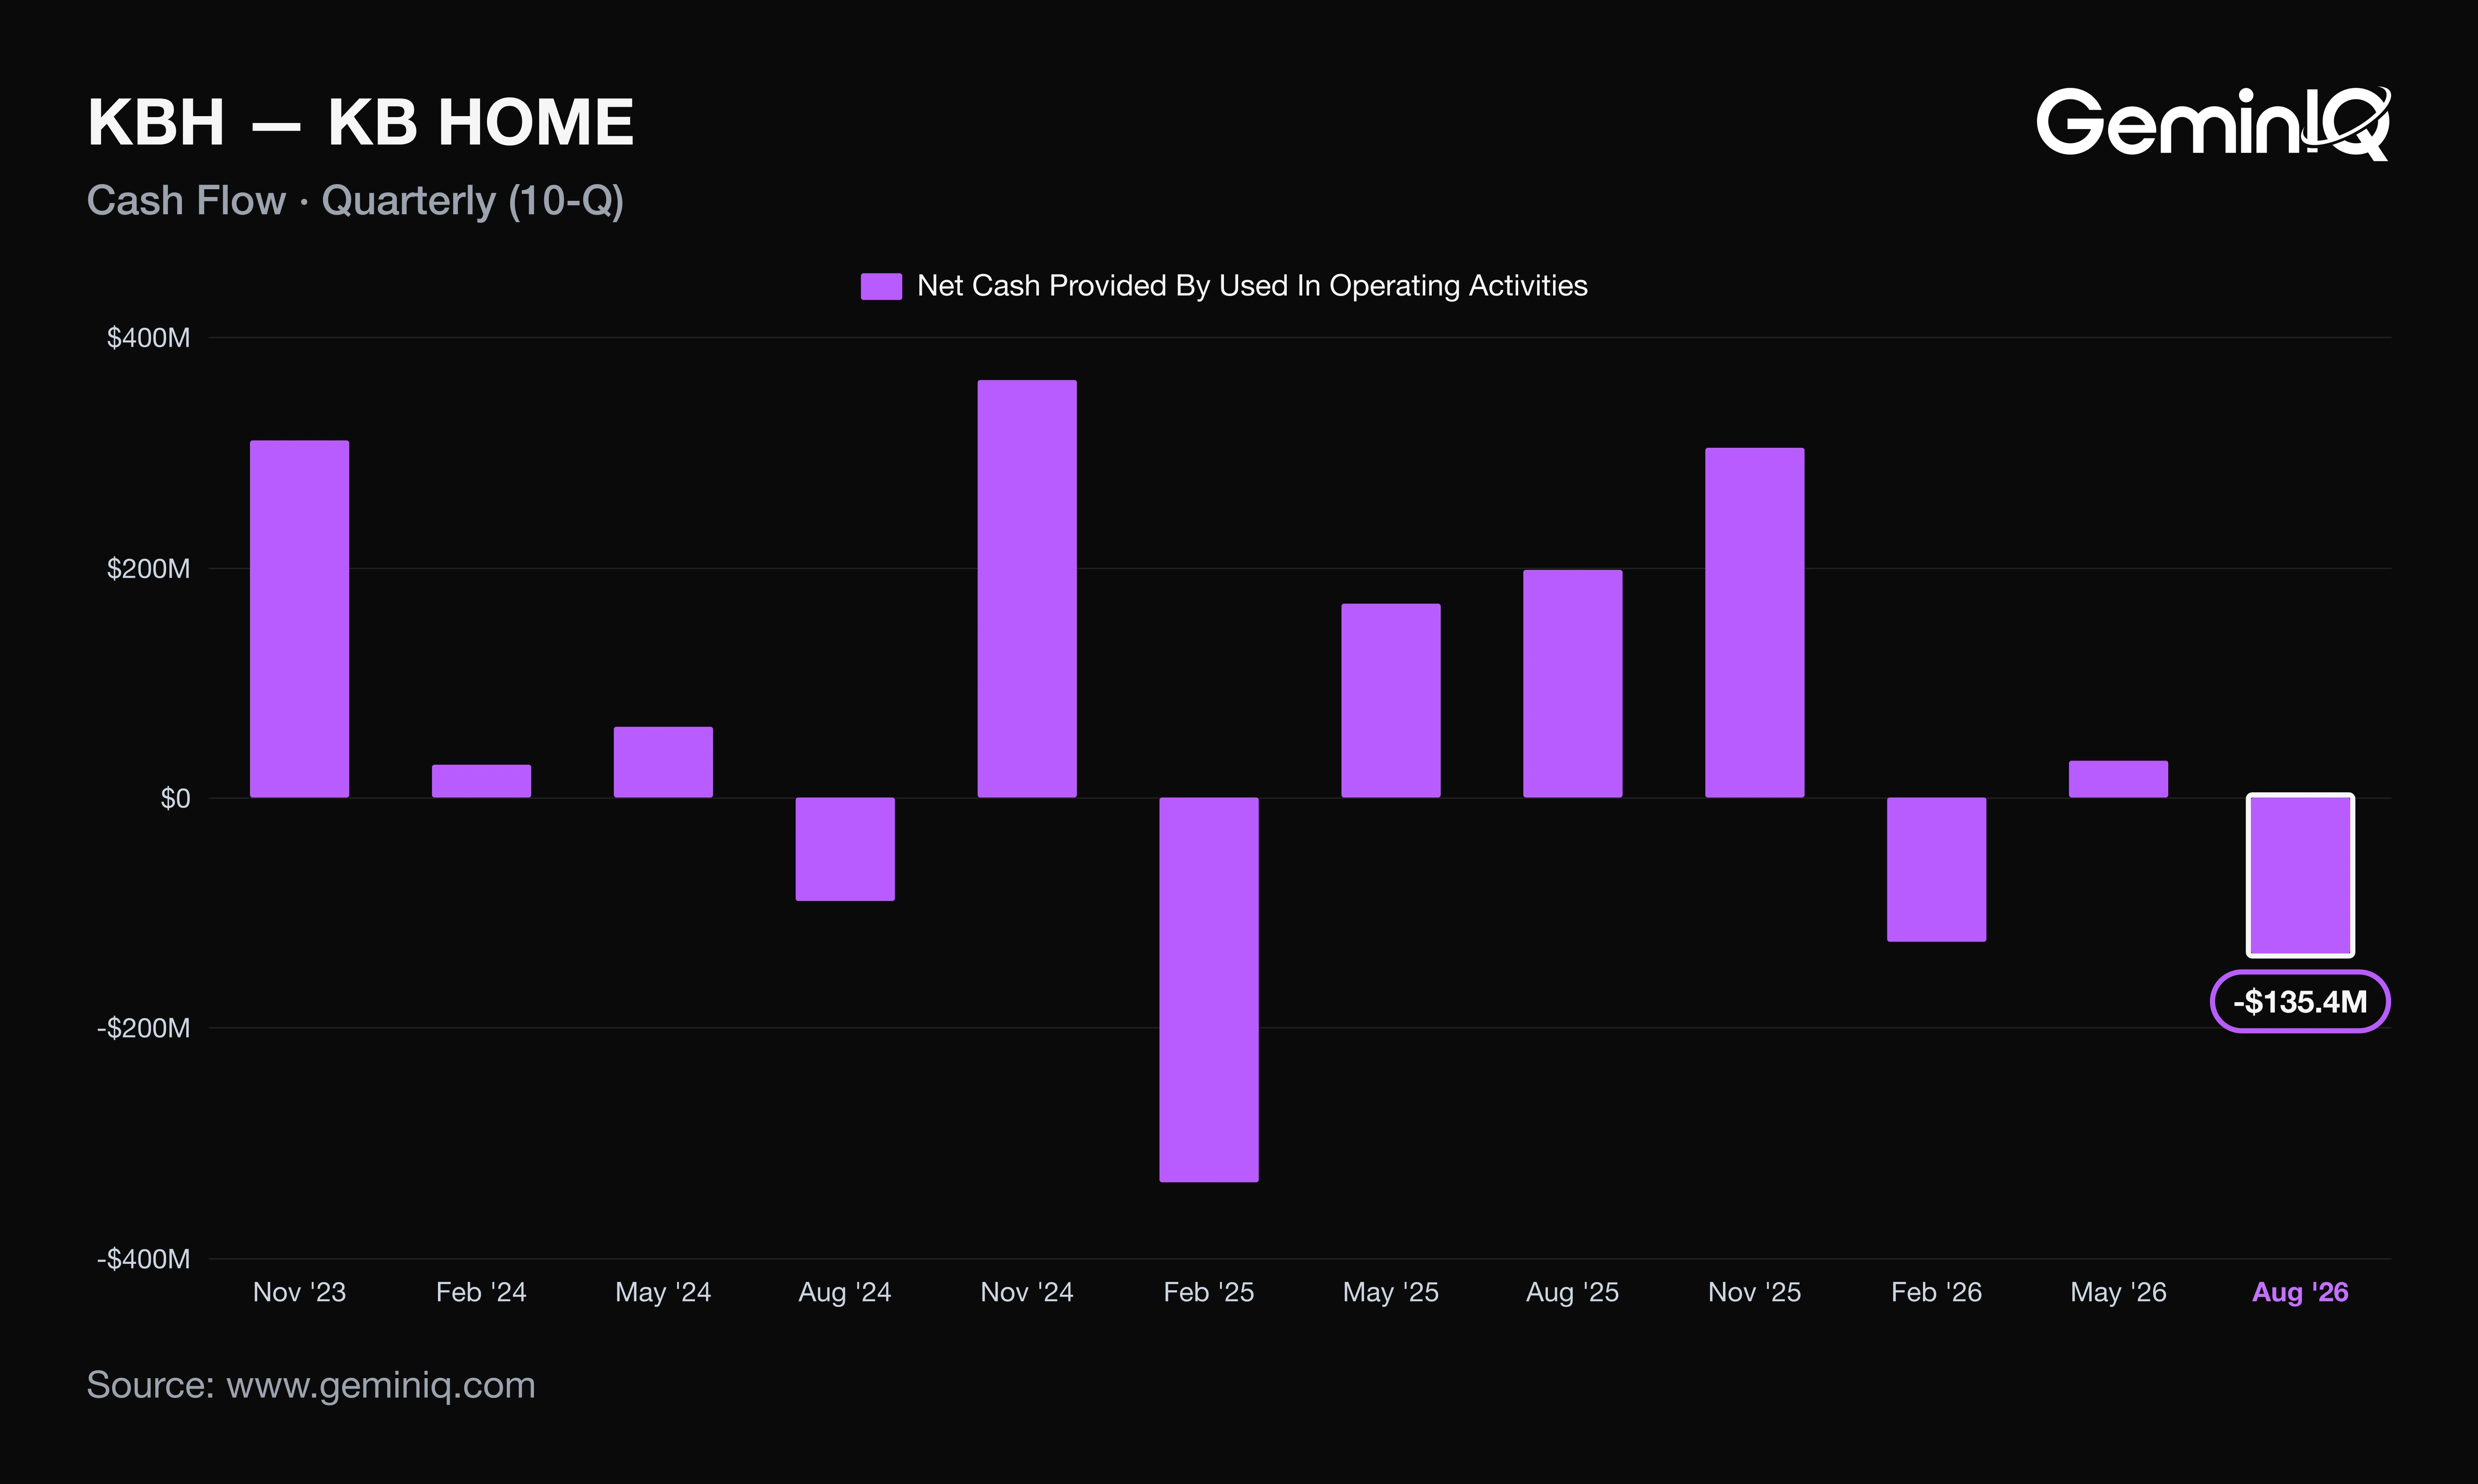
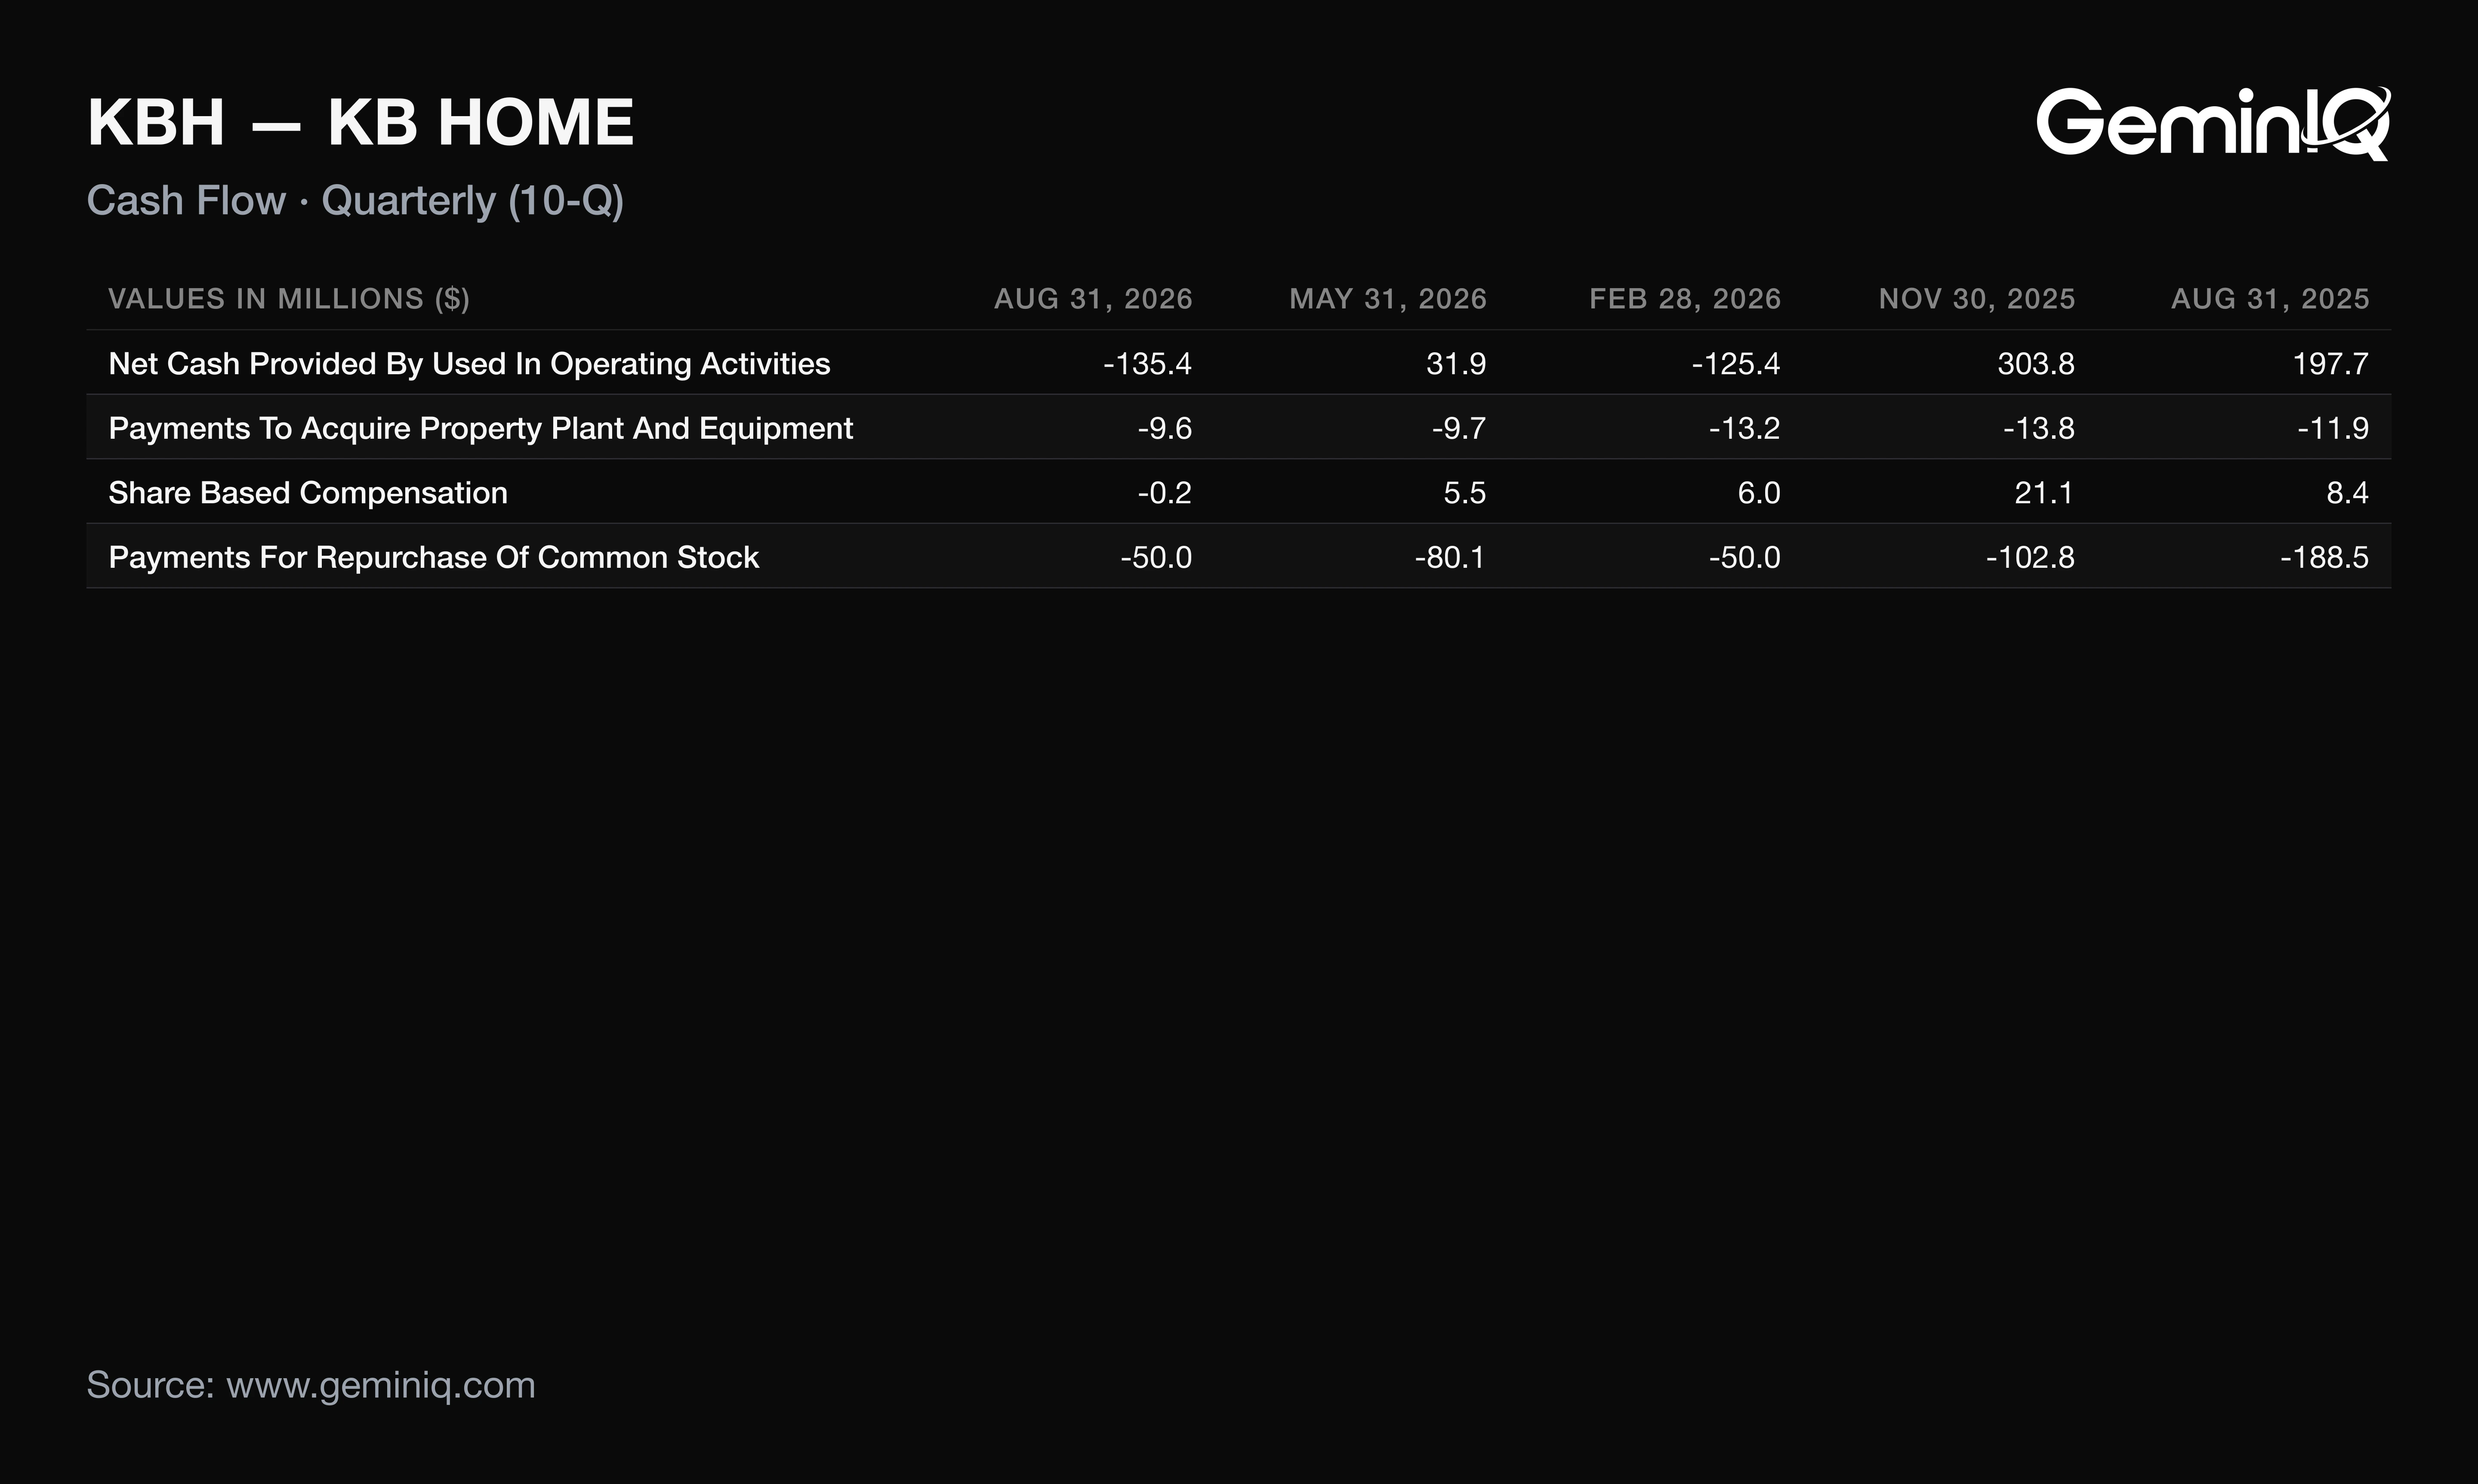
KB Home's Q3 2026 operating cash flow was -$135.4 million, against +$197.7 million a year earlier, and free cash flow (operating cash flow less $9.6 million of capital expenditure) was -$145.0 million. The release led with revenue and EPS and carries no cash flow statement; the 10-Q shows the quarter's earnings went into land.
Negative operating cash flow is ordinary for a homebuilder buying lots: this quarter was the 13th-lowest of 65 quarters since August 2010, so twelve were lower.
The Data: Trailing-twelve-month operating cash flow was $75.0 million, down 81.0% from $394.5 million, and GeminIQ's pre-calculated Free Cash Flow fell to $28.7 million from $349.8 million. Investment in land and land development was $722.3 million, up 40% year over year, inside a nine-month total of $1.79 billion that is down 8%. Notes payable stood at $2.11 billion against $1.69 billion at November 30, 2025, and the debt-to-capital ratio was 35.7% against 30.3% (8-K). Against that, the company repurchased $50.0 million of stock and paid $15.2 million of dividends, $65.2 million in all.
Why: Net income is income recognized on 2,732 deliveries; the cash for replacement lots left in the same quarter, and the credit facility covered the gap. The $415.0 million drawn matches the roughly $416 million rise in notes payable. The benign reading is supported: ending backlog value rose 3% to $2.05 billion, the first year-over-year increase in four years, per the company. Repurchases already fell from $188.5 million in the year-earlier quarter, yet the share count kept shrinking on the strength of earlier buybacks. Payouts equaled the quarter's net income while free cash flow was negative.
KB Home's 2026 Guidance After Q3
KB Home's Q3 2026 housing revenues of $1.29 billion landed inside the $1.20 billion to $1.35 billion the company guided in its prior-quarter 8-K, and so did every other metric it guided. Deliveries of 2,732 sat inside 2,600 to 2,800, the 16.5% housing gross margin inside 16.0% to 16.6%, the 19.6% tax rate inside 19% to 21%, and 277 ending communities inside 270 to 280.
The Data: SG&A at 11.3% of housing revenues sat at the favorable edge of its 11.3% to 11.9% range, and all six metrics landed in the favorable half of their ranges. The 8-K says full-year deliveries, housing revenues and margins remain within the ranges last provided. The housing revenue range now runs $4.90 billion to $5.10 billion, from $4.90 billion to $5.30 billion, and the gross margin range is 16.0% to 16.2%, from 16.1% to 16.5%, a floor below the old one. For Q4, the company guided 3,000 to 3,500 deliveries and housing revenues of $1.45 billion to $1.65 billion.
Why: Q4 deliveries of 3,000 to 3,500 equal 68% to 80% of the 4,398 homes in ending Q3 backlog. Q3 delivered 60% of its beginning backlog, against 71% a year earlier, a decline the 10-Q ties to the shift toward Built to Order homes, which stay in backlog until delivered. The guidance therefore asks for faster backlog conversion than Q3 delivered, and at the top end more than a year ago.
How KBH Stock Has Moved After Past Earnings Reports
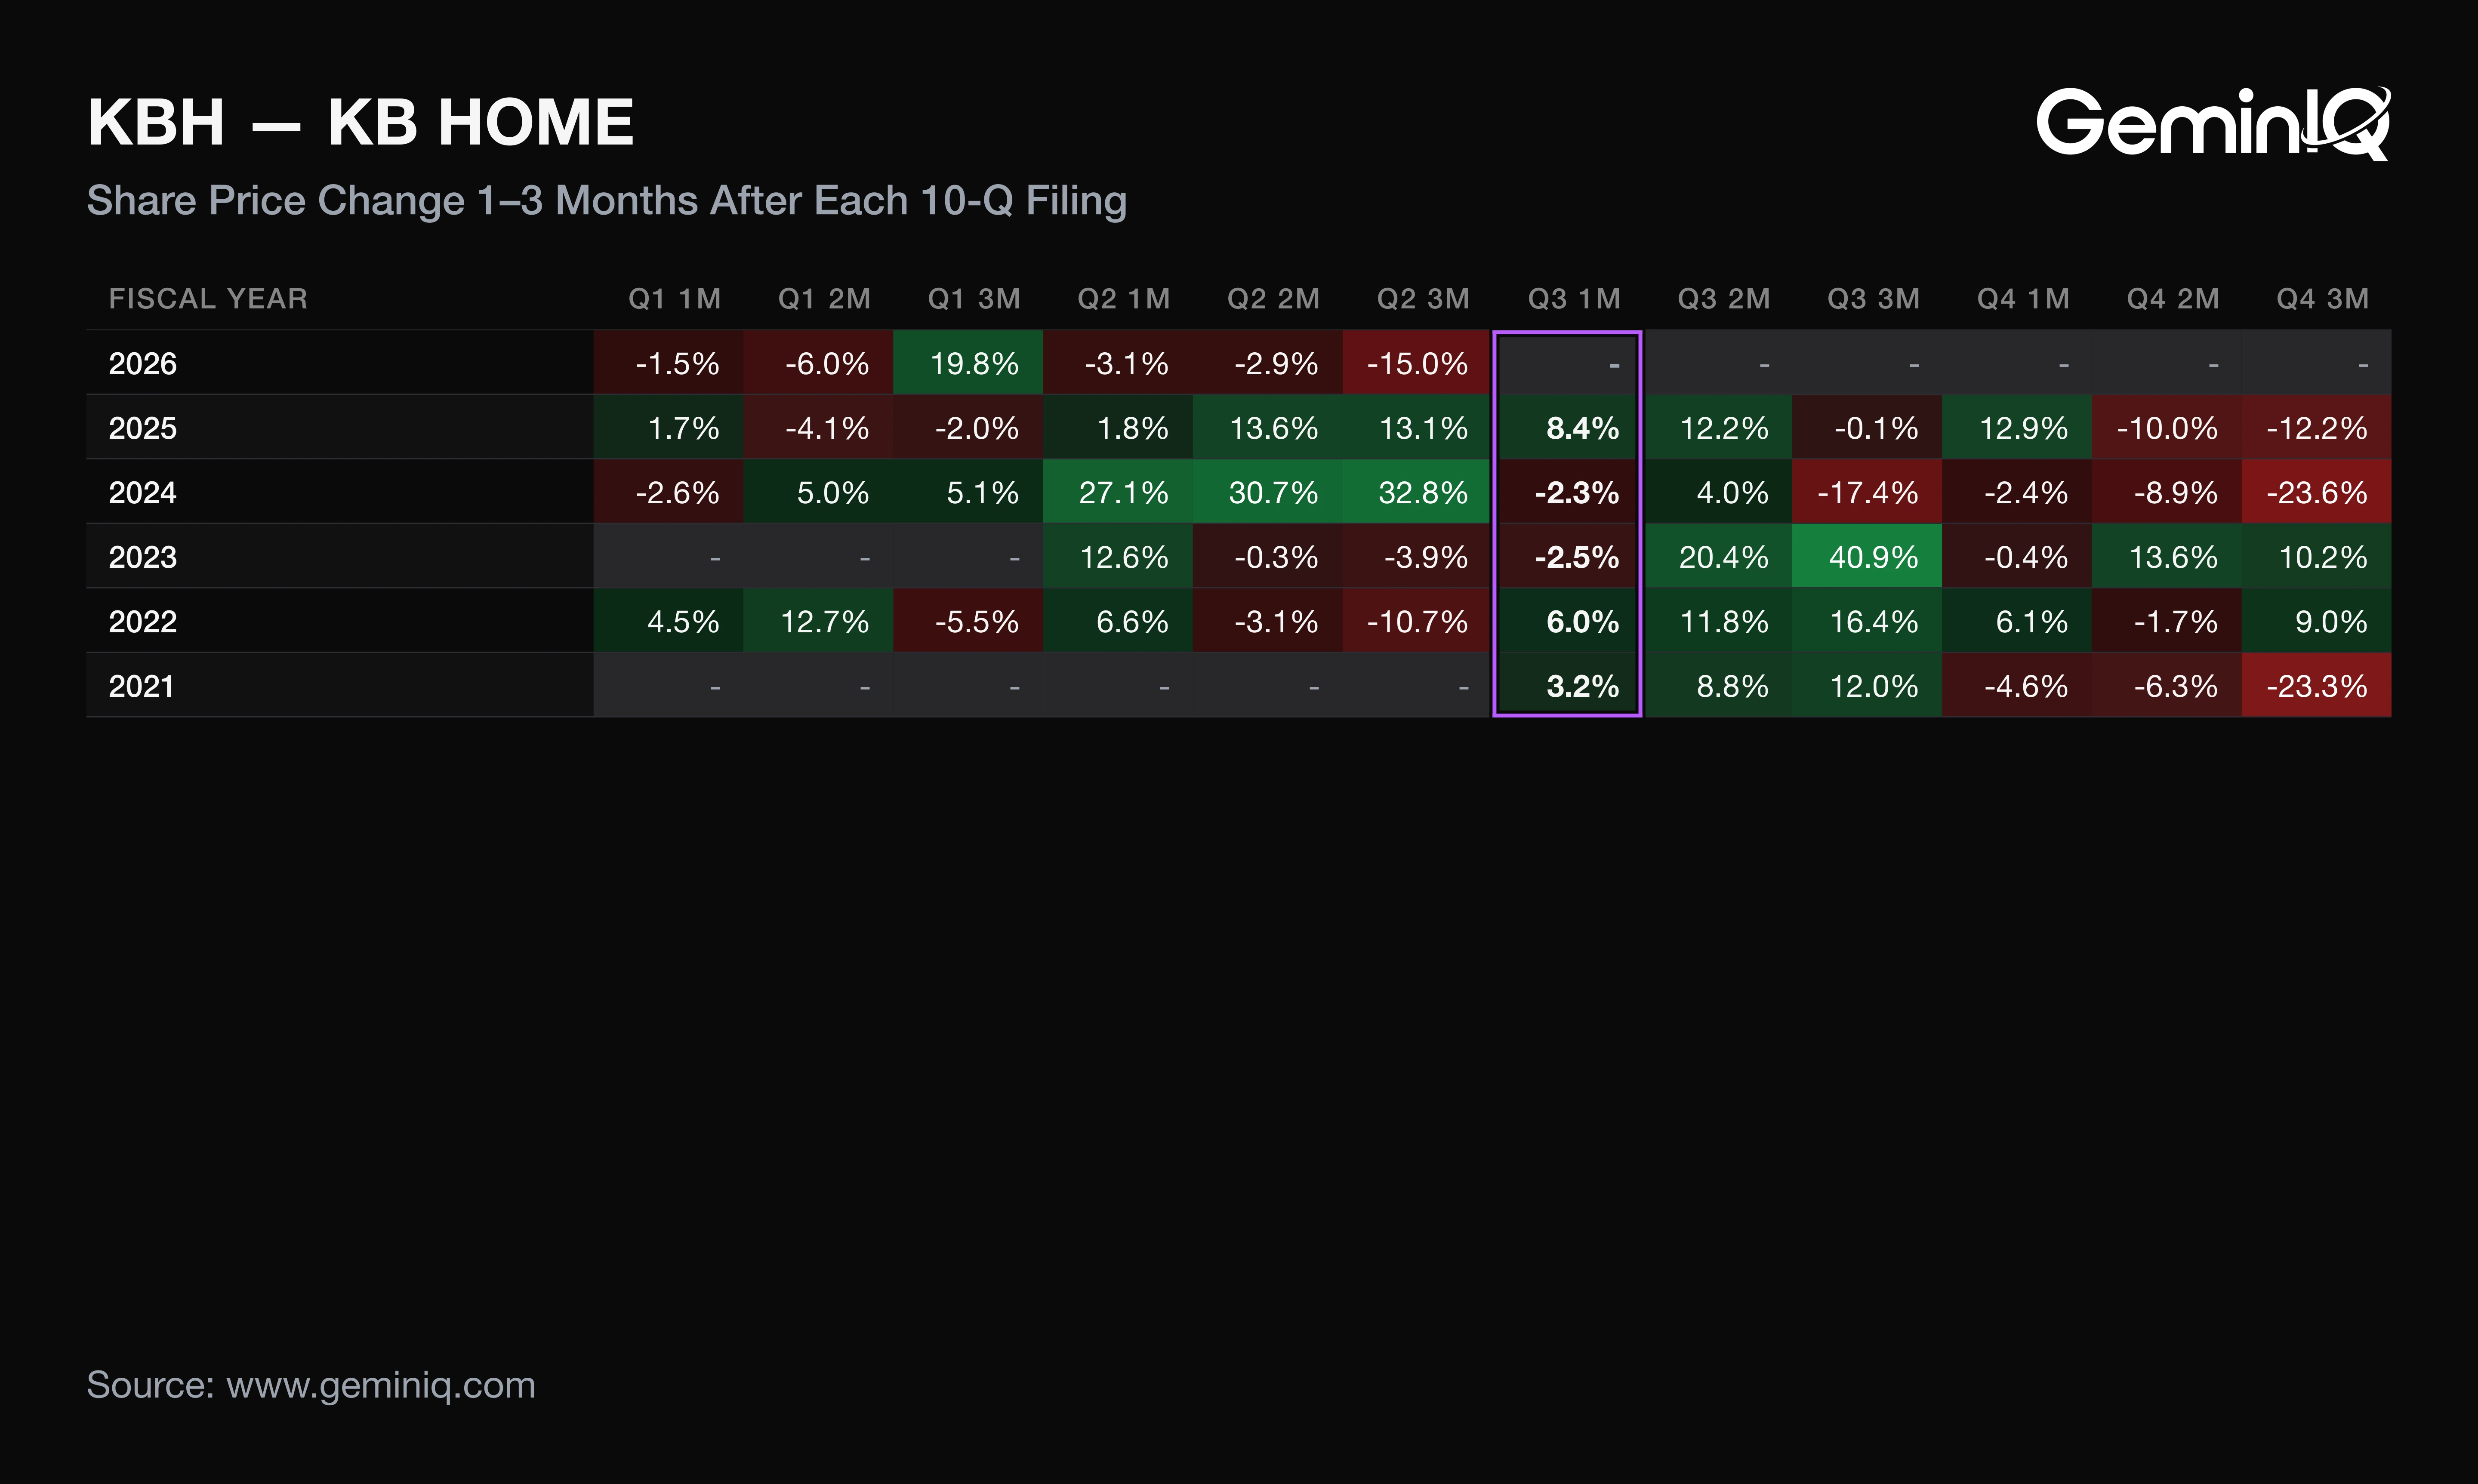
After KB Home's last 12 10-Q filings with a completed one-month window (filed October 2023 to July 2026), the median one-month return was -0.9% and the return was positive after 5 of 12. The three-month median was +2.5%, positive after 6 of 12.
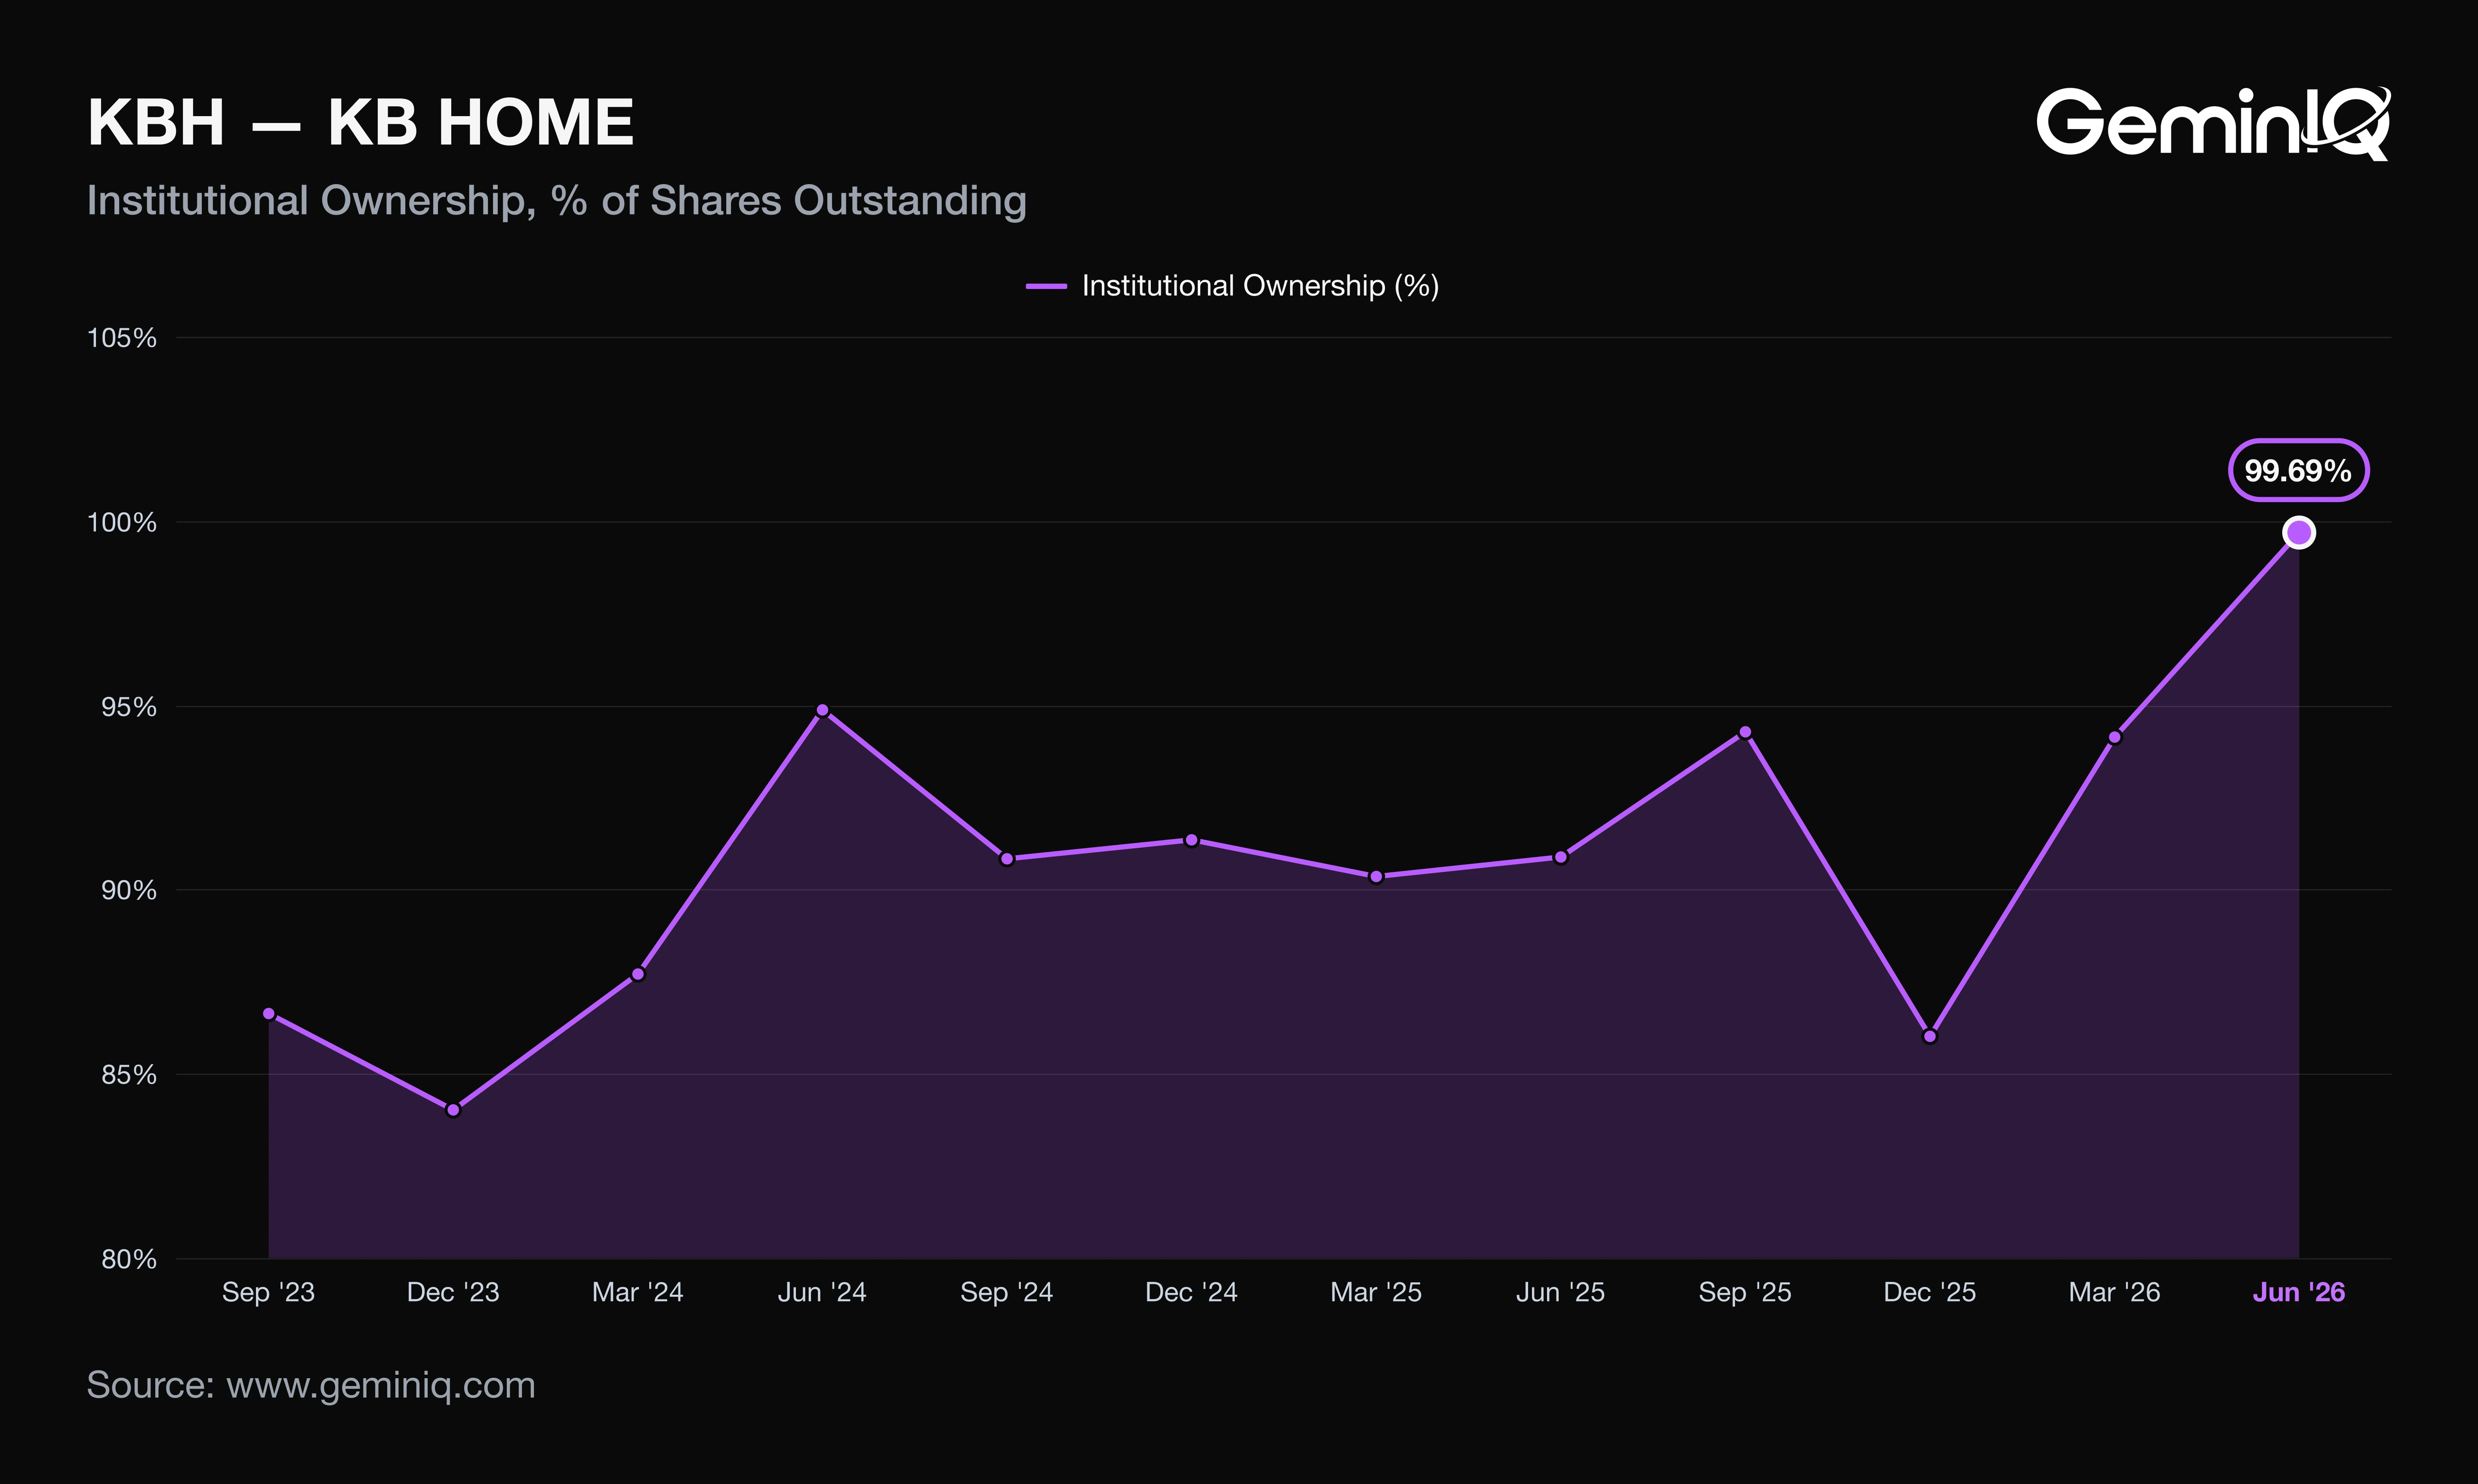
The Data: Three-month returns ran from -23.6% to +40.9%, a wider spread than the median suggests. After the last three Q3 filings, one-month returns were -2.5%, -2.3% and +8.4%, and three-month returns were +40.9%, -17.4% and -0.1%. This filing's window has not elapsed. Institutional ownership, from SEC Form 13F filings, was 99.69% at June 30, 2026 (61.60 million of 61.79 million shares), up from 90.88% a year earlier and the highest of the last 16 quarters.
Why: A soft first month has not been a guide to the third: in two of the three past Q3 filings the one-month and three-month signs differed. The history comes from the Earnings Reaction Heat Map, and it is a historical association over past filings, not a forecast. At 99.69%, KBH's reported holder base has little room left to grow.
Any quarter where shareholder payouts track reported earnings while free cash flow is negative is being financed by the balance sheet, and the debt line in the next 10-Q shows how long that lasts.
Frequently Asked Questions
When does KB Home report earnings?
KB Home released Q3 2026 results on September 22, 2026 and filed its 10-Q on October 8, 2026, 16 days later. Last year the company filed its fourth-quarter results on January 23, 2026, which is a filing-record pattern, not a forecast of the next date.
Is KB Home doing well financially?
KB Home is profitable but earning less on each dollar of sales. GeminIQ's pre-calculated Net Profit Margin was 4.39% on a trailing-twelve-month basis, down from 7.92% a year earlier. Per the 8-K, the debt-to-capital ratio was 35.7% and book value per share was $62.56, up 4% year over year.
Does KB Home pay a dividend?
Yes. KB Home paid $15.2 million of dividends in Q3 2026, or $63.5 million over the trailing twelve months, down from $70.8 million a year earlier. Trailing free cash flow of $28.7 million covered about 45% of those dividends.
Where can I verify KB Home's Q3 2026 figures?
The figures come from the Q3 2026 10-Q (accession 0000795266-26-000071) and the September 22, 2026 earnings release (accession 0000795266-26-000068), both on SEC EDGAR.
Wall Street's data. Main Street's price.
Institutional terminals charge thousands a year for as-filed accuracy. GeminIQ gives you the same thing for a fraction of the cost: financials built directly from raw SEC EDGAR filings, not third-party APIs, with full XBRL traceability back to the original 10-K or 10-Q. No normalized guesswork, just calculated metrics, charts, screeners, and watchlists built on numbers exactly as the company reported them. Start researching now at GeminIQ.com.
All financial figures cited in this article reference KB HOME's Q3 2026 10-Q (filed October 8, 2026, period ending August 31, 2026), with guidance and management commentary drawn from the company's Form 8-K earnings release (filed September 22, 2026). All SEC filings are publicly available at SEC EDGAR and SEC EDGAR.
Disclaimer: The content in this blog is for educational and entertainment purposes only and does not constitute financial, legal, or tax advice. Investing involves risk, including the loss of principal. The views expressed are my own and not intended as financial advice or a guarantee of future performance.