
Lululemon Stock Analysis (2026): The Margin Compression Story

By Chad Hartman
Published · Last updated
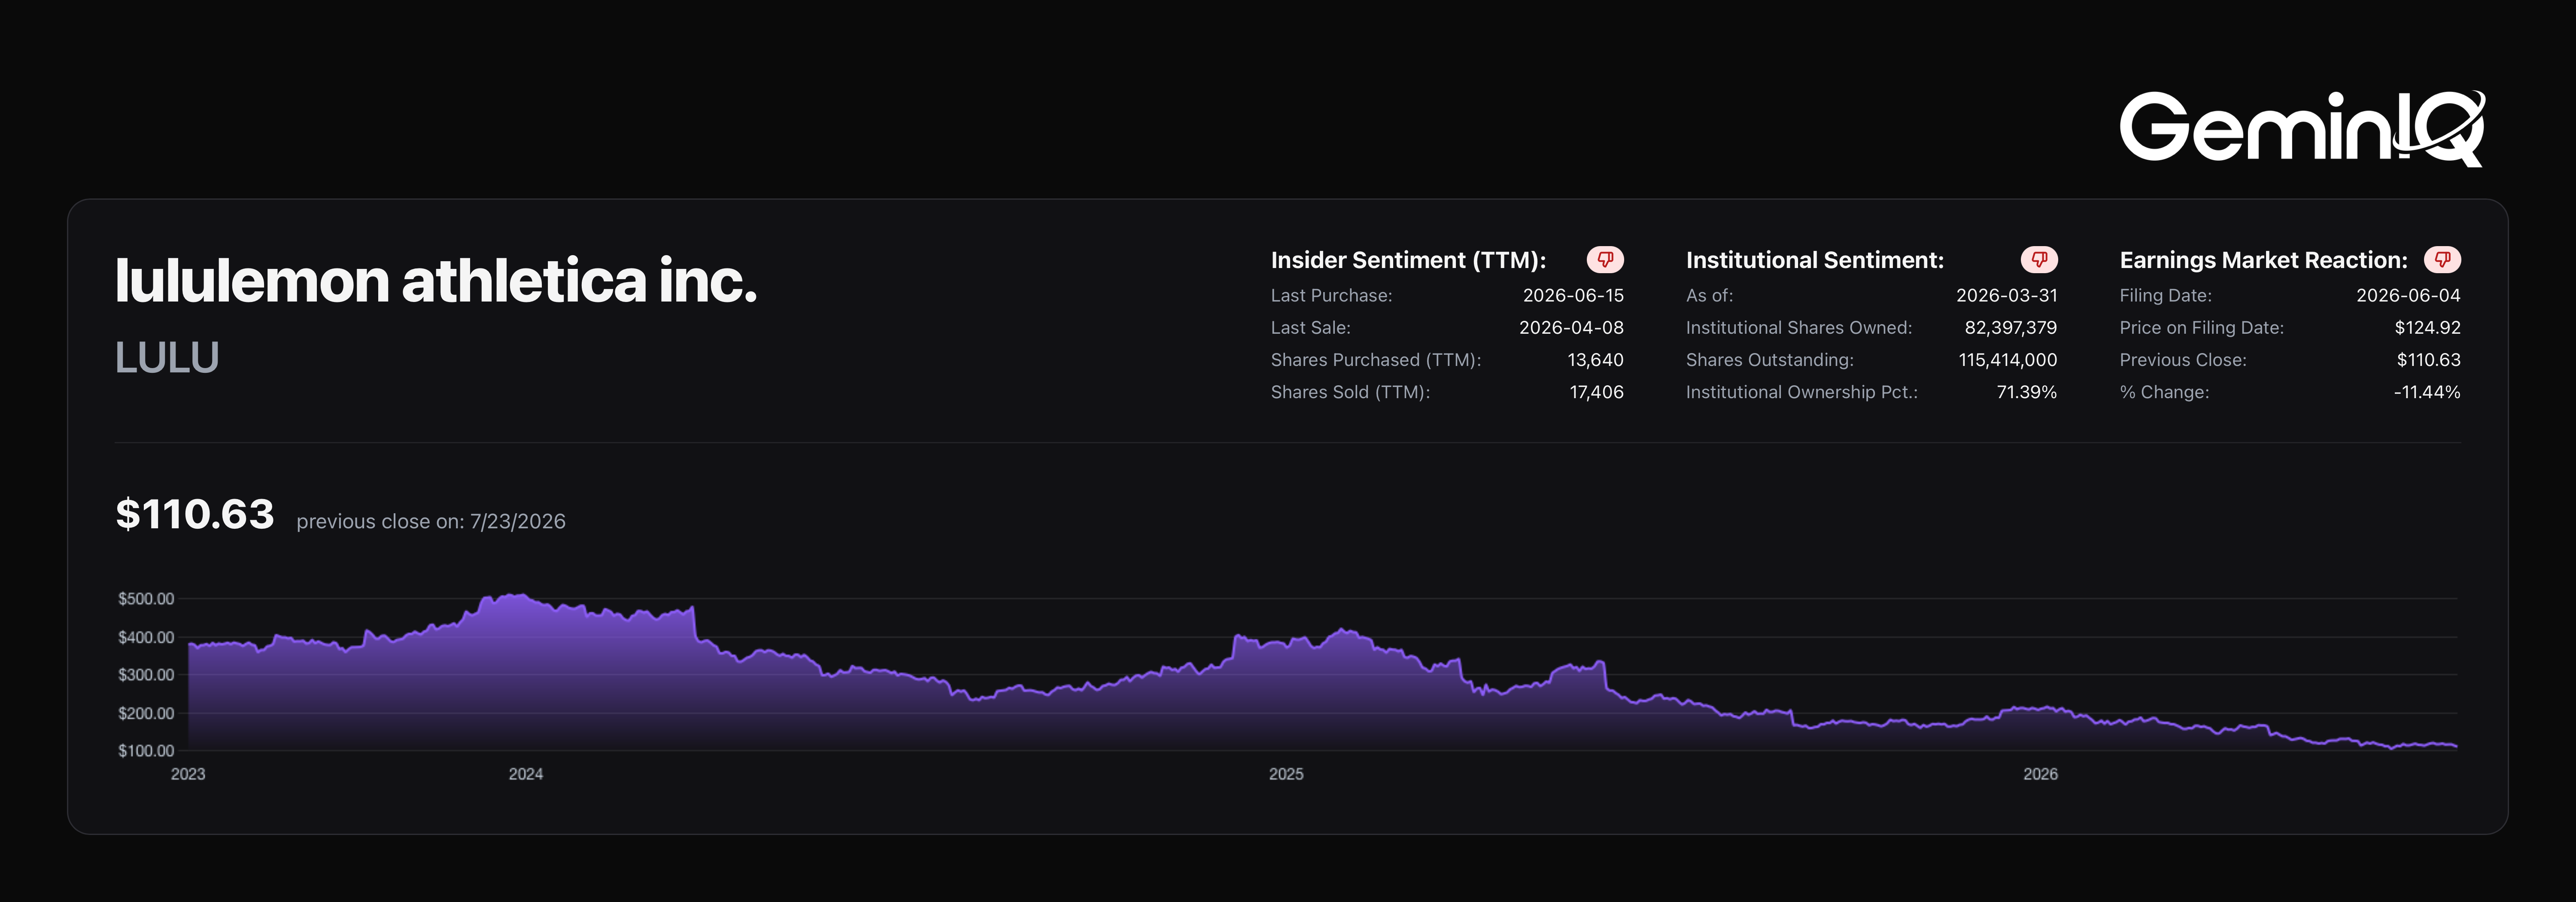
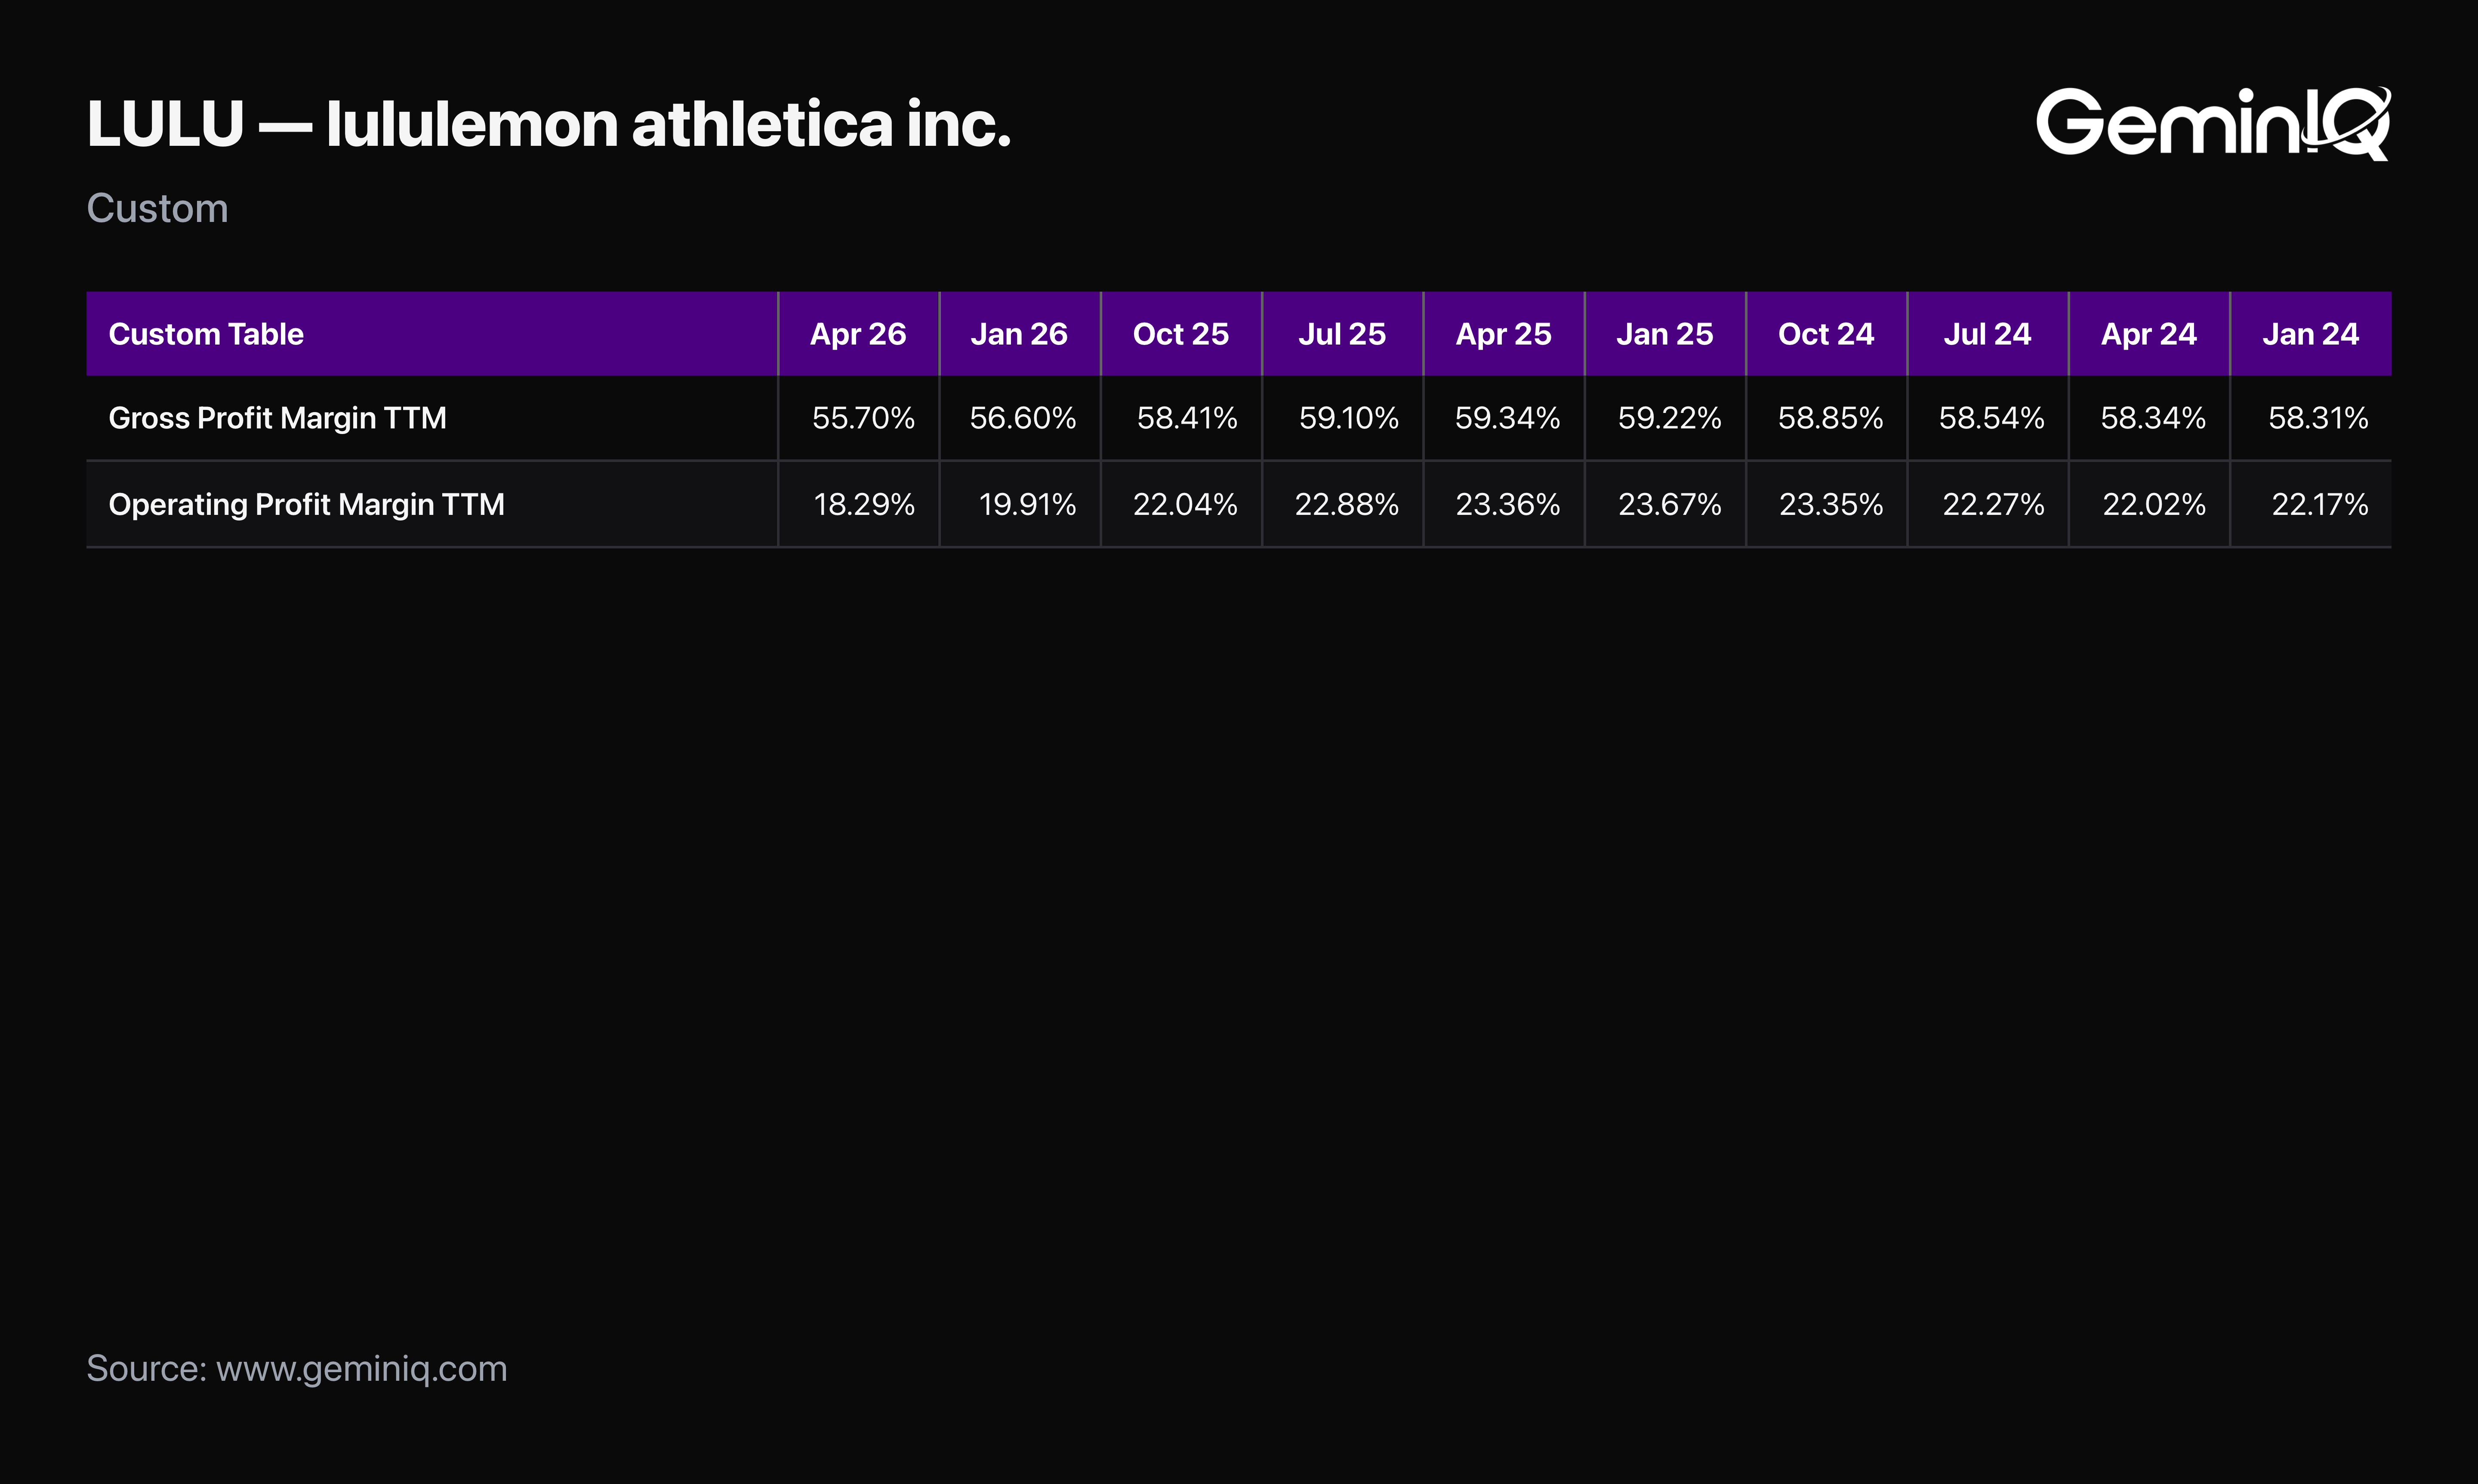
lululemon ($LULU) just filed its Q1 FY2026 10-Q (filed June 4, 2026). Revenue is still growing, and on a headline basis that alone might suggest a business in good health. The trailing twelve-month numbers underneath tell a more complicated story: operating margin has fallen from 22.0% to 18.3% over the past two years, and Return on Invested Capital has dropped from 60.9% to 42.9% over the same period. Both peaked in between — operating margin at 23.7% and ROIC at 74.6% in the quarter ended January 2025 — which makes the decline from the peak steeper still. Growth alone doesn't tell you whether a business is becoming more or less efficient at converting that growth into profit — and here, it's become meaningfully less efficient.
| Field | Value |
|---|---|
| Ticker | $LULU |
| Filing | Q1 FY2026 10-Q |
| Filed | June 4, 2026 |
| Period End | May 3, 2026 |
| Operating Margin (TTM) | 18.3% |
| ROIC (TTM) | 42.9% |
The Margin Compression
This is the core of the story, and it's a sustained, multi-quarter trend rather than a single soft quarter.
The Data: lululemon's TTM Gross Margin has fallen from 58.3% two years ago to 55.7% as of this filing, after peaking at 59.3% in the quarter ended April 2025. TTM Operating Margin has fallen from 22.0% to 18.3% over the same two years, off a 23.7% peak in the quarter ended January 2025. TTM Net Income is $1.46 Billion on TTM Revenue of $11.20 Billion.
The GeminIQ Edge: Pulling Calculated Metrics as a full multi-quarter trend, rather than comparing only the most recent quarter to a year-ago quarter, shows this compression has been gradual and consistent rather than a single cost shock. A steady, multi-period decline is a materially different signal than a one-quarter miss.
The ROIC Decline
Margin compression alone doesn't tell the full capital-efficiency story. Return on Invested Capital connects the profit side to the balance sheet.
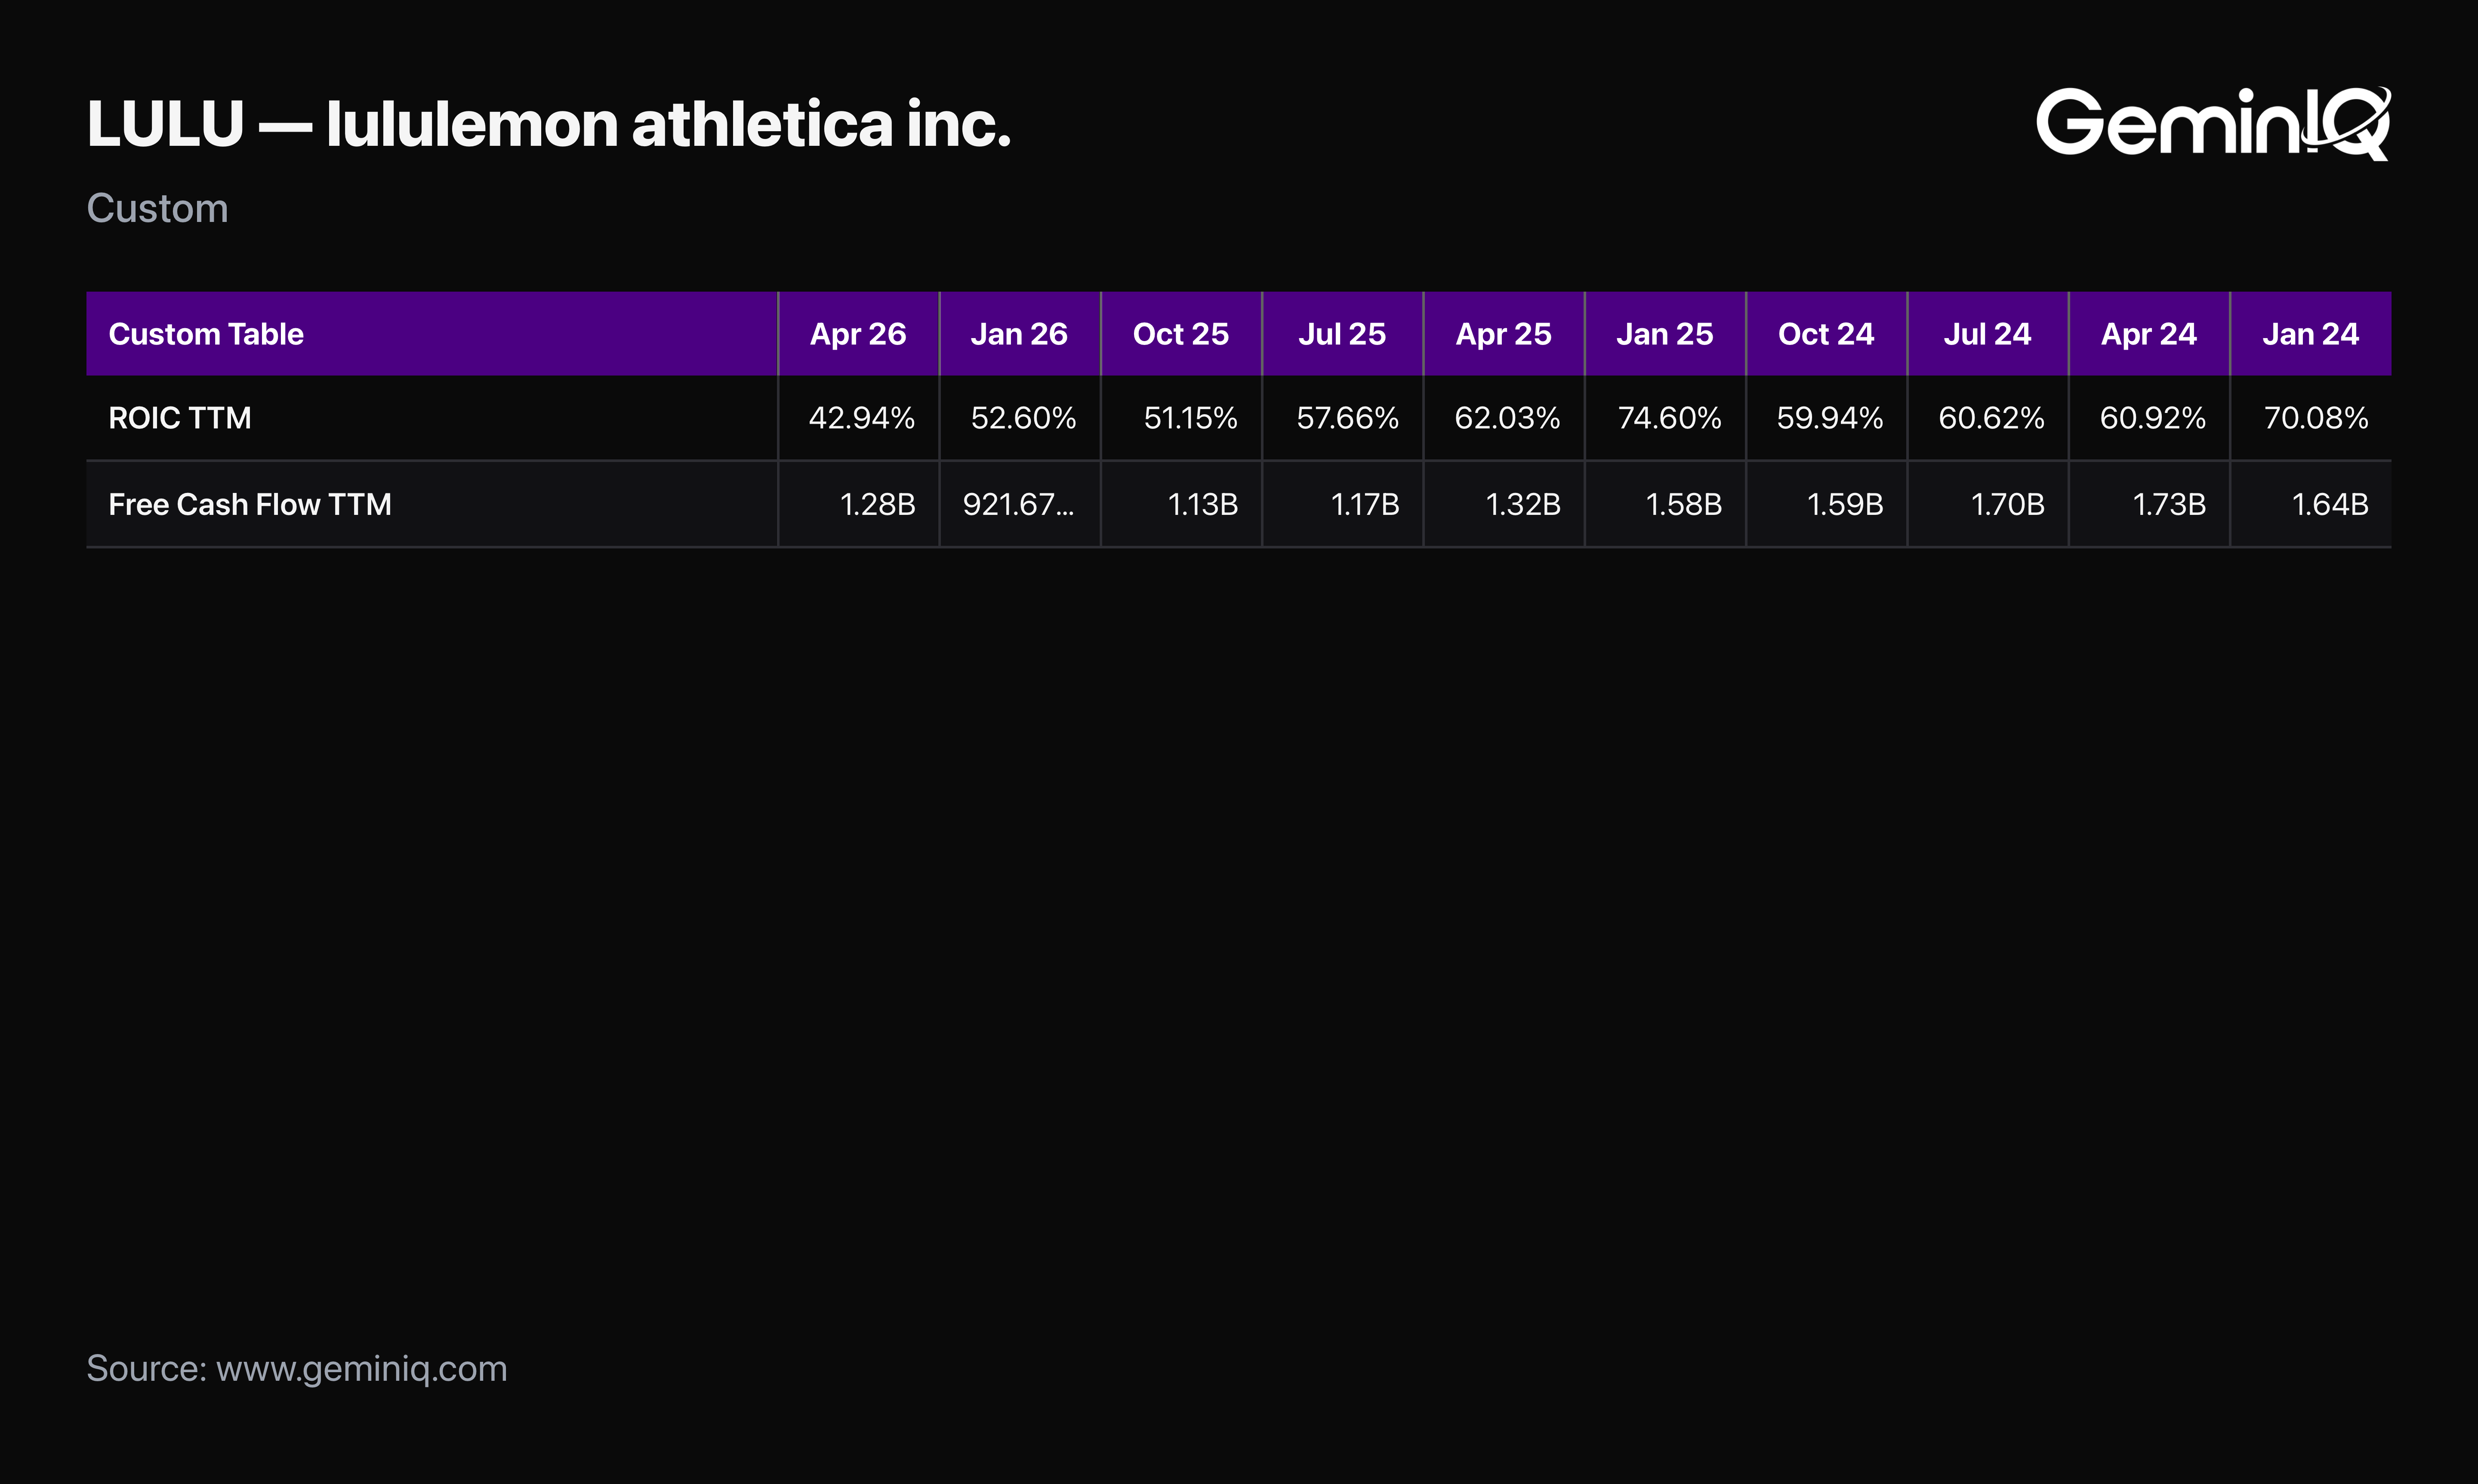
The Data: lululemon's TTM Return on Invested Capital has fallen from 60.9% two years ago to 42.9% as of this filing — still a strong figure in absolute terms, but a substantial decline, and steeper measured off the 74.6% peak in the quarter ended January 2025. TTM Free Cash Flow is $1.28 Billion, on TTM Operating Cash Flow of $1.94 Billion against TTM CapEx of $656 Million.
The GeminIQ Edge: Pulling ROIC alongside the margin trend above, rather than in isolation, shows the two moving together: as margins compressed, the returns generated on invested capital compressed with them. CapEx has also grown as a share of operating cash flow, consistent with continued store investment amid slower same-store growth.
Growth Is Slowing, Not Stopping
lululemon's headline revenue figure is still positive, and it's worth being precise about what's actually decelerating.
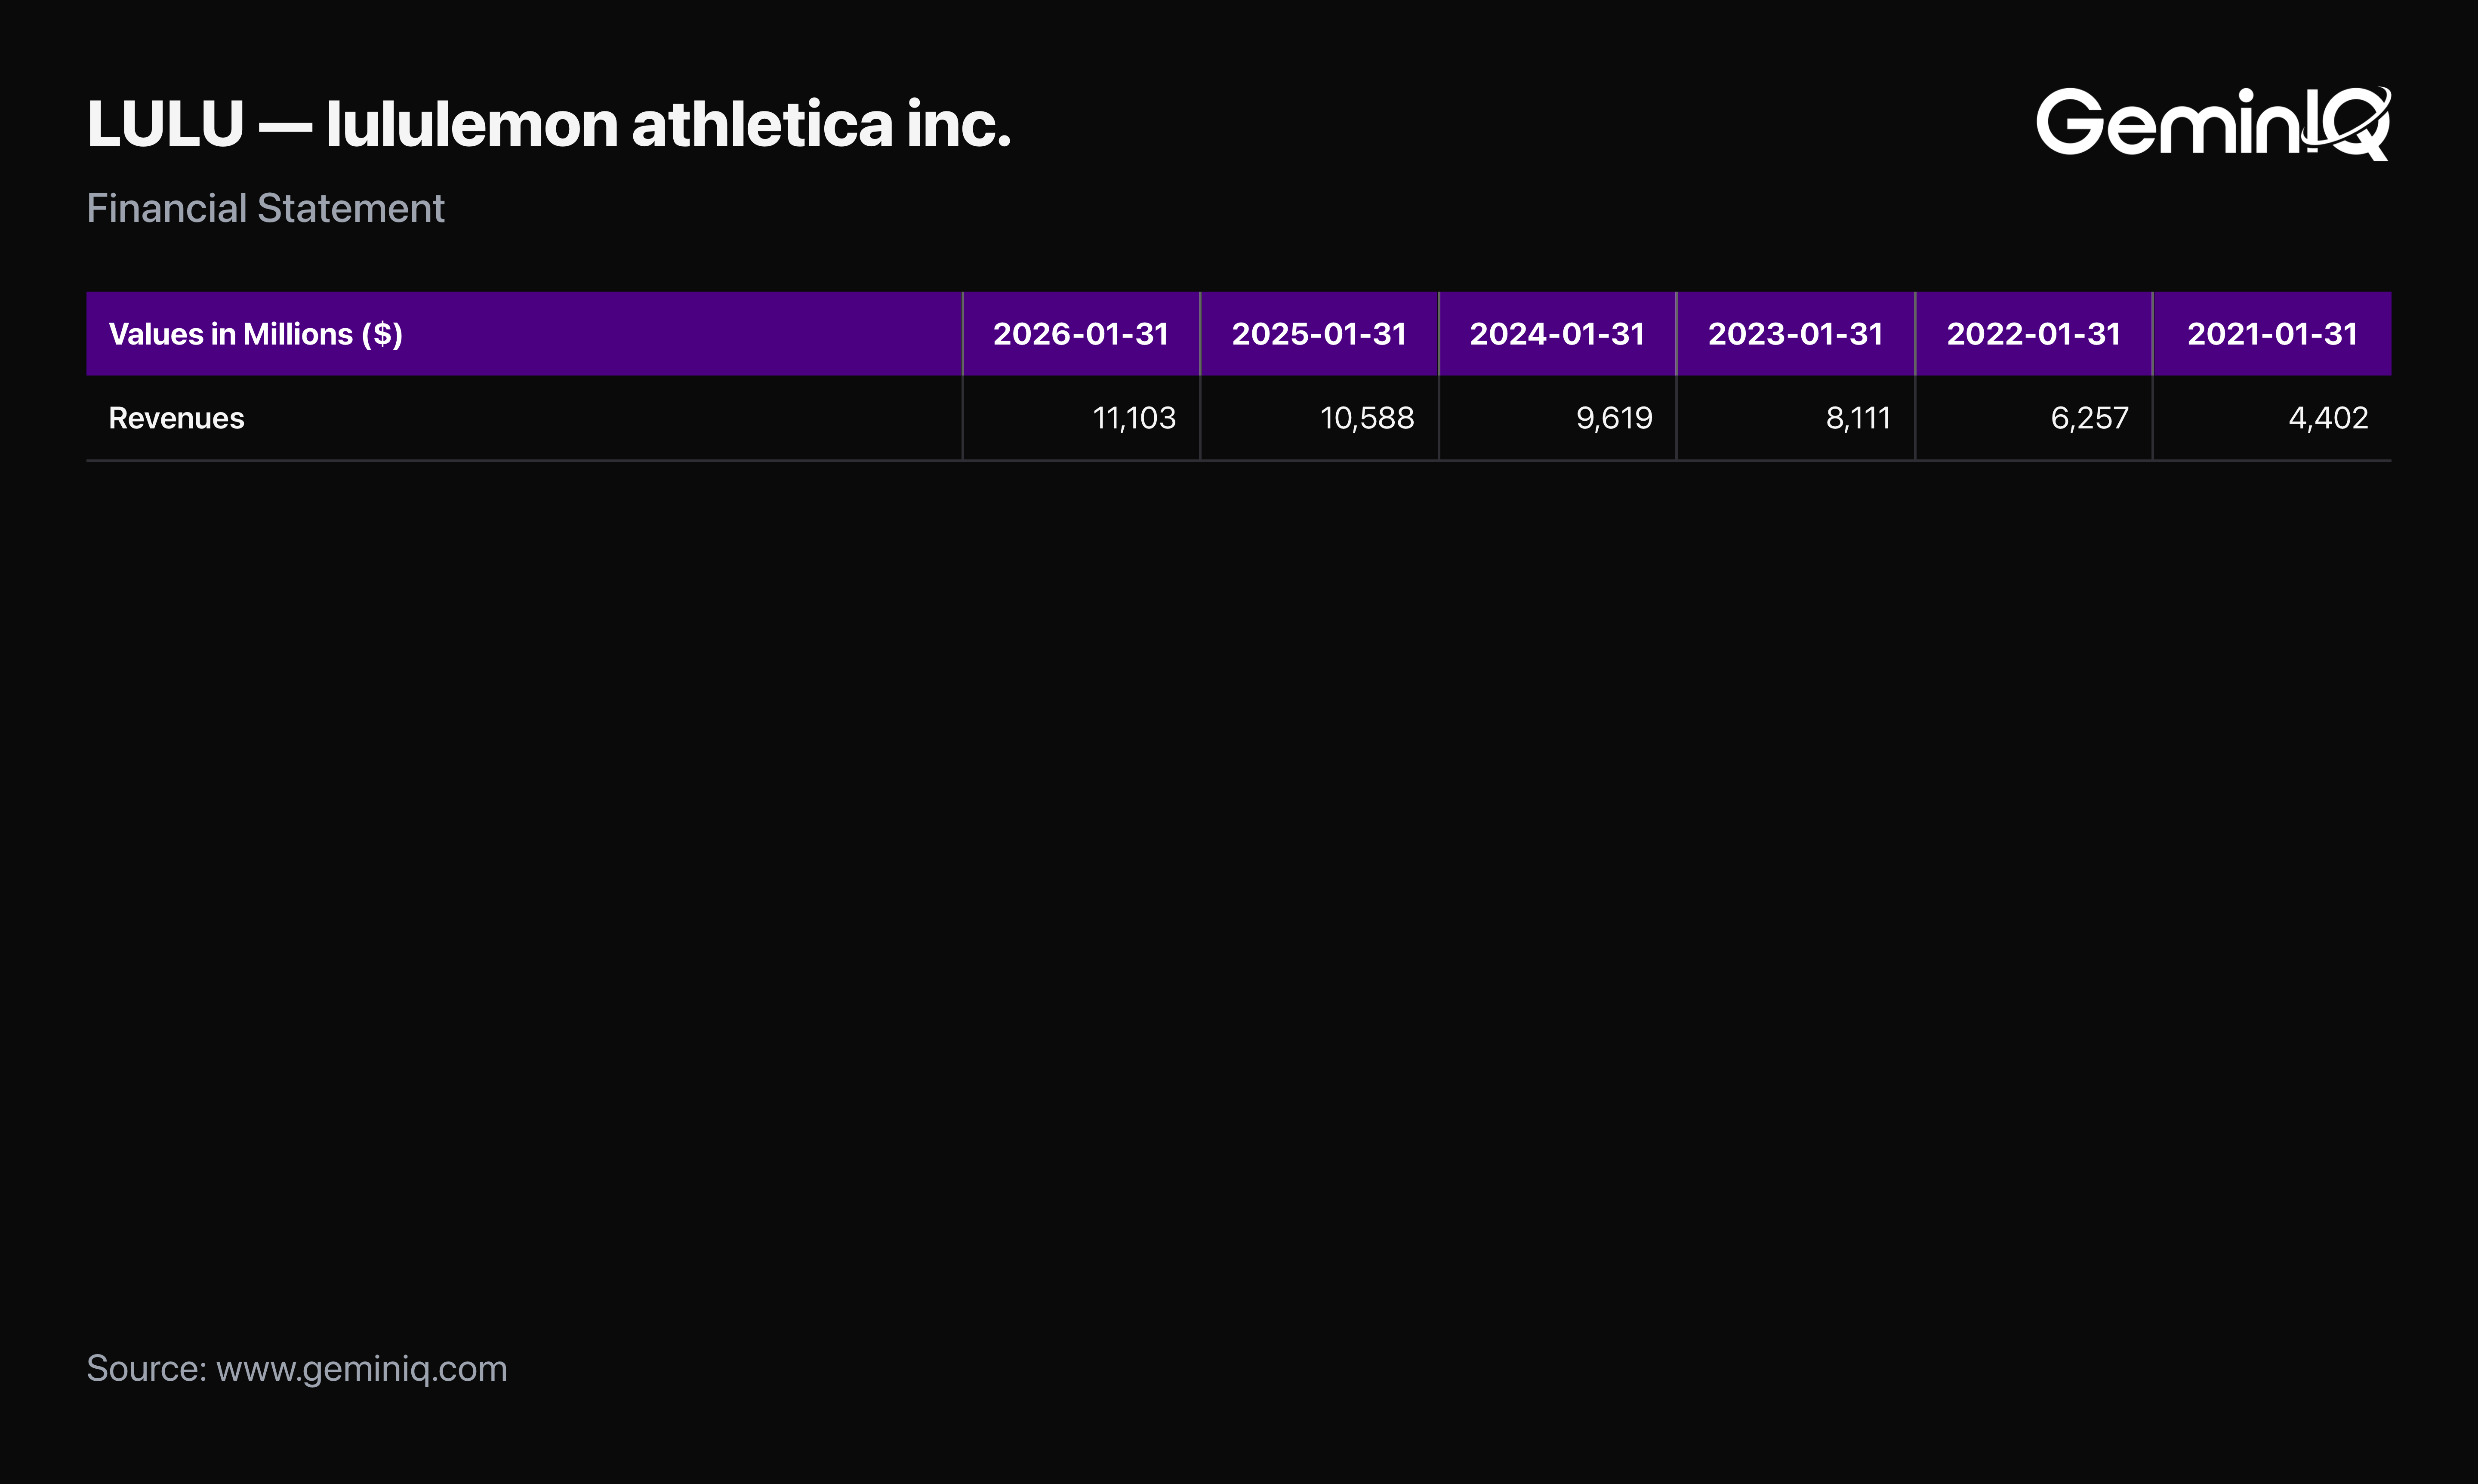
The Data: Annual revenue grew from $4.40 Billion in FY2020 to $11.10 Billion in FY2025 (fiscal year ended February 1, 2026) — a multi-year growth story that remains genuinely large in absolute terms. But the pace has slowed considerably: FY2025 revenue grew roughly 4.9% over FY2024's $10.59 Billion, a fraction of the growth rates in earlier years of this trend.
The GeminIQ Edge: Pulling Financial Statements revenue data across the full multi-year history, rather than a single year-over-year comparison, makes the deceleration curve visible directly rather than needing to trust a summarized growth-rate headline.
Smart Money and the Insider Record
Two different signals around lululemon worth checking on their own terms, alongside a valuation figure worth noting plainly.
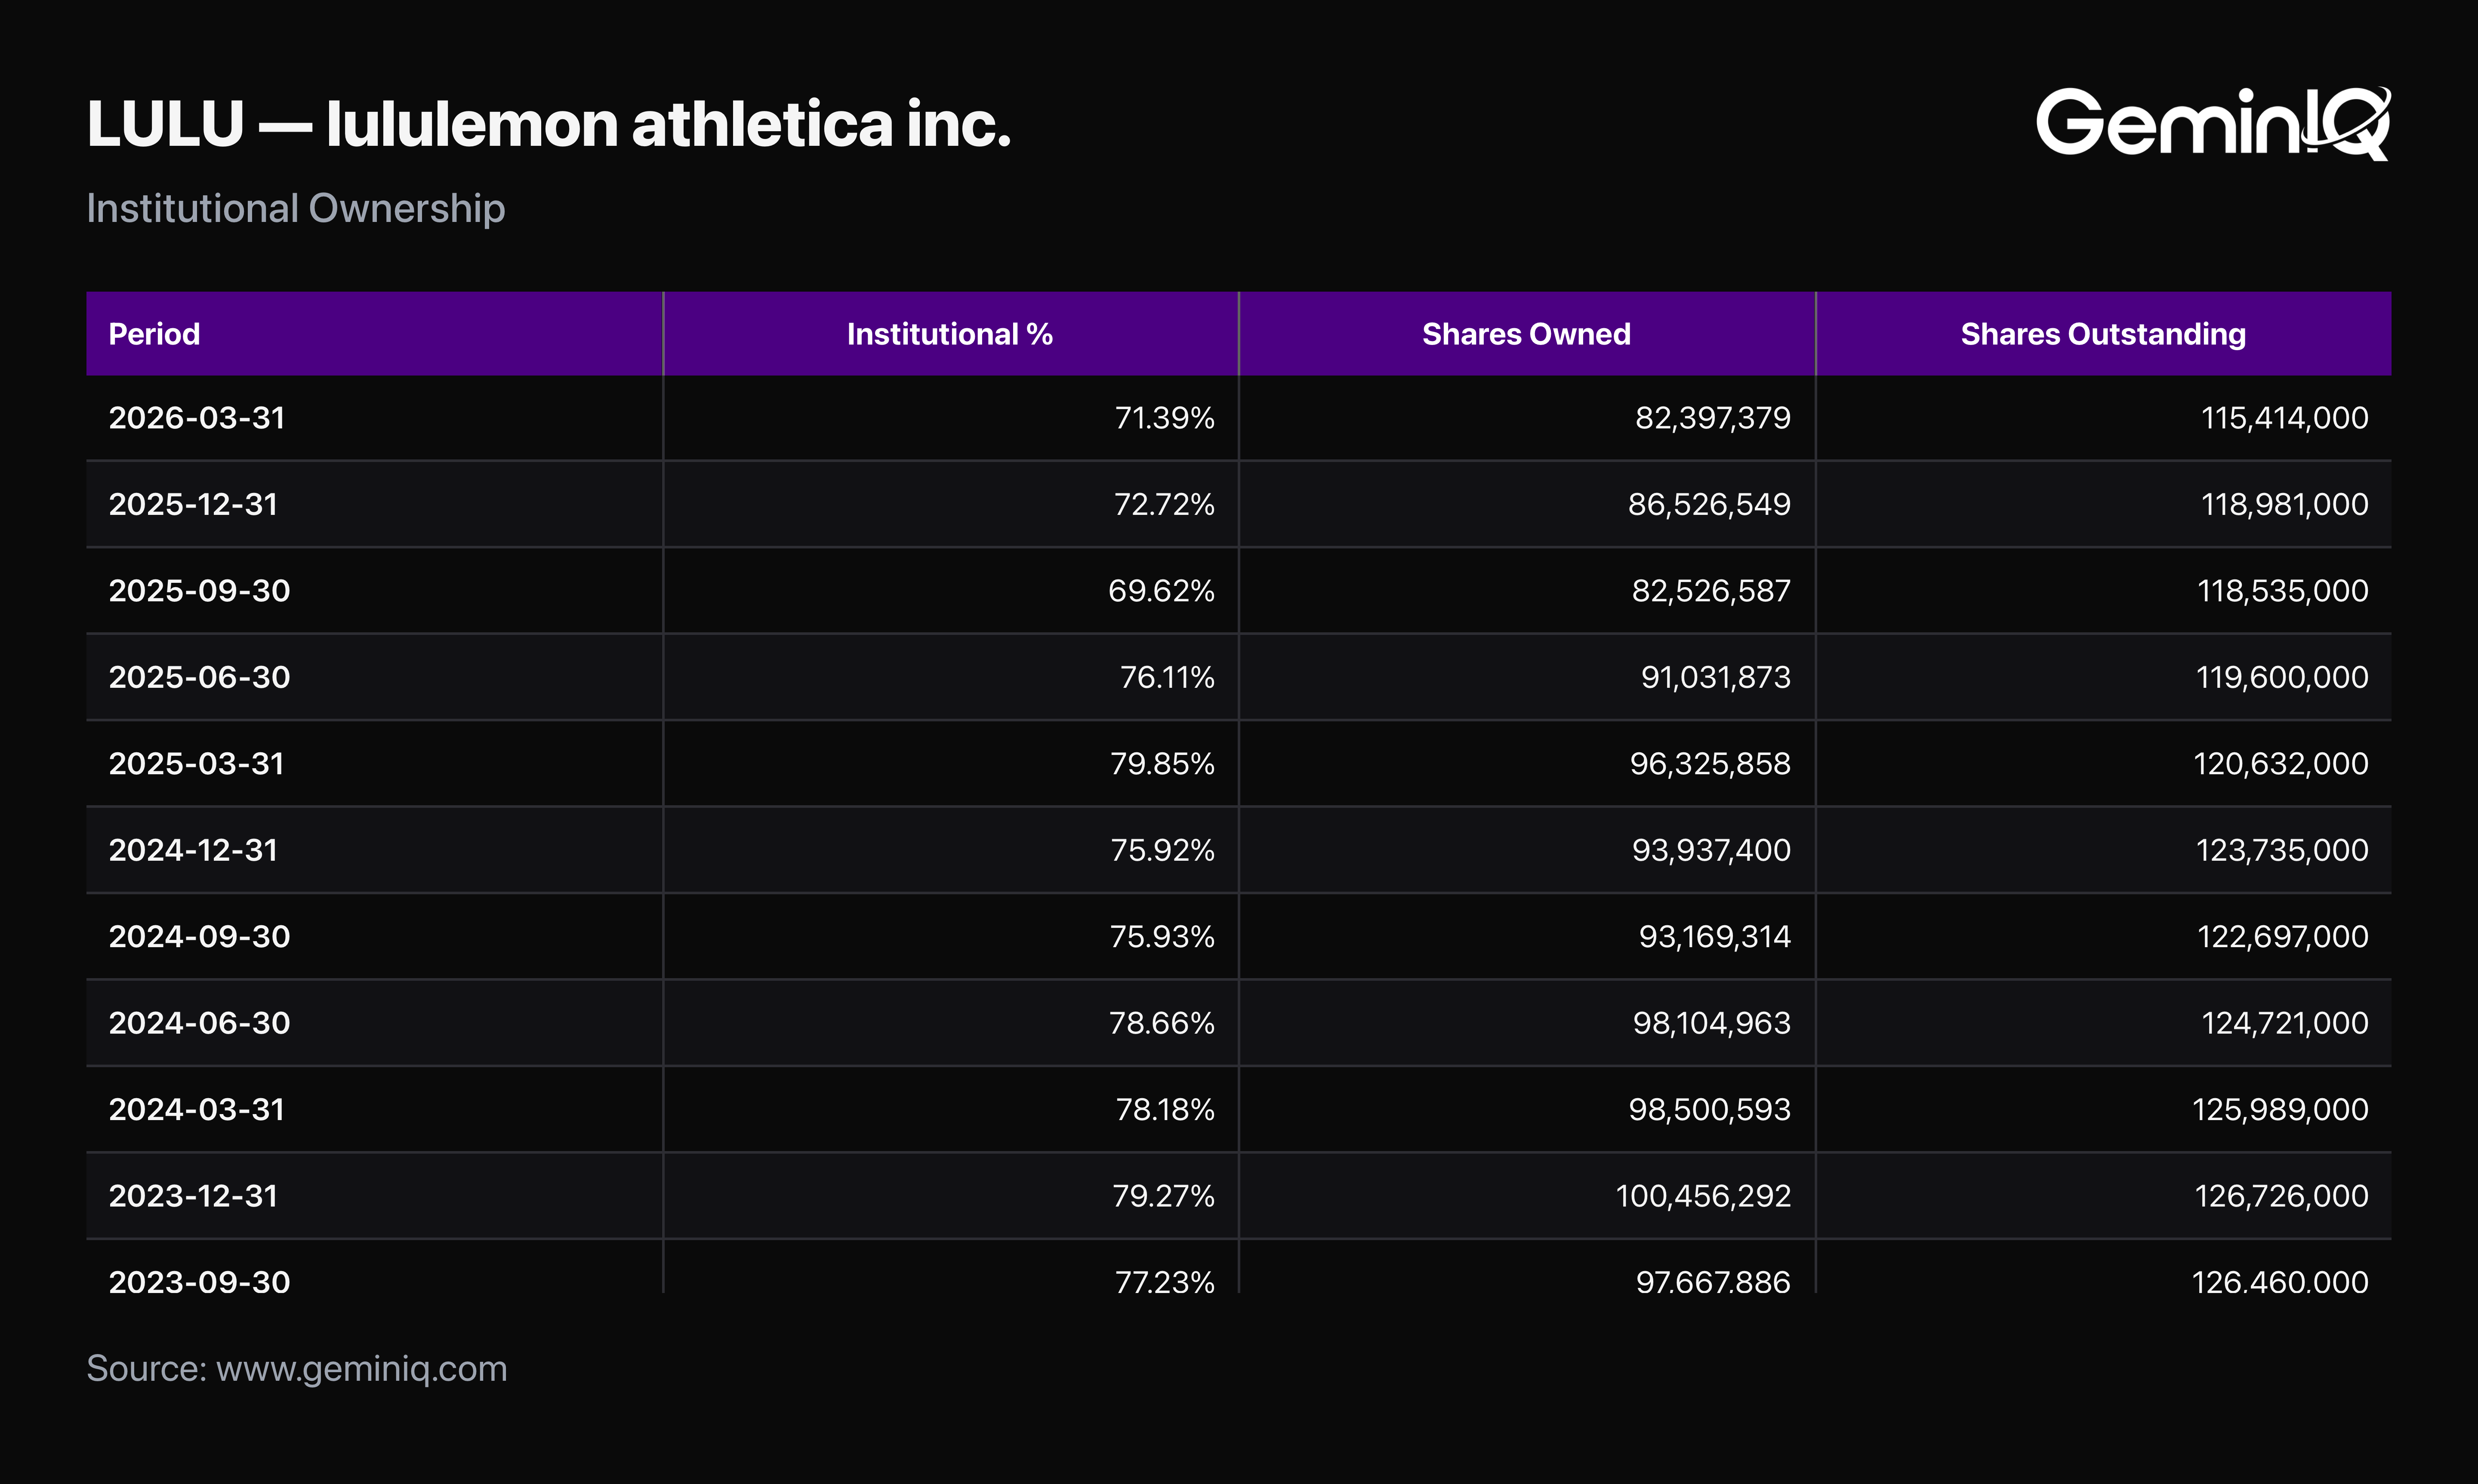
The Data: Institutional Ownership has fallen from 79.9% in March 2025 to 71.4% as of the most recent 13F (March 2026, filed with the standard lag) — a meaningful decline, not a rounding difference. Insider Transactions show a heavily sale-weighted record: 248 sales against 14 purchases in the available history. The stock currently trades at approximately 10.9x trailing earnings.
The GeminIQ Edge: An institutional ownership decline of this size, alongside a P/E multiple this low for a business still growing revenue, both point in the same direction: the market has already priced in a considerable amount of the margin and growth concerns described above, rather than waiting for further confirmation.
Frequently Asked Questions
Why has lululemon's operating margin declined?
TTM Operating Margin has fallen from 22.0% to 18.3% over the trailing two years, driven by a parallel decline in gross margin from 58.3% to 55.7%, reflecting cost pressure that has outpaced revenue growth. Measured from the peaks reached in between — 23.7% operating margin and 59.3% gross margin — the compression is steeper still.
Is lululemon's revenue still growing?
Yes, but at a decelerating rate. Annual revenue grew from $4.40 Billion (FY2020) to $11.10 Billion (FY2025), with the most recent year's growth rate (approximately 4.9%) well below the pace of earlier years in that trend.
What is lululemon's current ROIC?
TTM Return on Invested Capital is 42.9%, down from 60.9% two years ago and from a 74.6% peak in the quarter ended January 2025 — still a strong absolute figure, but a substantial decline tracking the margin compression described above.
When did lululemon last file its 10-Q, and what period does it cover?
lululemon's most recent filing is a Form 10-Q filed June 4, 2026, covering the fiscal quarter ended May 3, 2026 (Q1 FY2026).
Wall Street's data. Main Street's price.
Institutional terminals charge thousands a year for as-filed accuracy. GeminIQ gives you the same thing for a fraction of the cost: financials built directly from raw SEC EDGAR filings, not third-party APIs, with full XBRL traceability back to the original 10-K or 10-Q. No normalized guesswork, just calculated metrics, charts, screeners, and watchlists built on numbers exactly as the company reported them. Start researching now at GeminIQ.com.
All financial figures cited in this article reference lululemon athletica inc.'s Q1 FY2026 10-Q (filed June 4, 2026, period ending May 3, 2026). All SEC filings are publicly available at SEC EDGAR.
Disclaimer: The content in this blog is for educational and entertainment purposes only and does not constitute financial, legal, or tax advice. Investing involves risk, including the loss of principal. The views expressed are my own and not intended as financial advice or a guarantee of future performance.