Magic Formula Investing: Greenblatt's Strategy Explained
By Chad Hartman
Published June 3, 2026 · Last updated June 14, 2026
Joel Greenblatt published The Little Book That Beats the Market in 2005 and made a provocative claim: a mechanical two-factor formula, applied consistently to a ranked universe of stocks, had beaten the S&P 500 by a significant margin over a 17-year period — without requiring a single discretionary judgment call. The formula is not complicated. It combines a measure of how cheaply you are buying the business with a measure of how good the underlying business actually is. Buy cheap, high-quality businesses. Hold them for a year. Rebalance. Repeat. The investment media has spent two decades either dismissing the approach as too simple or misapplying it because the underlying metrics are more sensitive to data quality than most investors realize. This guide covers what the formula actually measures, what the historical evidence shows, where the strategy fails, and how to run a credible version of the screen — anchored to the raw SEC filings where the inputs live.
Table of Contents
- What Is the Magic Formula?
- The Two Inputs: Earnings Yield and Return on Capital
- How the Ranking System Works
- The Historical Evidence
- Why Most Implementations Get It Wrong
- The Real Reason It Works — and When It Doesn't
- How to Run the Magic Formula Screen on GeminIQ
- Frequently Asked Questions
What Is the Magic Formula?
The Magic Formula is a quantitative stock selection strategy developed by Joel Greenblatt, founder of Gotham Capital and adjunct professor at Columbia Business School. It appears in The Little Book That Beats the Market (2005) and the updated The Little Book That Still Beats the Market (2010). The core idea is rooted in value investing logic that predates Greenblatt by decades: great businesses bought at reasonable prices outperform mediocre businesses bought at any price, and mediocre businesses bought cheaply outperform great businesses bought at extravagant ones. The Magic Formula operationalizes this intuition into two specific metrics — earnings yield and return on capital — and combines them into a single composite rank across a defined universe of stocks.
What made the strategy influential was not originality. It was demonstration. Greenblatt published actual backtested returns covering the period from 1988 to 2004, showing the formula's ranked portfolio outperforming the S&P 500 by a substantial margin over that stretch. He then made it mechanical — anyone willing to follow the rules and ignore their emotions during underperformance periods could theoretically replicate the results. The appeal to retail investors was immediate, and the publication of the formula sparked an ongoing debate about whether quantitative value strategies can survive widespread adoption.
The Two Inputs: Earnings Yield and Return on Capital
The formula has two components, and each one is doing a specific analytical job. Understanding what they measure — and how Greenblatt defines them — is essential before applying the strategy.
Earnings Yield is Greenblatt's valuation input. It is calculated as EBIT divided by Enterprise Value — the inverse of the EV/EBIT multiple, expressed as a percentage. The choice of EBIT over net earnings and Enterprise Value over market capitalization is deliberate and important. EBIT strips out the effects of leverage and tax rates, making it possible to compare businesses with radically different capital structures on equal footing. A company carrying significant debt will show lower net income than an identical unlevered business — but their EBIT figures will be similar, reflecting the same underlying operating economics. Enterprise Value replaces market capitalization in the denominator because it accounts for the debt that EBIT-paying investors have already taken on. Using market cap against EBIT would understate the true cost of acquiring the business's earnings stream. The result is a metric that answers the question: for the full price required to own this business — equity plus assumed debt, less cash — how much operating earnings am I getting per dollar paid?
Return on Capital is the quality input. Greenblatt defines it as EBIT divided by Net Fixed Assets plus Net Working Capital. This focuses on the tangible operating capital the business actually requires to run, and avoids the effective-tax-rate sensitivity of NOPAT-based approaches. A business with high return on capital earns significant operating profit relative to the fixed assets and working capital it has deployed. That efficiency tends to reflect a durable competitive advantage: pricing power, brand loyalty, switching costs, or an operating model that converts inputs into earnings far more effectively than competitors. Greenblatt's insight was that these businesses — the ones genuinely earning high returns on capital — tend to compound value through time in a way that consistently low-return-on-capital businesses never can, regardless of how cheaply the stock is priced.
The two metrics are complementary in a specific way. Earnings yield alone would lead you toward cheap businesses with no regard for quality — the value trap problem. Return on capital alone would lead you toward great businesses with no regard for price — the overpayment problem. The formula requires both, and the ranking system resolves the tradeoff mechanically.
How the Ranking System Works
The implementation is straightforward. Start with a defined investment universe — Greenblatt typically uses US-listed companies with market capitalizations above a minimum threshold, excluding financial companies, utilities, and foreign-listed ADRs. Financial companies are excluded because their balance sheets are structured differently, making the working capital and fixed asset inputs meaningless for banks and insurers. Utilities are excluded because regulated capital structures produce artificially low return-on-capital figures that would skew the ranking.
Within the eligible universe, rank every company by earnings yield from highest to lowest — the cheapest business on an EV/EBIT basis receives rank 1. Then rank every company by return on capital from highest to lowest — the most efficient business receives rank 1. Add the two ranks together to produce a composite Magic Formula rank. The companies with the lowest composite scores — highest earnings yield combined with highest return on capital — are the buy candidates.
Greenblatt's original implementation called for selecting 20 to 30 stocks from the top of the combined ranking, holding each position for approximately one year, then rebalancing by selling the existing positions and replacing them with the new top-ranked candidates. The one-year holding period is not arbitrary: it aligns with the point at which short-term capital gains treatment rolls off for US taxpayers, making the annual rebalance tax-efficient for taxable accounts. The diversification across 20 to 30 names reduces single-stock concentration risk without diluting the strategy's exposure to the highest-ranked opportunities.
The Historical Evidence
Greenblatt's original backtest covered the period from 1988 through 2004 and reported average annual returns of approximately 30.8% for the top-ranked Magic Formula portfolio, compared to approximately 12.3% for the S&P 500 over the same period. The universe in that test was US-listed stocks with market capitalizations above $50 million. Using a higher minimum market cap of $1 billion still produced outperformance, with average annual returns of approximately 22.9% versus the index — a smaller edge, but still a substantial one over a 17-year span.
Several academic researchers subsequently tested the formula on out-of-sample data. A 2012 study by Persson and Selander applied the strategy to European markets from 2000 through 2010 and found outperformance in several countries, though with significant country-level variation. A 2014 study by Davydov, Tikkanen, and Äijö tested the formula on Nordic market data and found results consistent with the original US backtest. Gray and Carlisle, writing in Quantitative Value (2012), applied the formula to US data across a longer and more recent period and found that while the strategy outperformed over time, a simpler version — using earnings yield alone with a quality filter based on balance sheet strength rather than return on capital — produced similar or stronger results in some testing windows.
The evidence is not unanimous. Researchers testing the formula on data since its publication have found more mixed results, which is consistent with the academic literature on quantitative anomalies more broadly: strategies that attract attention often see their alpha compress as capital flows into the approach. The Magic Formula's empirical track record before 2005 is stronger than its documented performance after wide publication, which is the expected pattern for a published quantitative signal in an efficient market. The more important conclusion is this: the underlying logic — combining quality and value in a mechanical ranking — has a coherent theoretical basis and a credible long-term historical record. Whether the precise magnitude of the historical edge persists is a separate question from whether the approach is analytically sound.
Why Most Implementations Get It Wrong
The formula is simple in concept and error-prone in execution. Three failure modes account for most of the gap between the theoretical strategy and what investors actually experience when they try to apply it.
The first is data quality. Both inputs — EBIT and Enterprise Value — are sensitive to how the underlying financial data is constructed. Enterprise Value requires current market capitalization, total debt, and total cash. If the debt figure used is stale or misclassified, Enterprise Value is wrong, and therefore earnings yield is wrong. EBIT is equally vulnerable: on many third-party financial platforms, operating income is normalized, restated, or merged with non-operating line items in ways that do not match the filed 10-K or 10-Q. A standard screener presenting Magic Formula rankings built on normalized data is presenting a result that diverges — sometimes significantly — from what the formula would produce if run on the raw SEC filings. The inputs look credible because they are labeled correctly. But the labels mask the fact that the underlying numbers have been processed through an intermediary before reaching the ranking model.
The second failure mode is universe definition. The formula's exclusions — financial companies, utilities, foreign-listed ADRs — are not optional. Including them produces distorted rankings because the metrics do not translate across those categories. An investor applying the formula to a universe that includes banks will find them frequently surfacing near the top of the earnings yield ranking, not because they are cheap in the same sense as an industrial company, but because the EBIT and working capital inputs are structurally incompatible with how banking businesses actually generate returns.
The third failure mode is behavioral. Greenblatt was explicit about this in both editions of the book: the strategy underperforms the market in roughly one out of every three to four years, and sometimes produces multi-year stretches of underperformance. Most investors do not hold through it. The moment the ranked portfolio lags the index for two consecutive years, the abandonment rate climbs sharply. The investors who abandoned in the year before a mean-reversion rally capture none of the excess return. The strategy requires a level of mechanical consistency that most investors — particularly those running discretionary portfolios alongside a quantitative screen — find difficult to maintain in practice.
The Real Reason It Works — and When It Doesn't
The academic literature on value and quality factors suggests the Magic Formula's outperformance is not a free lunch — it is compensation for a specific kind of discomfort. The businesses that rank highly on combined earnings yield and return on capital are often doing so because something has gone wrong in the near term: an industry downturn, a cyclical earnings depression, a management transition, or a headline event that has driven the stock down relative to its long-run operating economics. These are exactly the situations where discretionary investors exit, pushing prices down further, and creating the cheap entry point that the earnings yield ranking surfaces. The return on capital filter then distinguishes businesses experiencing temporary distress from ones facing permanent structural deterioration.
The strategy breaks down in two distinct environments. The first is a momentum-driven market where high-quality businesses are already richly priced and the formula cannot find combinations of cheap valuation and strong returns simultaneously — in these conditions, the ranked portfolio tends to fill with businesses that are cheap for structural reasons rather than cyclical ones, and the quality filter does less useful work. The second is a prolonged low-interest-rate environment where investors systematically re-rate quality businesses upward, compressing earnings yields across the board and reducing the spread between the cheapest and most expensive valuations. Both conditions appeared in various stretches of the post-2010 market environment, which partly explains why post-publication performance has been more muted than the original backtest period. The formula does not fail in those environments — it simply has less raw material to work with.
How to Run the Magic Formula Screen on GeminIQ
The credibility of any Magic Formula implementation depends entirely on the quality of the inputs, and the inputs live in the SEC filings. GeminIQ's Stock Screener builds every metric directly from XBRL-tagged 10-K and 10-Q data — not from a normalized third-party feed — which means the EBIT figure in the screener is the OperatingIncomeLoss tag from the filing, and the debt figures used in Enterprise Value are the balance sheet components as the company actually reported them.
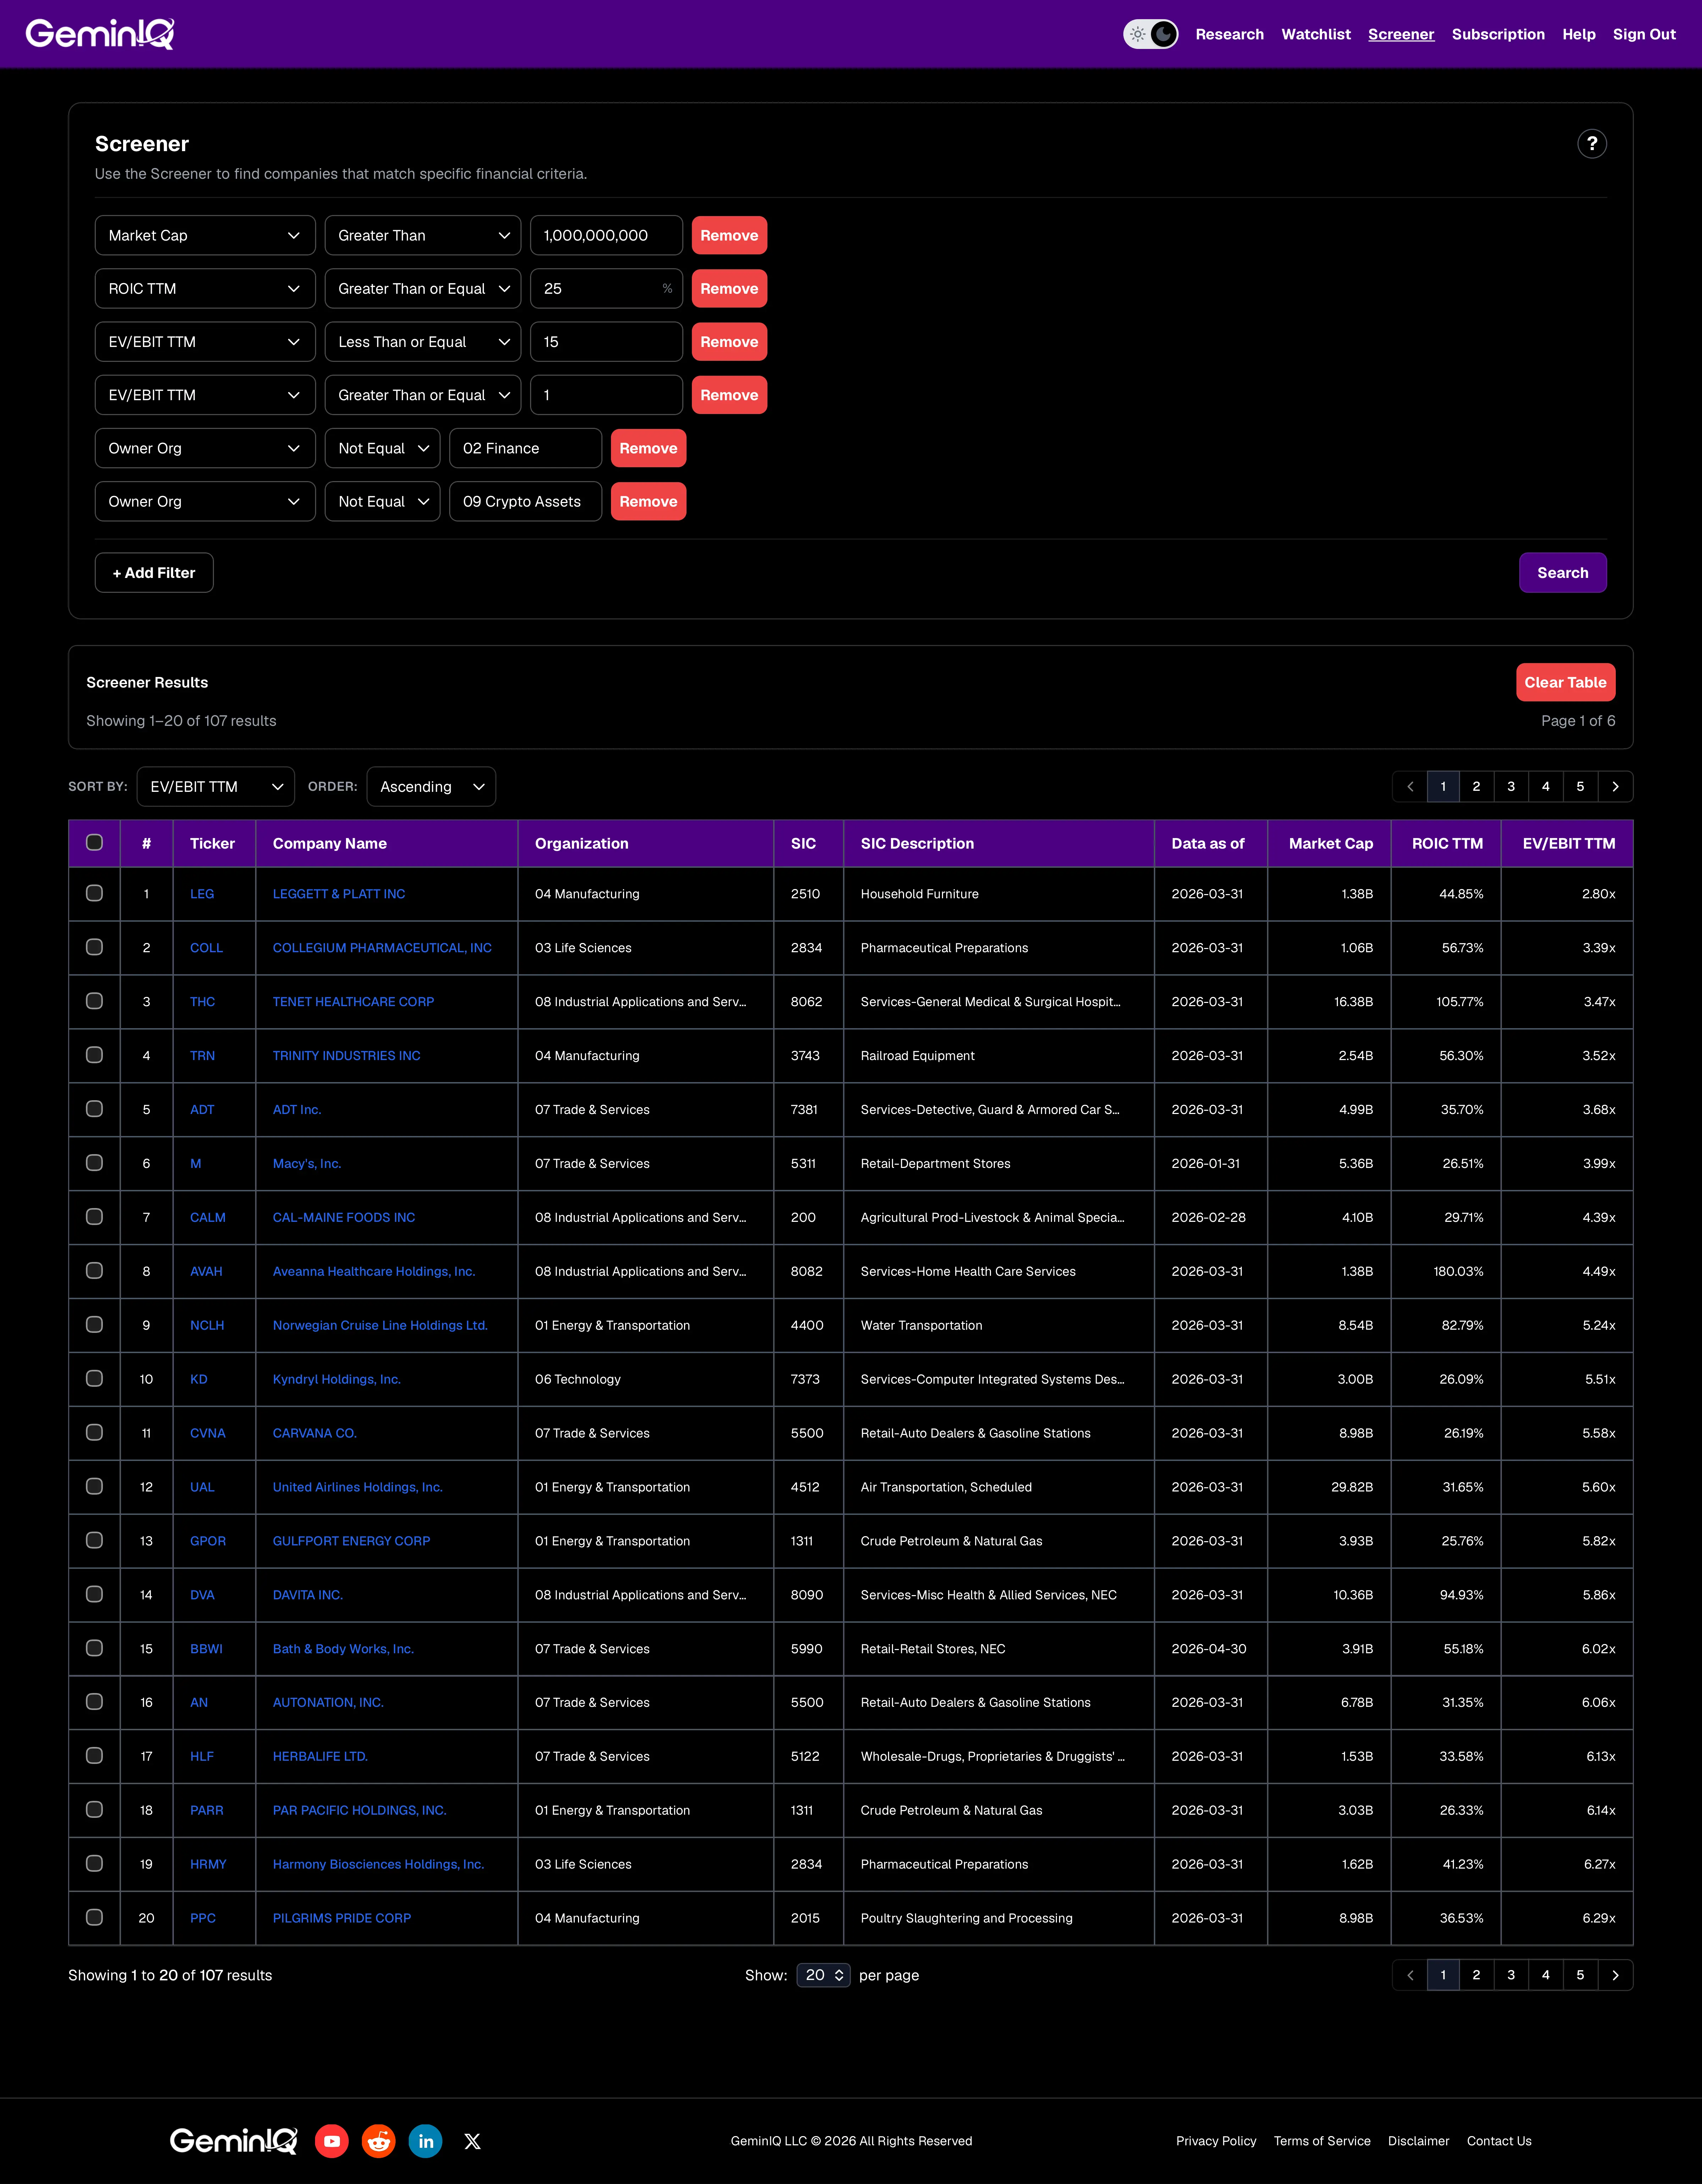
The Magic Formula screen applies six filters. Market Cap must exceed $1 billion, establishing the large-cap universe where liquidity is workable. GeminIQ's pre-calculated Return on Invested Capital (ROIC TTM) must be at or above 25% — the quality threshold that confirms the business earns strong returns on the capital it deploys. EV/EBIT TTM must be at or below 15 and at or above 1 — the valuation band that targets genuinely cheap businesses while excluding companies whose low multiples are a product of negative or near-zero operating earnings rather than value. Owner Org is set to exclude Finance and Crypto Assets — sectors where capital structure makes EBIT and ROIC comparisons unreliable. Results are sorted by EV/EBIT TTM ascending, so the companies offering the most operating earnings per dollar of enterprise value surface at the top. Running those six filters against the current US equity universe returns 107 companies as of June 2026.
This matters more than it sounds. A standard screener running the same filters on normalized data will produce a different list. Aggregators frequently adjust EBIT for restructuring charges, stock-based compensation, or acquired intangible amortization — a company carrying significant acquisition-related amortization will show a much higher adjusted EBIT on an aggregator than its as-filed figure. That gap moves the EV/EBIT multiple, which changes who ranks where. GeminIQ surfaces the as-filed EBIT, which is what Greenblatt's original formula uses. It is also explicit about what the screen does not do: it does not apply a composite dual-rank the way Greenblatt's original implementation described. It uses ROIC as a quality floor and EV/EBIT as the primary sort — a faithful practical approximation that avoids the data integrity problems that plague composite-rank implementations built on normalized inputs.
Once a company surfaces at the top of the screen, GeminIQ's Calculated Metrics panel shows how ROIC TTM has trended across the prior 8 to 12 quarters. A business at 25% ROIC after three years of consistent performance tells a different story than one that hit 25% in a single quarter following an asset sale or a working capital release. The Interactive Visualizations make that trend visible in seconds. The Magic Formula is a starting point, not a conclusion. Greenblatt never argued the formula was a substitute for reading the filing — he argued it was a systematic way to identify the businesses worth reading. Pull the ranked candidates into GeminIQ's Financial Statements view and ask the questions the formula cannot: Is the debt structure sustainable? Is working capital expanding or contracting? Does the EBIT figure reflect the ongoing business or a one-time event the ranking model cannot detect?
Frequently Asked Questions
What is the difference between Greenblatt's Return on Capital and standard ROIC?
Greenblatt's return on capital is EBIT divided by Net Fixed Assets plus Net Working Capital. Standard ROIC — including GeminIQ's pre-calculated version — uses NOPAT divided by total invested capital including all debt and equity less excess cash. Greenblatt's version is simpler and avoids tax-rate sensitivity, but excludes the full debt load from the capital base, which can overstate returns for highly leveraged businesses. GeminIQ's screen uses ROIC TTM as its quality input — a more conservative and more methodology-transparent measure than Greenblatt's narrower definition, and one whose inputs are fully traceable to the XBRL-tagged filing data.
Why are financial companies and utilities excluded?
Financial companies — banks, insurers, financial holding companies — have balance sheets where debt is part of the operating business model, not a financing decision layered on top of operations. Net working capital is a meaningless concept for a bank. Return on capital computed against a lending portfolio produces figures that are not comparable to an industrial or consumer company's capital efficiency. Utilities are excluded because regulated capital structures produce artificially low returns on capital — the regulatory framework sets the permitted return by design. Including either category distorts the ranking without adding analytical value.
Does the strategy still work after publication?
The pre-publication backtest evidence is substantially stronger than the post-publication live record. This is consistent with the broader academic literature on published quantitative anomalies: once a factor is widely known, capital flows toward it and compresses the spread between cheap-and-quality and expensive-and-low-quality businesses. What remains is the underlying logic — buying good businesses cheaply is still better than the alternative — but the precise magnitude of the documented historical edge should be treated as a historical data point rather than a forward-looking guarantee. Greenblatt himself acknowledged in the updated edition that the strategy requires patience through underperformance periods and that behavioral consistency is as important as the formula itself.
How many stocks should the portfolio include?
Greenblatt recommended 20 to 30 positions selected from the top of the combined ranking. Fewer than 20 concentrates too much risk in individual names; more than 30 dilutes the exposure to the highest-ranked candidates without meaningfully improving diversification. The portfolio is rebalanced annually, and Greenblatt suggested staggering purchases over the course of the first year — buying 5 to 7 positions per quarter — to avoid being fully deployed at a single market moment.
What minimum market cap should be used?
Greenblatt's original backtest used $50 million as the floor. His large-cap version used $1 billion. Smaller market caps tend to produce higher-magnitude returns in backtests but introduce practical constraints: lower liquidity, wider bid-ask spreads, and data coverage that can be less complete. The GeminIQ Magic Formula screen defaults to the $1 billion floor, which the Stock Screener applies as a stackable filter that can be adjusted to match a specific portfolio's liquidity requirements.
Related Reading
- ROIC: Return on Invested Capital Explained — Formula, Benchmarks, and Real Filing Data
- Value Investing Glossary: Terms, Ratios, and Mental Models Defined
- What Investors Miss in SEC Filings: Hidden Signals in 10-Ks and 10-Qs
Research Faster. Invest Smarter.
Most financial websites rely on third-party aggregators that simplify or process data before you ever see it. We built GeminIQ because we believe you deserve a better fundamental analysis tool—one that goes beyond basic price charts and processed numbers. We extract our data directly from SEC 10-K and 10-Q filings to ensure that when you look at a balance sheet or a cash flow statement, you are seeing the numbers exactly how the company reported them. Our goal is to give you the tools to verify the narrative for yourself using clean, traceable data. Start researching now at GeminIQ.com.
Disclaimer: The content in this blog is for educational and entertainment purposes only and does not constitute financial, legal, or tax advice. Investing involves risk, including the loss of principal. The views expressed are my own and not intended as financial advice or a guarantee of future performance.