Marsh (MRSH) Q3 2026 Earnings: EPS Up 12%, Cash Flow Down 29%

By Chad Hartman
Published · Last updated
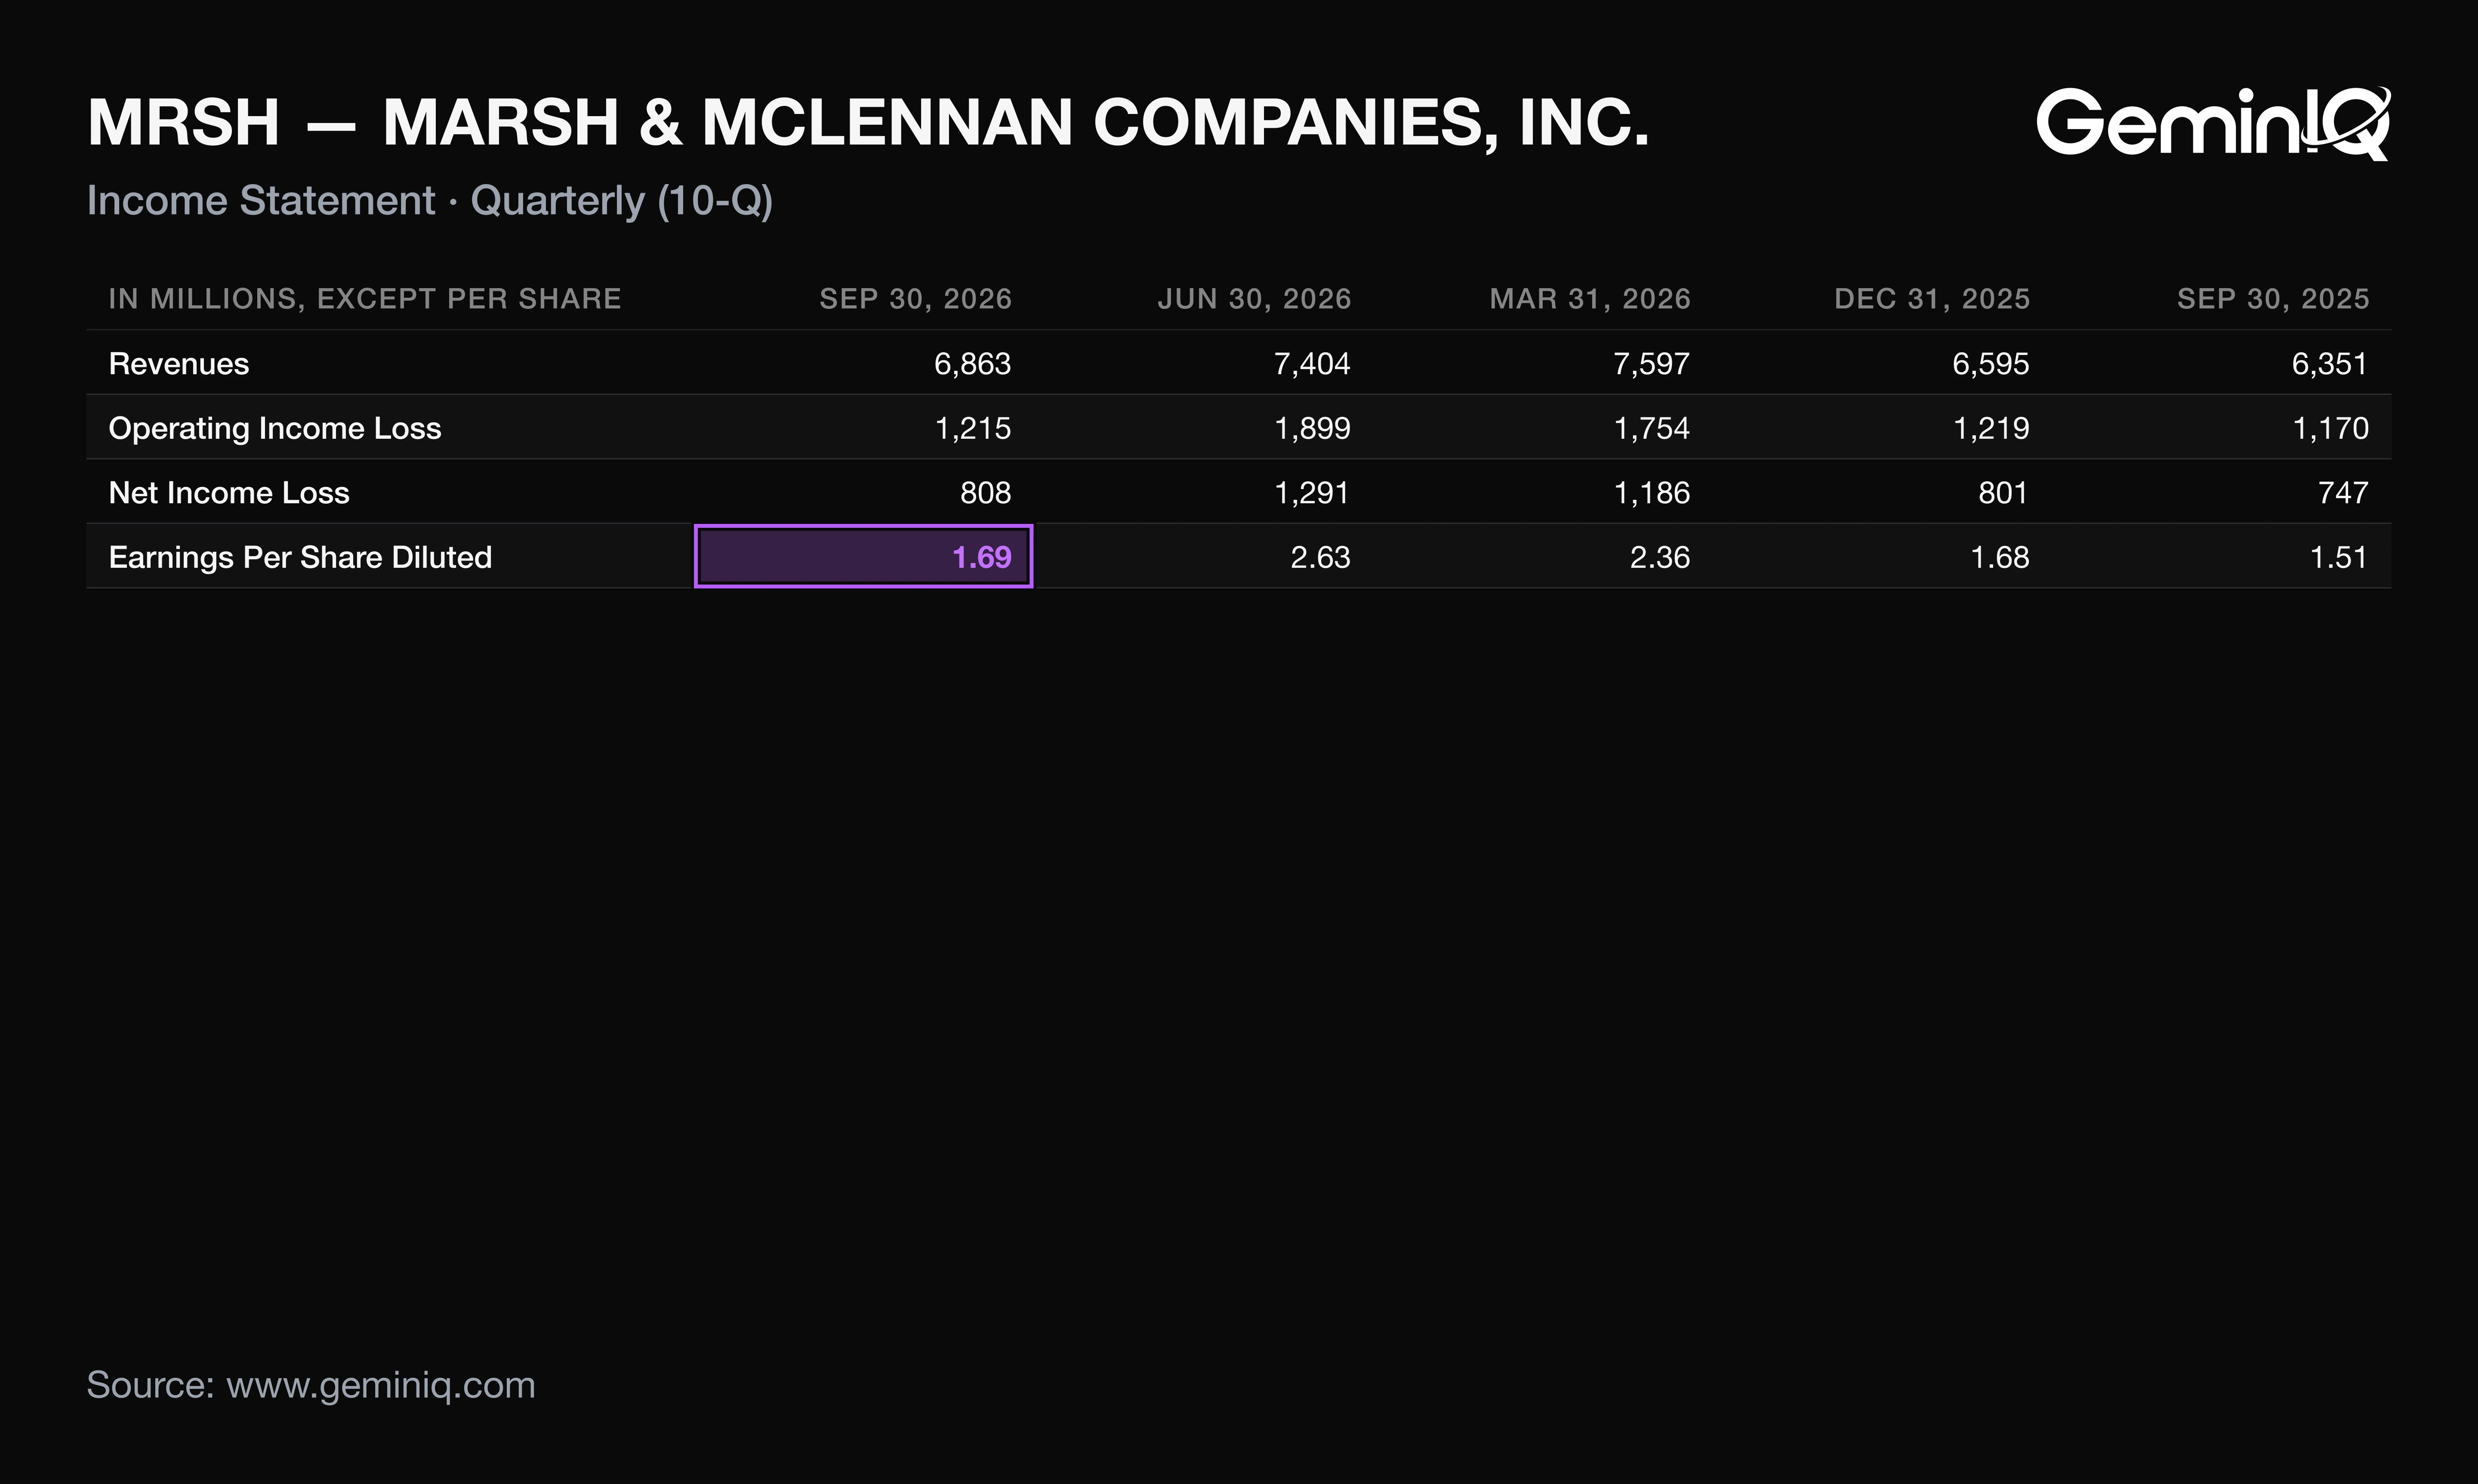
Marsh (MRSH) reported Q3 2026 revenue of $6.86 billion, up 8.1%, and diluted EPS of $1.69, up 11.9%, for the quarter ended September 30, 2026; it released results and filed its 10-Q on October 15, 2026. Over the same quarter, operating cash flow fell 29.0% to $1.48 billion while net income rose 8.2%. Earnings per share rose on a lower share count and a lower tax rate, and the cash behind them did not follow.
| Field | Value |
|---|---|
| Company | Marsh ($MRSH) |
| Quarter | Q3 FY2026, period ended September 30, 2026 |
| Earnings release | October 15, 2026 (Form 8-K) |
| 10-Q filed | October 15, 2026 |
| Revenue | $6.86 Billion (+8.1% YoY) |
| Diluted EPS | $1.69 (+11.9% YoY) |
| Operating margin | 17.7% (-0.7 pts YoY) |
| Operating cash flow (TTM) | $4.47 Billion |
| Operating cash flow (Q3) | $1.48 Billion (-29.0% YoY) |
Marsh Q3 2026 Revenue, EPS and Margins
Marsh's Q3 2026 revenue was $6.86 billion, up 8.1% from $6.35 billion, and diluted EPS was $1.69, up 11.9% from $1.51. Operating income rose only 3.8%, to $1.22 billion, so EPS grew about three times as fast as the operating line.
The Data: Operating margin was 17.7%, against 18.4% a year earlier and 25.6% in Q2, the second-lowest of the last 16 quarters. Net income rose 8.2% to $808 million while diluted shares fell 3.0% to 479 million, the lowest count since the record begins in 2009. The effective tax rate was 21.3%, against 25.1% a year earlier.
Why: EPS growth less net income growth leaves 3.7 points, which is the buyback. The lower tax rate supplied most of the remaining gap to operating income. The 10-Q says the tax effect of the Deasterra remeasurement gain alone cut the rate by 2.8 points; at last year's 25.1% rate, tax would have been about $39 million higher and EPS about $1.61, up roughly 7%. Revenue growth was 8.1% reported but 5% underlying, per the 8-K. Net margin of 11.8% matched last year and was the third-lowest of the last 16 quarters.
What Marsh's 10-Q Shows Beyond the Q3 2026 Press Release
The 8-K led with adjusted EPS up 10% to $2.03, which is $0.34 above GAAP EPS of $1.69, and quoted CEO John Doyle calling the quarter "strong." The nine-month figures in the same release tell a different story: GAAP EPS of $6.68 was down 1% from $6.75, while adjusted EPS of $8.29 was up 9%.
The Data: Ten points separate the two nine-month growth rates. The 10-Q's MD&A names the main item, a $569 million Greensill settlement charge, net of insurance proceeds, over nine months, with $144 million of it in Q3. That implies $425 million in the first half. Restructuring cost $79 million in Q3, against $46 million a year earlier, and Marsh raised its Thrive program estimate from $500 million to about $750 million, with expected annualized savings rising from $400 million to about $600 million. Other operating expenses rose 22% to $1.57 billion; compensation and benefits rose 4.7%.
Why: The Q3 items partly cancel. The $126 million Deasterra gain sits in revenue and the $144 million charge in expenses, a net of $18 million. Strip both and operating income is about $1.23 billion, up 5.4%, close to the release's 6% adjusted growth. Q3 alone supports the exclusions. The nine months do not support calling them incidental, since the charge ran through the first half and the restructuring estimate has just risen 50%. A program that grows mid-flight widens the gap between GAAP and adjusted EPS instead of closing it.
Marsh Q3 2026 Operating Cash Flow, Dividends and Debt
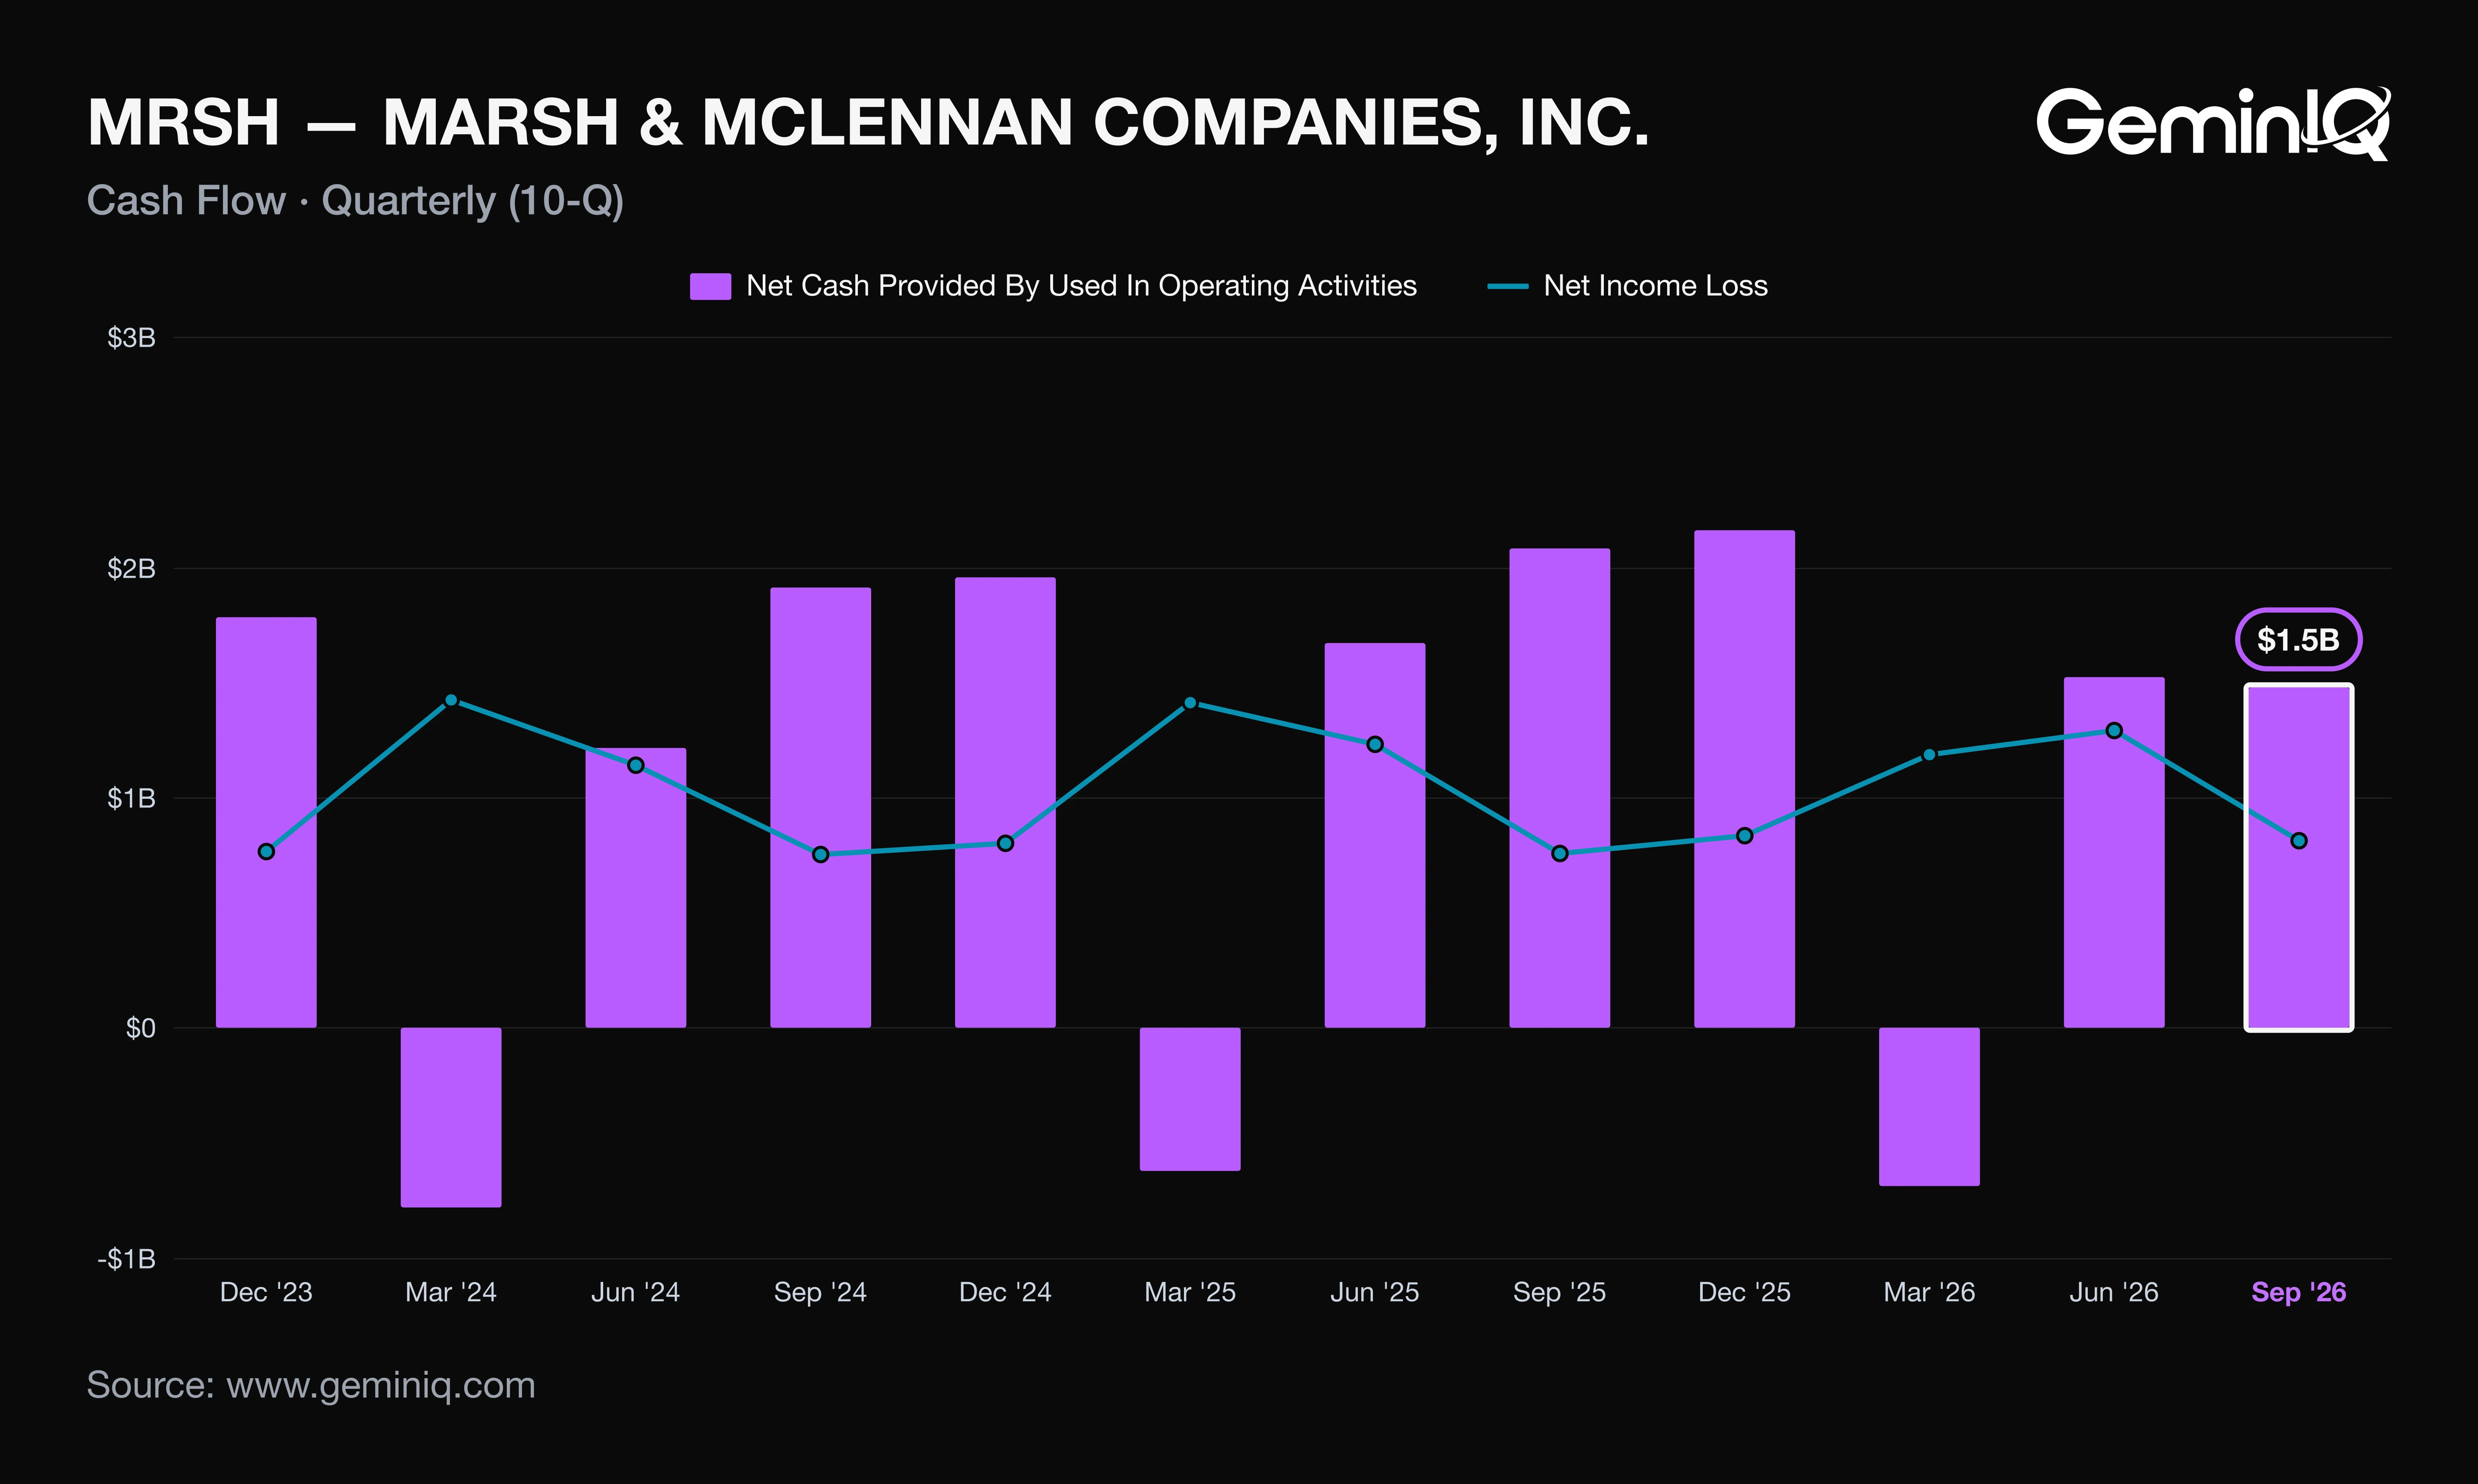
Marsh's Q3 2026 operating cash flow was $1.48 billion, down 29.0% from $2.08 billion a year earlier, and free cash flow of $1.40 billion fell 30.5%. A reader who saw net income up 8% would expect cash to follow, because the quarter's earnings were not described as unusual; instead cash conversion fell from 2.8 times net income to 1.8 times.
The Data: Operating cash flow was the sixth-lowest of the last 16 quarters. Capital expenditure of $81 million was too small to matter, so the shortfall sits inside operating cash. Trailing-twelve-month operating cash flow was $4.47 billion, down 12.1%, and GeminIQ's pre-calculated Return on Invested Capital (ROIC) slipped to 21.80% from 27.30%. Contract assets, revenue recognized but not yet billable, rose to $675 million from $540 million at December 31.
Why: Contract assets of that kind absorb operating cash, but a $135 million build cannot by itself explain a $600 million year-over-year gap, and the 10-Q pages reviewed do not attribute the rest. Meanwhile Marsh paid $476 million in dividends, a record for the last 70 quarters of data, and repurchased $500 million of stock. Together those equal about 70% of free cash flow. Commercial paper stood at $1.62 billion, against none at December 31, and the 10-Q attributes the $11 million rise in interest expense to higher short-term debt. GeminIQ's pre-calculated Net Debt to EBITDA was 1.00x, against 0.78x a year earlier.
How MRSH Stock Has Moved After Past Earnings Reports
Across the last eight 10-Q filings with a completed one-month window (filed October 2024 to July 2026), Marsh stock had a median one-month return of +1.2%, positive after 4 of 8. These figures describe how Marsh's stock moved after its past filings; they are a historical association, not a forecast.
The Data: One-month returns ran from -10.6% (FY2026 Q1, filed April 16, 2026) to +7.0% (FY2025 Q4, filed February 9, 2026). Three-month returns had a median of -2.2% and were positive after 0 of 8 filings, with a high of 0.0%. The two earlier Q3 filings were followed by one-month returns of -0.7% and -3.5%. This filing's window has not elapsed. See the Earnings Reaction Heat Map for each cell.
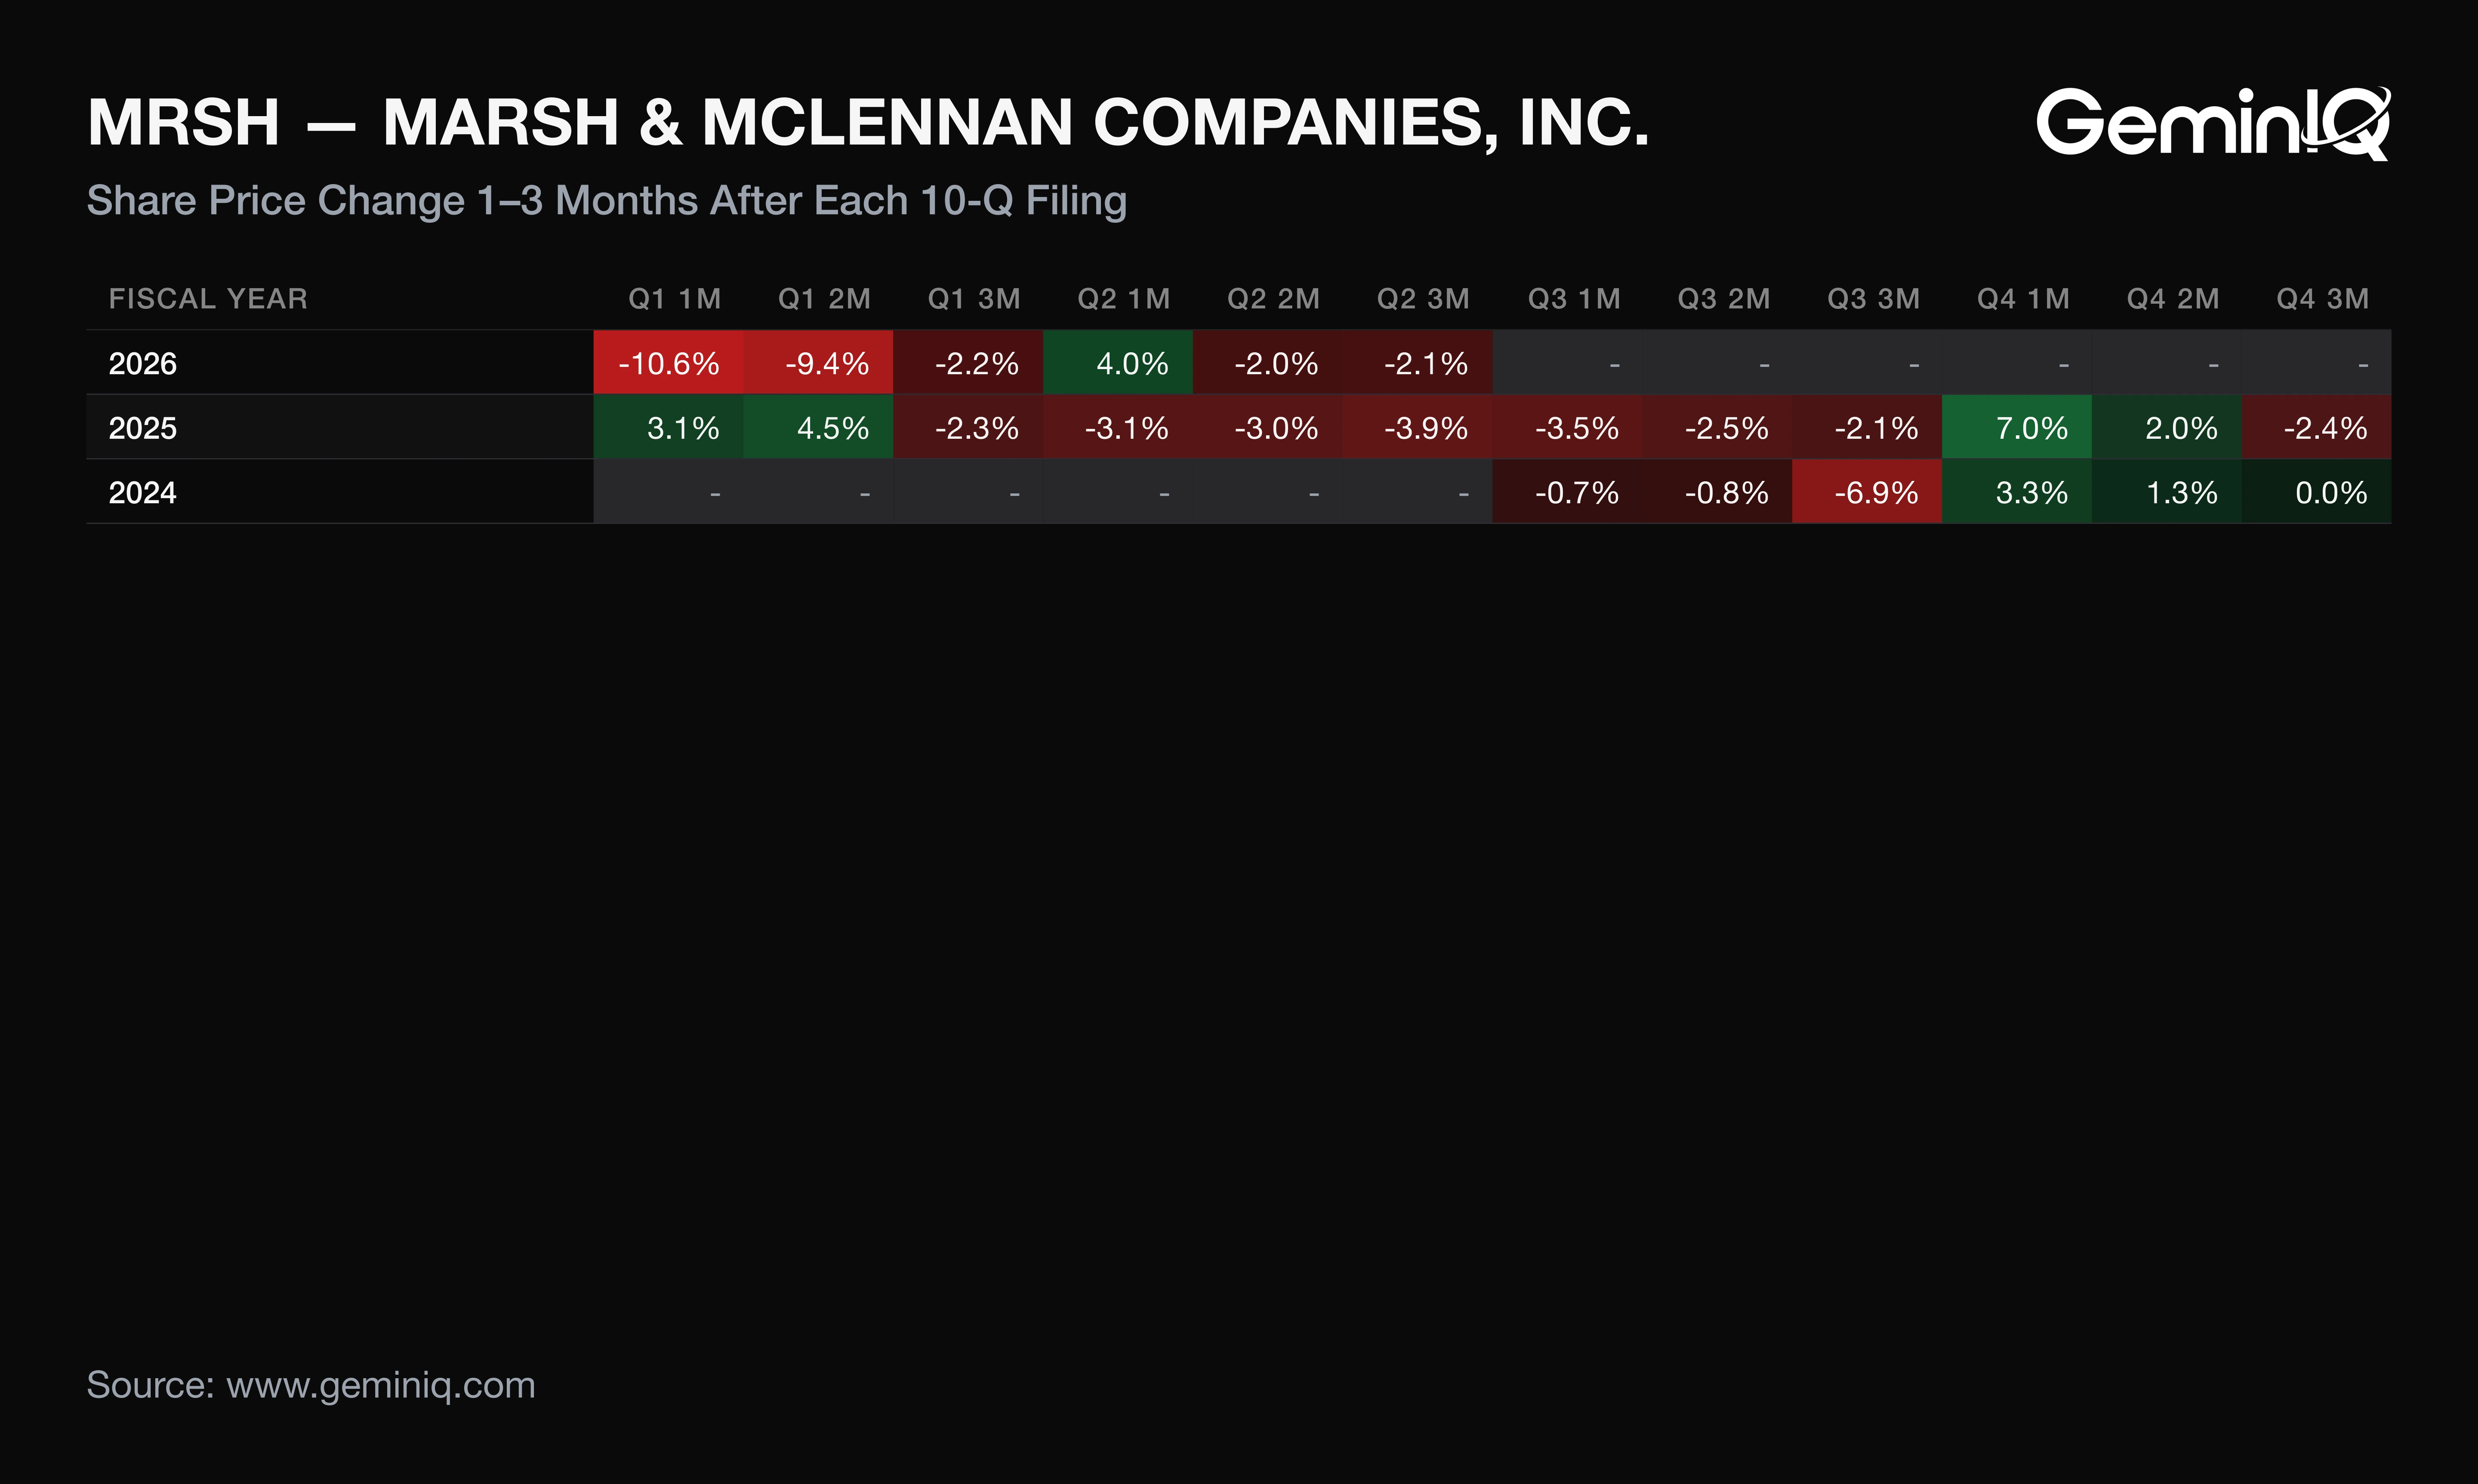
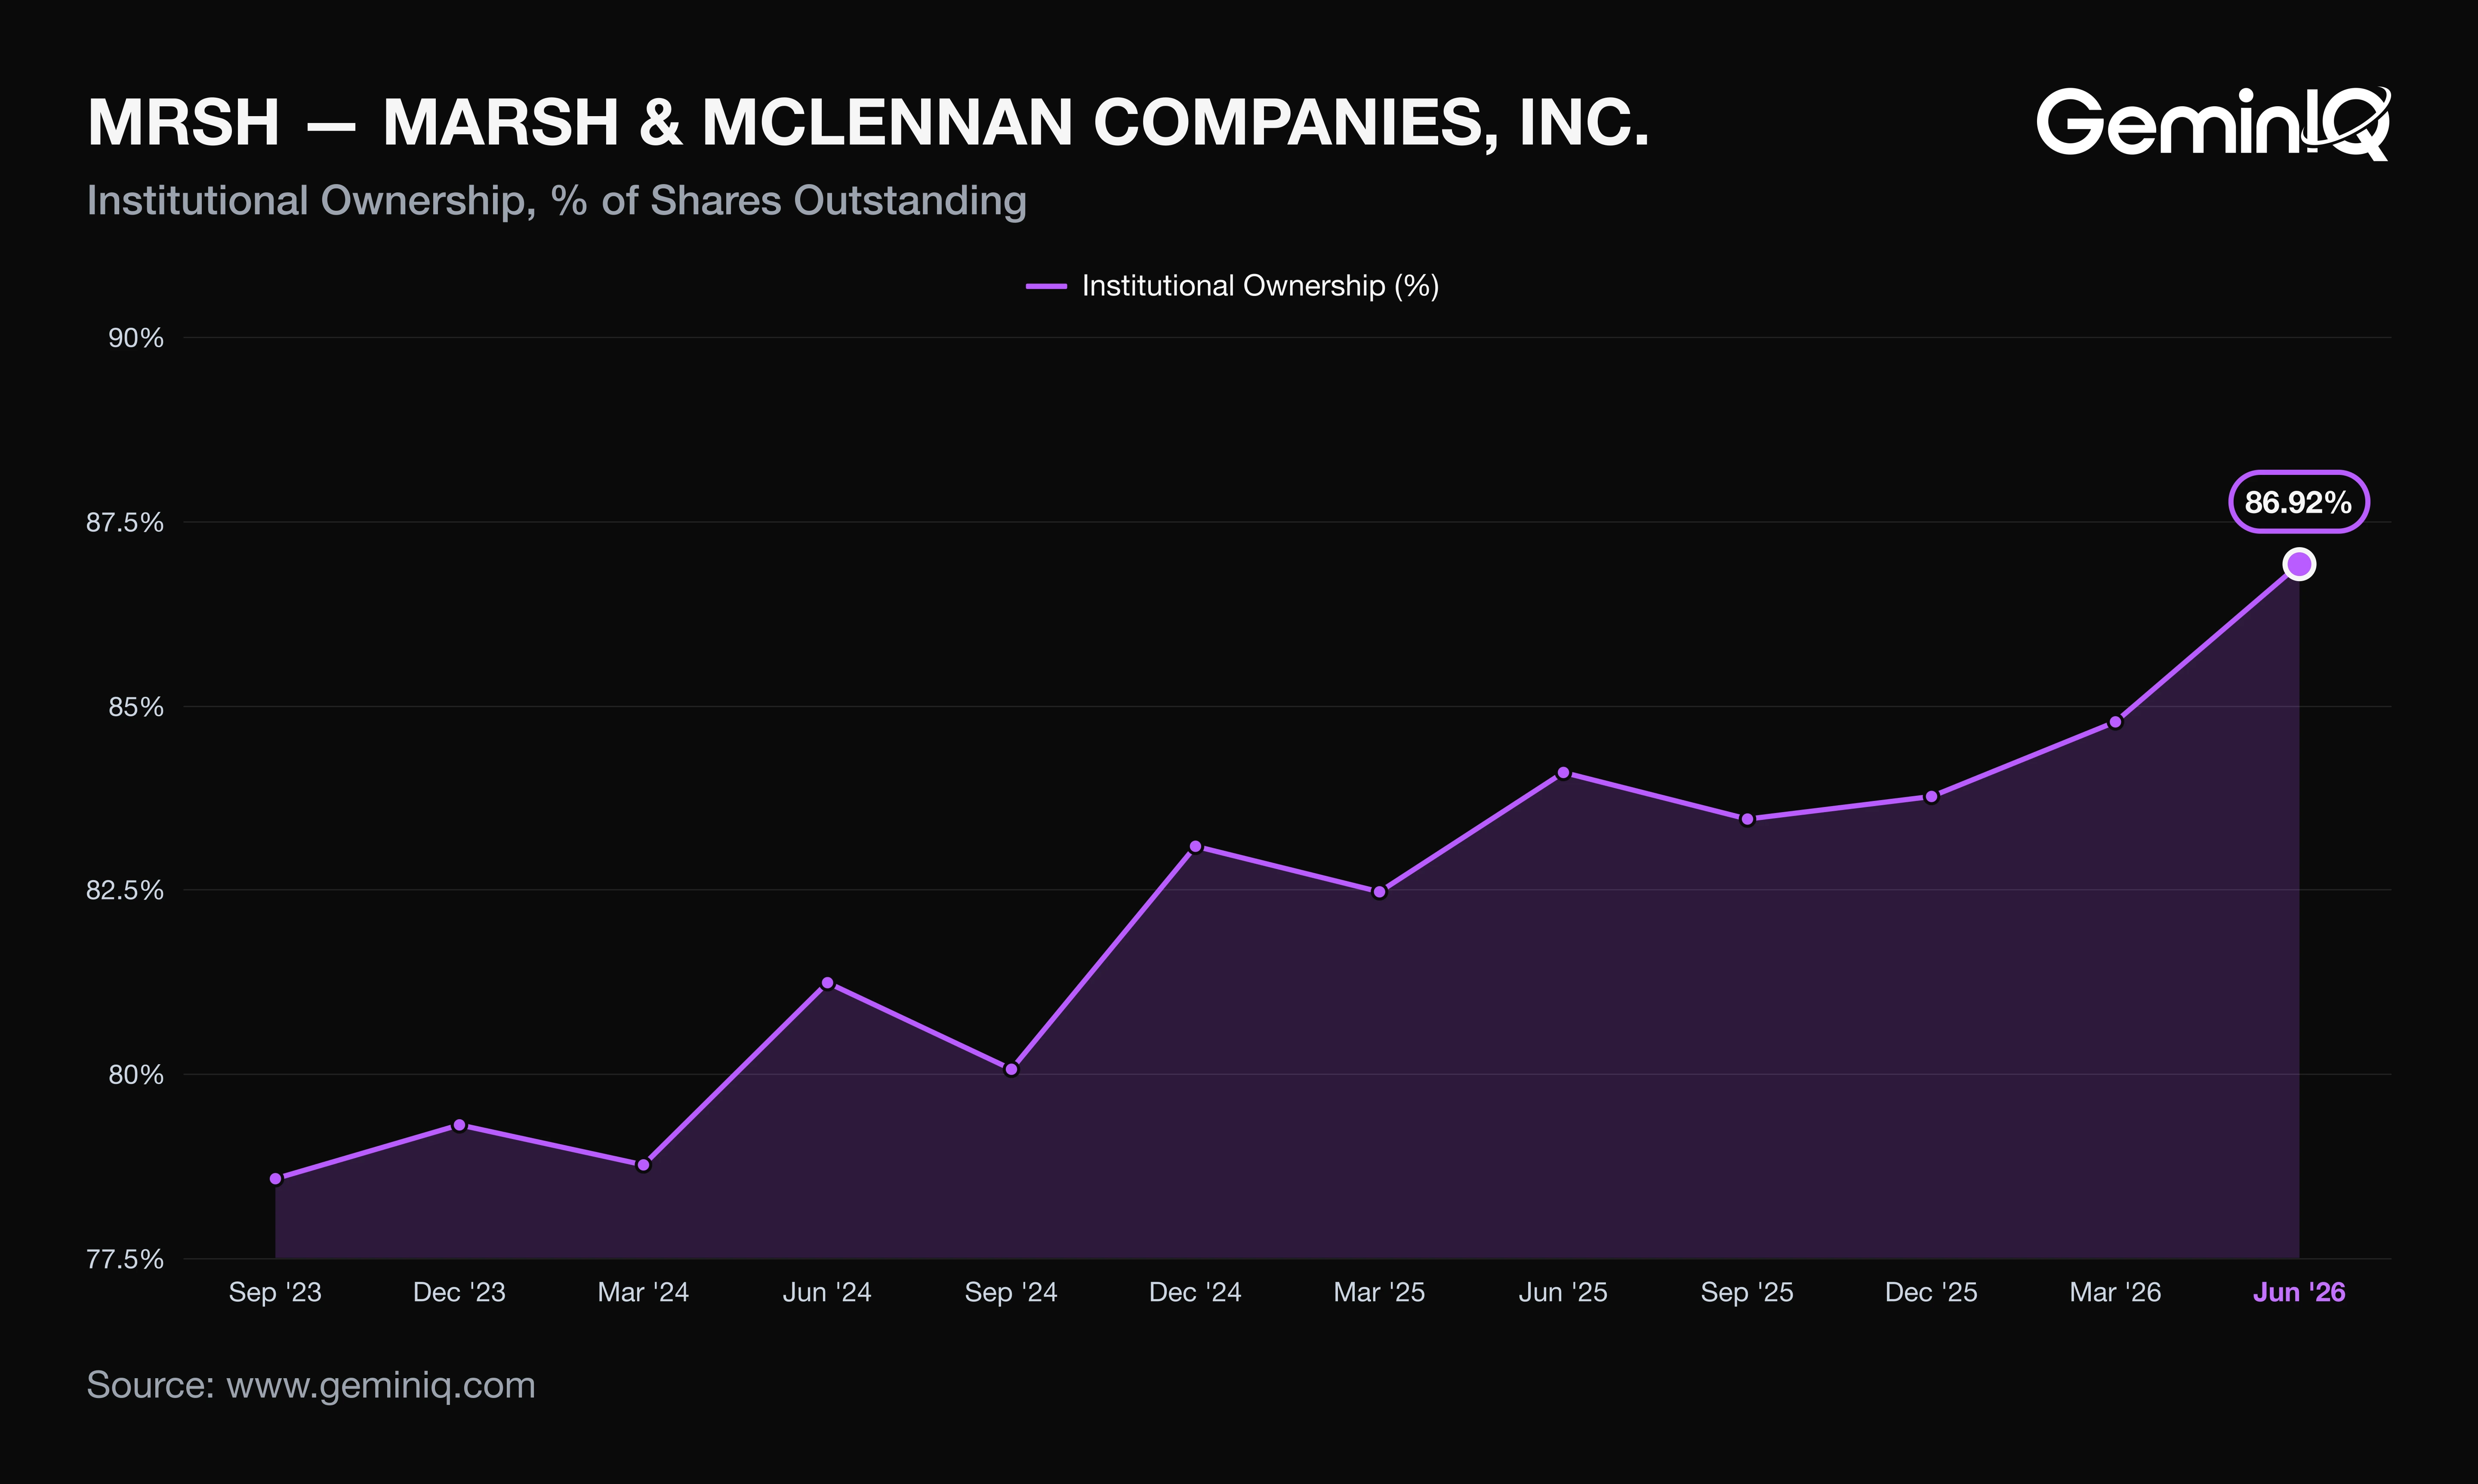
Why: Over this history the one-month window has split four and four and the three-month window has been uniformly flat to negative, a pattern in this company's own record rather than a cause traceable to any one quarter's fundamentals. Institutional ownership, per 13F filings, was 86.92% at June 30, 2026 (417.20 million of 480.00 million shares), up 2.83 points in a year and the highest of the last 16 quarters. The September 30 13F has not yet been filed. Form 4 data show 11 insider sales totaling $18.9 million and no purchases in the 12 months filed through September 2, 2026, with Doyle accounting for $12.7 million; the last purchase was July 30, 2025.
A quarter in which per-share earnings rise on a smaller share count and a lower tax rate while operating cash falls is an earnings number still waiting for cash to confirm it.
Frequently Asked Questions
When does Marsh report earnings?
Marsh reported Q3 2026 results and filed its 10-Q on October 15, 2026. Last year it filed its fourth-quarter results on February 9, 2026, a pattern from the filing record and not a forecast of the next date.
Is Marsh doing well financially?
Marsh's trailing-twelve-month net profit margin was 14.36%, down from 15.66% a year earlier, per GeminIQ's pre-calculated Net Profit Margin. Trailing operating cash flow was $4.47 billion, and Net Debt to EBITDA was 1.00x.
Does Marsh pay a dividend?
Yes. Marsh paid $476 million in dividends in Q3 2026 and $1.80 billion over the trailing twelve months, up 8.4%.
Where can I verify Marsh's Q3 2026 figures?
Marsh's Q3 2026 10-Q and its earnings release are both on SEC EDGAR, filed October 15, 2026.
Wall Street's data. Main Street's price.
Institutional terminals charge thousands a year for as-filed accuracy. GeminIQ gives you the same thing for a fraction of the cost: financials built directly from raw SEC EDGAR filings, not third-party APIs, with full XBRL traceability back to the original 10-K or 10-Q. No normalized guesswork, just calculated metrics, charts, screeners, and watchlists built on numbers exactly as the company reported them. Start researching now at GeminIQ.com.
All financial figures cited in this article reference MARSH & MCLENNAN COMPANIES, INC.'s Q3 2026 10-Q (filed October 15, 2026, period ending September 30, 2026), with guidance and management commentary drawn from the company's Form 8-K earnings release (filed October 15, 2026). All SEC filings are publicly available at SEC EDGAR and SEC EDGAR.
Disclaimer: The content in this blog is for educational and entertainment purposes only and does not constitute financial, legal, or tax advice. Investing involves risk, including the loss of principal. The views expressed are my own and not intended as financial advice or a guarantee of future performance.