Net-Net Stocks: Graham's Liquidation Formula in 2026
By Chad Hartman
Published June 8, 2026 · Last updated June 14, 2026
The financial media's verdict on Benjamin Graham's net-net strategy is swift and confident: the approach died with the Great Depression, the modern market is too efficient for liquidation-value investing, and anyone still hunting for net-nets is chasing ghosts. That verdict is wrong — but it is wrong in a specific, important way that most coverage misses entirely. The academic record documents meaningful excess returns from net-net portfolios well into the 21st century. What has changed is not whether the strategy works but where the opportunities appear, how many names are in the universe at any given time, and — critically — whether the investor has access to the accurate balance sheet data the formula demands. A net-net calculation is only as reliable as the current assets number underneath it, and that number is where most screening tools break down before the analysis even begins.
This post covers everything you need to run Graham's net-net strategy in 2026: the formula, the historical evidence, the data quality traps mainstream screeners ignore, and how to use GeminIQ's Stock Screener to surface candidates the way Graham himself would have — from primary source data.
Table of Contents
- What Is a Net-Net Stock?
- Why Graham's Net-Nets Worked: The Historical Context
- The Academic Record: Does Net-Net Still Generate Returns?
- The NNWC Formula in Practice
- The One-Third Rule: Net-Net Risk in Plain English
- The Data Quality Problem
- How to Find Net-Net Stocks in GeminIQ
- Net-Net and the Broader Value Toolkit
What Is a Net-Net Stock?
A net-net stock is a company whose market capitalization falls below its net current asset value (NCAV) — the dollar amount that would remain if you took all of the company's current assets, subtracted every liability it carries (current and long-term), and sold nothing else. No factory equipment. No real estate. No brand value. No going-concern premium. Just the liquid pile, measured against the total claims on the business.
Graham formalized this in both Security Analysis (1934) and The Intelligent Investor (1949), calling the figure Net-Net Working Capital (NNWC). The formula is:
NNWC = Current Assets − Total Liabilities
When a company's market capitalization falls below its NNWC, the market is valuing all of its fixed assets, long-term investments, and future earnings at zero — or less. Graham's argument was that this represented a structural irrationality: no rational liquidator would pay less for a business than the net proceeds of selling just its cash, receivables, and inventory. If you can buy a dollar of liquid assets for 67 cents, the margin of safety exists even if the underlying business never earns another dollar of profit.
This is meaningfully more extreme than a standard price-to-book screen. A company trading at P/B 0.6× might have the bulk of its book value locked in property, plant, and equipment — assets with uncertain liquidation value and real depreciation risk. A true net-net has a market cap below the sum of its current assets alone after subtracting all liabilities. The distinction is what gives the strategy its unique risk-reward profile. For a deeper look at how Graham used P/B and tangible book value as screening tools, see our Value Investing Glossary.
Why Graham's Net-Nets Worked: The Historical Context
Graham developed the net-net framework after the 1929 crash, when the U.S. equity market had collapsed far enough that dozens of solvent, operating businesses were genuinely trading at sub-liquidation prices. His own investment partnership ran concentrated net-net positions throughout the 1930s and into the 1940s. This was not a theoretical exercise — it was the primary approach generating returns for serious value investors for nearly two decades.
The conditions that made Depression-era net-nets plentiful were not subtle. Companies with sound current asset bases were being sold at prices that implied their entire fixed asset base, future earnings, and franchise value were worthless. A panicked and illiquid market was pricing the cost of selling an ownership stake far below the proceeds of simply shutting the business and collecting the receivables. For a patient, solvent investor with a long time horizon, the asymmetry was not difficult to see.
As the post-war economy recovered and institutional investing grew, the population of large-cap U.S. net-nets evaporated. By the time Graham published the final edition of The Intelligent Investor in 1973, he acknowledged that the strategy's easiest application had passed. But he did not call it dead — he described it as harder to execute and requiring greater diversification than it had in the 1930s. That distinction carries directly into 2026, and it is what the media consistently misses when it declares the strategy obsolete.
The Academic Record: Does Net-Net Still Generate Returns?
The academic record is considerably more favorable to net-net investing than mainstream dismissals suggest.
Henry Oppenheimer's 1986 study, "Ben Graham's Net Current Asset Values: A Performance Update," is the foundational piece of documented evidence. Studying U.S. stocks meeting the NCAV criterion from 1970 to 1983, Oppenheimer documented average annual returns of approximately 29%, versus roughly 11% for the broader market benchmark over the same period. The excess return — approximately 18 percentage points per year, sustained over thirteen years on a clearly defined mechanical strategy — is not a marginal edge. The companies in that universe were not glamorous: micro-cap industrial companies, small retailers, obscure manufacturers. They were cheap precisely because no one wanted to own them. That structural unpopularity is what preserved the premium.
Subsequent academic work confirmed that the net-net effect had not fully disappeared, though excess returns compressed as the strategy became more widely known and the domestic universe shrank. International markets produced the clearest modern evidence. Japan had a large and persistent population of net-net stocks throughout the 2000s and 2010s, driven by corporate governance norms that prioritized balance sheet accumulation over shareholder returns. Several well-documented value investors generated substantial excess returns operating in that environment.
In the U.S. today, true net-nets are rare among any company of meaningful size. Most appear in micro-cap and nano-cap names — often in declining industries, with genuine operational problems that explain why the market is assigning a sub-liquidation price. But standard financial media doesn't read the footnotes. It sees a small, unappealing company and dismisses both the stock and the strategy. The data says the dismissal is premature.
The NNWC Formula in Practice
Calculating NNWC is straightforward in principle and tricky in practice, for exactly the reason that makes this strategy worth pursuing: the inputs are less reliable than they look.
Step 1: Pull current assets from the balance sheet. This is the sum of cash and cash equivalents, short-term investments, accounts receivable (net of allowances), inventory, and prepaid expenses. GeminIQ's Financial Statements view surfaces these line items exactly as reported in the SEC filing, without the normalization that collapses sub-components into aggregated figures.
Step 2: Subtract total liabilities — not just current liabilities. This is the single most common error in net-net analysis. Long-term debt, deferred tax liabilities, operating lease obligations, pension liabilities, everything. A company can show attractive net current assets while carrying substantial long-term debt that would wipe out the position in a liquidation scenario. The correct formula uses total liabilities, full stop.
Step 3: Compare to market capitalization. If NNWC exceeds market cap, the company is a candidate. The ratio of NNWC ÷ Market Cap is the key figure. Graham's own practice targeted stocks where NNWC represented at least 150% of market capitalization — a margin of safety on top of the margin of safety.
Graham did not stop at the gross current assets figure, and neither should you. His private calculations applied conservative haircuts to each component of current assets: receivables were discounted to approximately 75 cents on the dollar to account for collectability risk, inventory was carried at roughly 50 cents on the dollar to account for impairment typical in forced liquidations, and other current assets were written down further still. Cash and short-term equivalents were taken at face value. Applying these haircuts produces a more conservative NNWC figure that Graham considered more reflective of what an investor would actually recover. GeminIQ's pre-calculated Current Ratio and Quick Ratio serve as initial liquidity filters, but the haircut-adjusted NNWC requires pulling the underlying component data from the as-filed balance sheet — a task GeminIQ's Financial Statements view makes tractable.
The One-Third Rule: Net-Net Risk in Plain English
Graham was clear-eyed about the strategy's limitations in a way that most modern summaries omit. His documented observation — drawn from his own extensive experience running net-net portfolios — was that within a diversified basket, roughly one-third of companies would recover to fair value and generate substantial gains, roughly one-third would remain cheap indefinitely without recovering (a slow grind near zero excess return), and roughly one-third would continue to deteriorate, consuming capital.
That distribution is not a problem for the strategy — it is the strategy. Net-net investing has never been about picking the individual winners within the universe. It is a portfolio approach built on the actuarial logic that the average outcome across a sufficiently diversified basket of deeply discounted companies is positive, even when individual names are genuinely troubled businesses. Graham recommended holding 20 to 30 positions simultaneously, not three or five. Concentrated bets on individual net-nets are a fundamentally different — and considerably riskier — approach that Graham himself did not endorse.
The practical implication: an investor who buys a single net-net because the NNWC ratio is attractive has not replicated Graham's strategy. They have made a concentrated bet on a troubled company with unknown catalysts. The position-sizing discipline and diversification requirement are integral to how the excess returns documented in the academic literature were generated.
GeminIQ's pre-calculated Altman Z-Score is a useful first-pass solvency check to layer on net-net candidates. Graham's framework assumed the company is solvent and has not drawn down cash to crisis levels — candidates with Altman Z-Scores below 1.8 (the distress zone) represent a different kind of risk than a merely unfashionable company trading below liquid asset value. They are not automatically excluded: some genuine recovery situations exist at low Z-Scores. But they require a separate, explicit solvency assessment before sizing any position.
The Data Quality Problem
Net-net screening is more sensitive to balance sheet accuracy than almost any other quantitative strategy because the entire thesis rests on the liquidation value of current assets. A 10% error in the current assets figure can move a company from a true net-net with 1.3× NNWC coverage to a company that does not qualify at all. That is not a rounding issue — it is the difference between a margin of safety and a false signal.
Three specific failure modes affect standard screening data when applied to this strategy.
Receivables quality. Standard financial data aggregators report total receivables as a single net line item. But as-filed XBRL data from SEC filings frequently includes separate disclosures for trade receivables, related-party receivables, and the allowance for doubtful accounts as distinct line items. A company that has quietly increased its allowance for doubtful accounts — a common early indicator of credit deterioration — has a lower true receivables value than the headline net figure suggests. When an aggregator collapses these into a single number, the increase in the allowance is invisible. GeminIQ preserves the as-filed line item structure, letting the analyst see the receivables sub-components exactly as the company reported them to the SEC.
Inventory valuation. Graham's 50 cents on the dollar haircut for inventory was not arbitrary — it reflected the real discount typically required to liquidate inventory in a distressed scenario, where finished goods may be perishable, work-in-process has limited resale value, and raw materials must be sold in bulk. Getting the haircut right requires seeing the inventory breakdown in the filing: finished goods versus work-in-process versus raw materials, LIFO reserve disclosures, write-down history. Most aggregator screeners apply book value inventory without any sub-component visibility. GeminIQ's Financial Statements view links back to the underlying XBRL source for each balance sheet line, preserving the filing's original inventory classification.
Post-ASC 842 lease liabilities. Since the adoption of ASC 842 in 2019, operating lease obligations appear on the balance sheet as right-of-use assets and corresponding liabilities. The current portion of those operating lease liabilities is a real claim on the company's near-term cash — it functions, in practice, as a current liability. But the classification of these as current versus non-current varies meaningfully across filers, and an aggregator applying a normalized balance sheet template can misclassify or omit them, understating the liability side of the NNWC equation. GeminIQ extracts lease liabilities as filed, without normalization. The metric tells the story — but only when the metric is sourced from the right place.
A standard screener will flag a micro-cap trading at P/B 0.4× and surface it as a net-net candidate. By pulling the raw balance sheet via GeminIQ's Financial Statements view, you can verify whether the receivables allowance has been growing, whether the inventory is finished goods or work-in-process, and whether lease liabilities are fully captured on the liability side. That verification is the work. For a full breakdown of why this matters across strategies, see our post on verifying financial data against the SEC filing.
How to Find Net-Net Stocks in GeminIQ
GeminIQ's Stock Screener surfaces net-net candidates using filters built from as-filed SEC data. Because every metric is sourced directly from the raw EDGAR filing rather than a third-party aggregator, the Current Ratio, Price-to-Book Ratio, and Debt Ratio values you are filtering on reflect the actual balance sheet — not a normalized version of it.
The GeminIQ Net-Net Stocks Screener uses three filters to identify the candidate pool: Current Ratio ≥ 2.0 (strong current asset coverage), Price-to-Book Ratio ≤ 0.75 (trading well below book value), and Debt Ratio ≤ 0.5 (manageable total liabilities relative to assets). Set the sort to Price-to-Book ascending to surface the deepest discounts first.
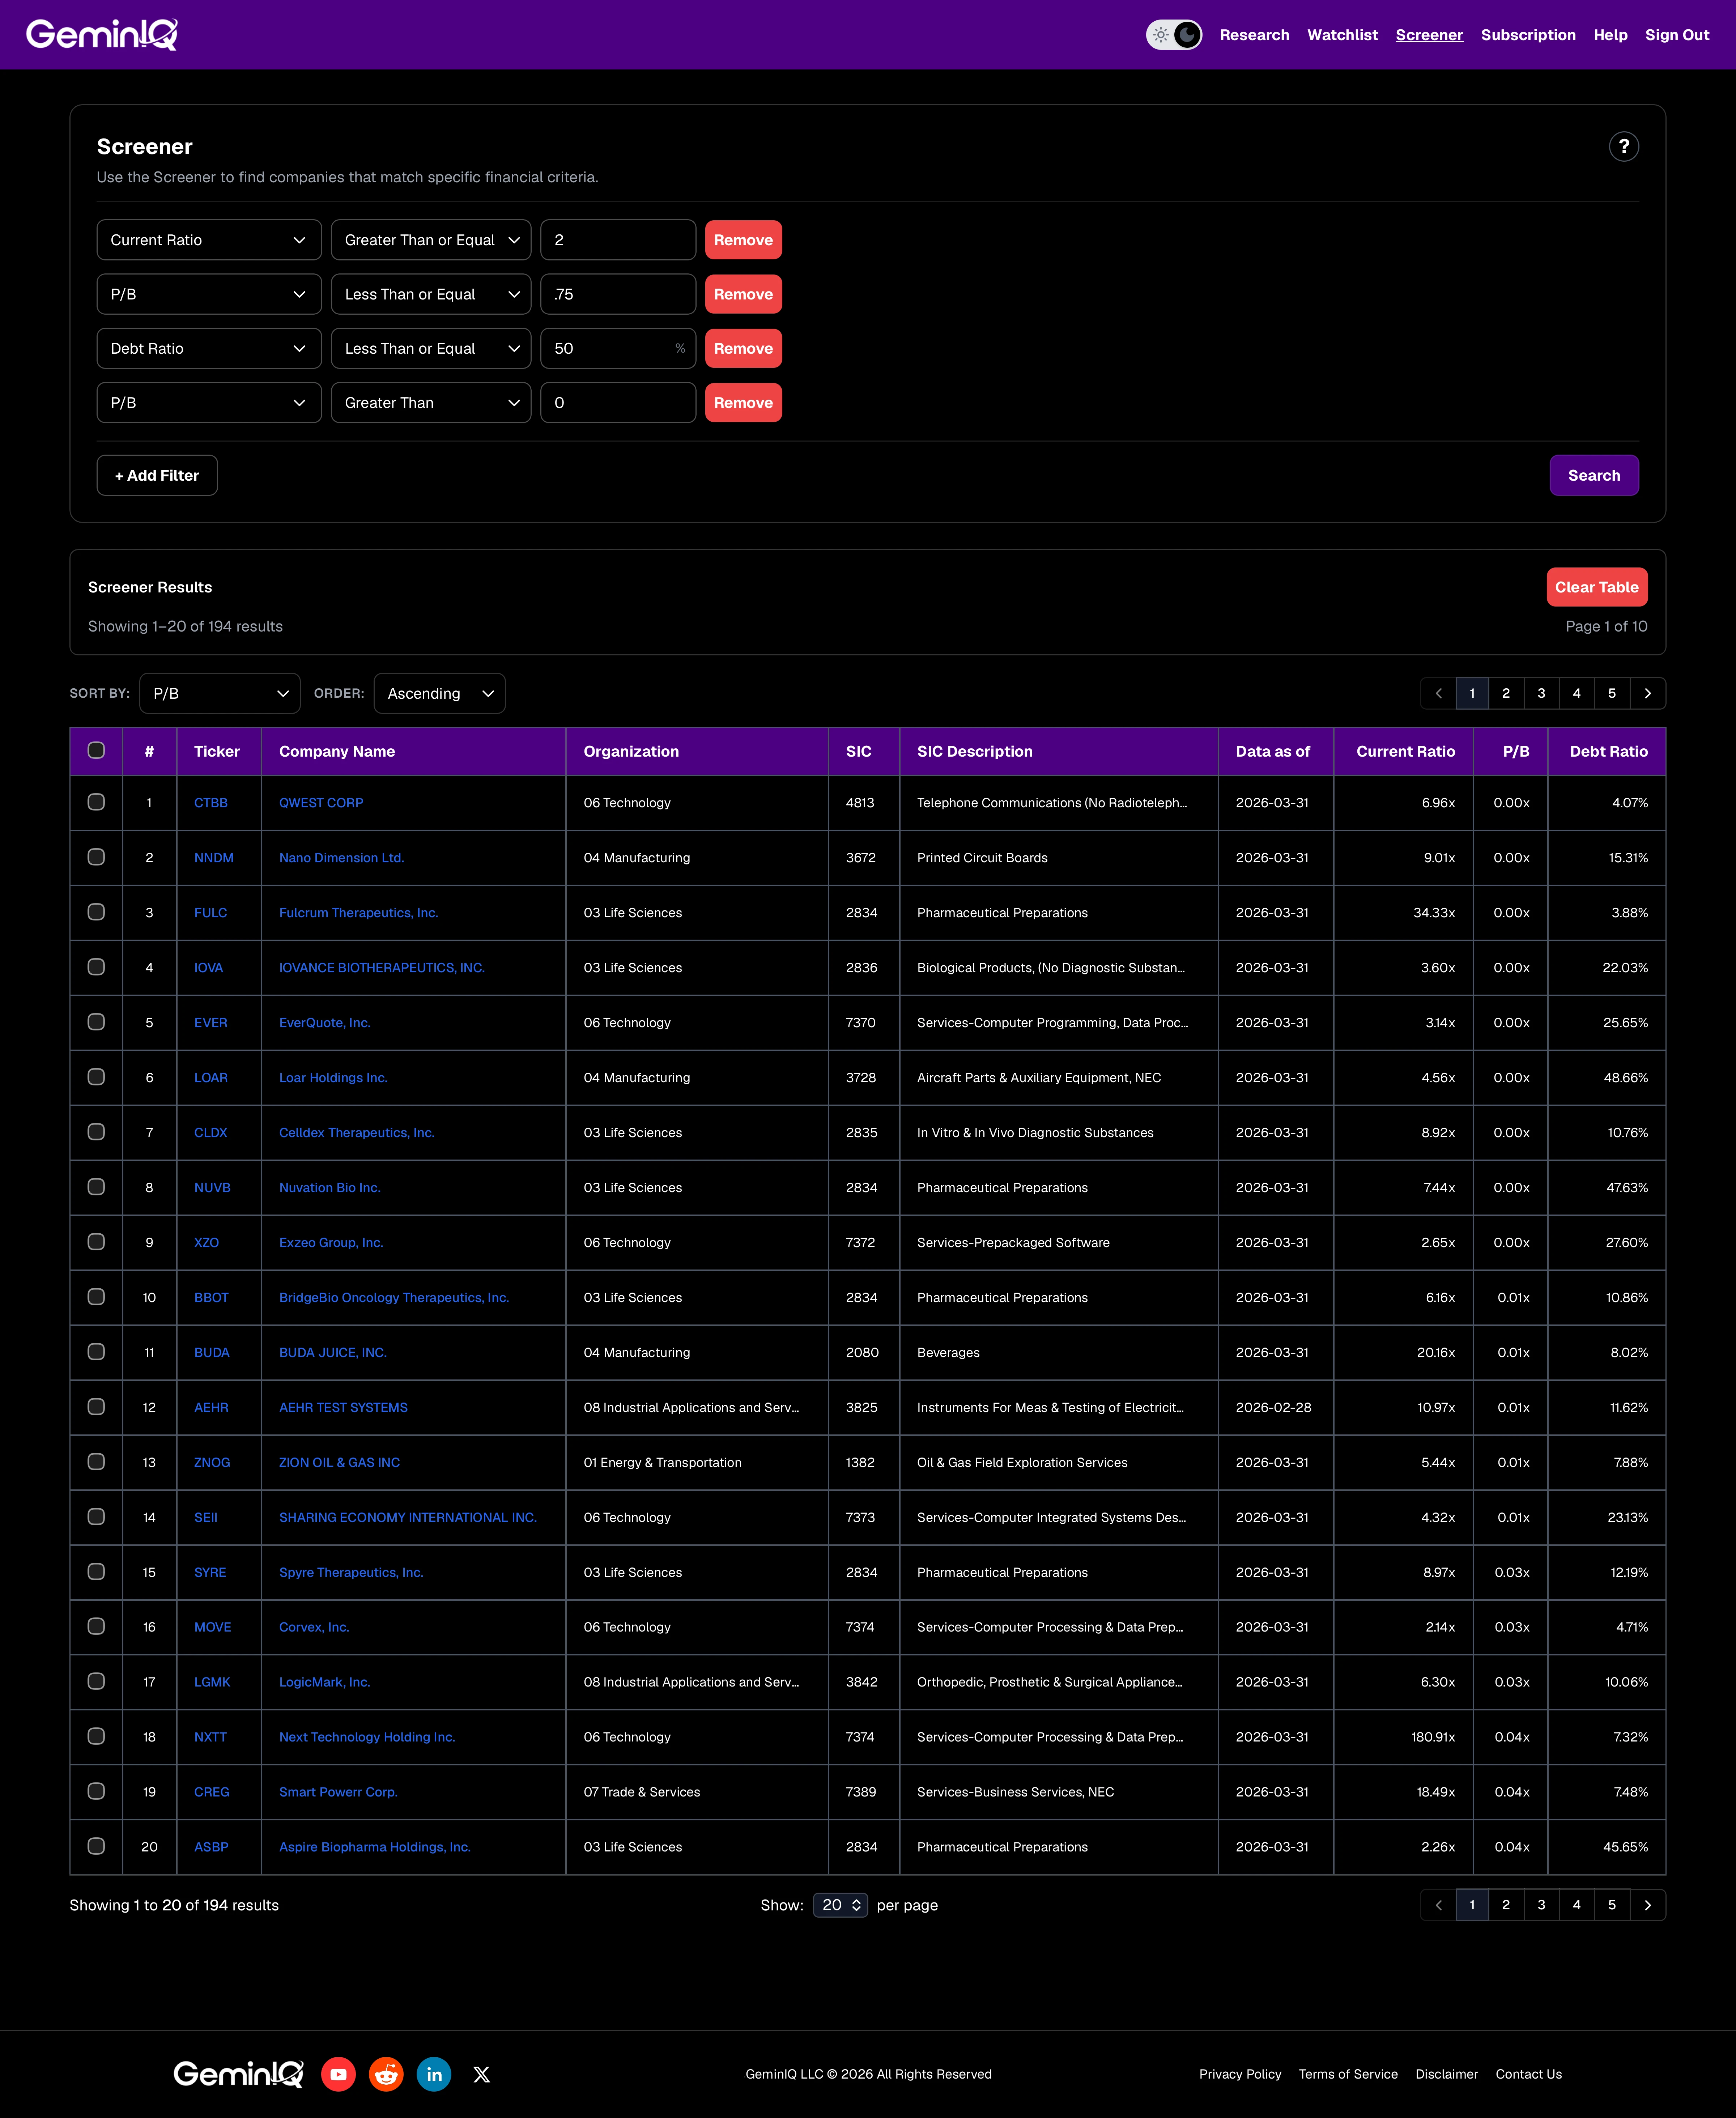
For each candidate returned, the confirmation step requires opening the company's Financial Statements view and manually computing: (Current Assets − Total Liabilities) ÷ Market Cap. Any company where this ratio exceeds 1.0× is a true Graham net-net. Any company where it exceeds 1.5× — the margin of safety on top of the margin of safety — warrants the closest attention.
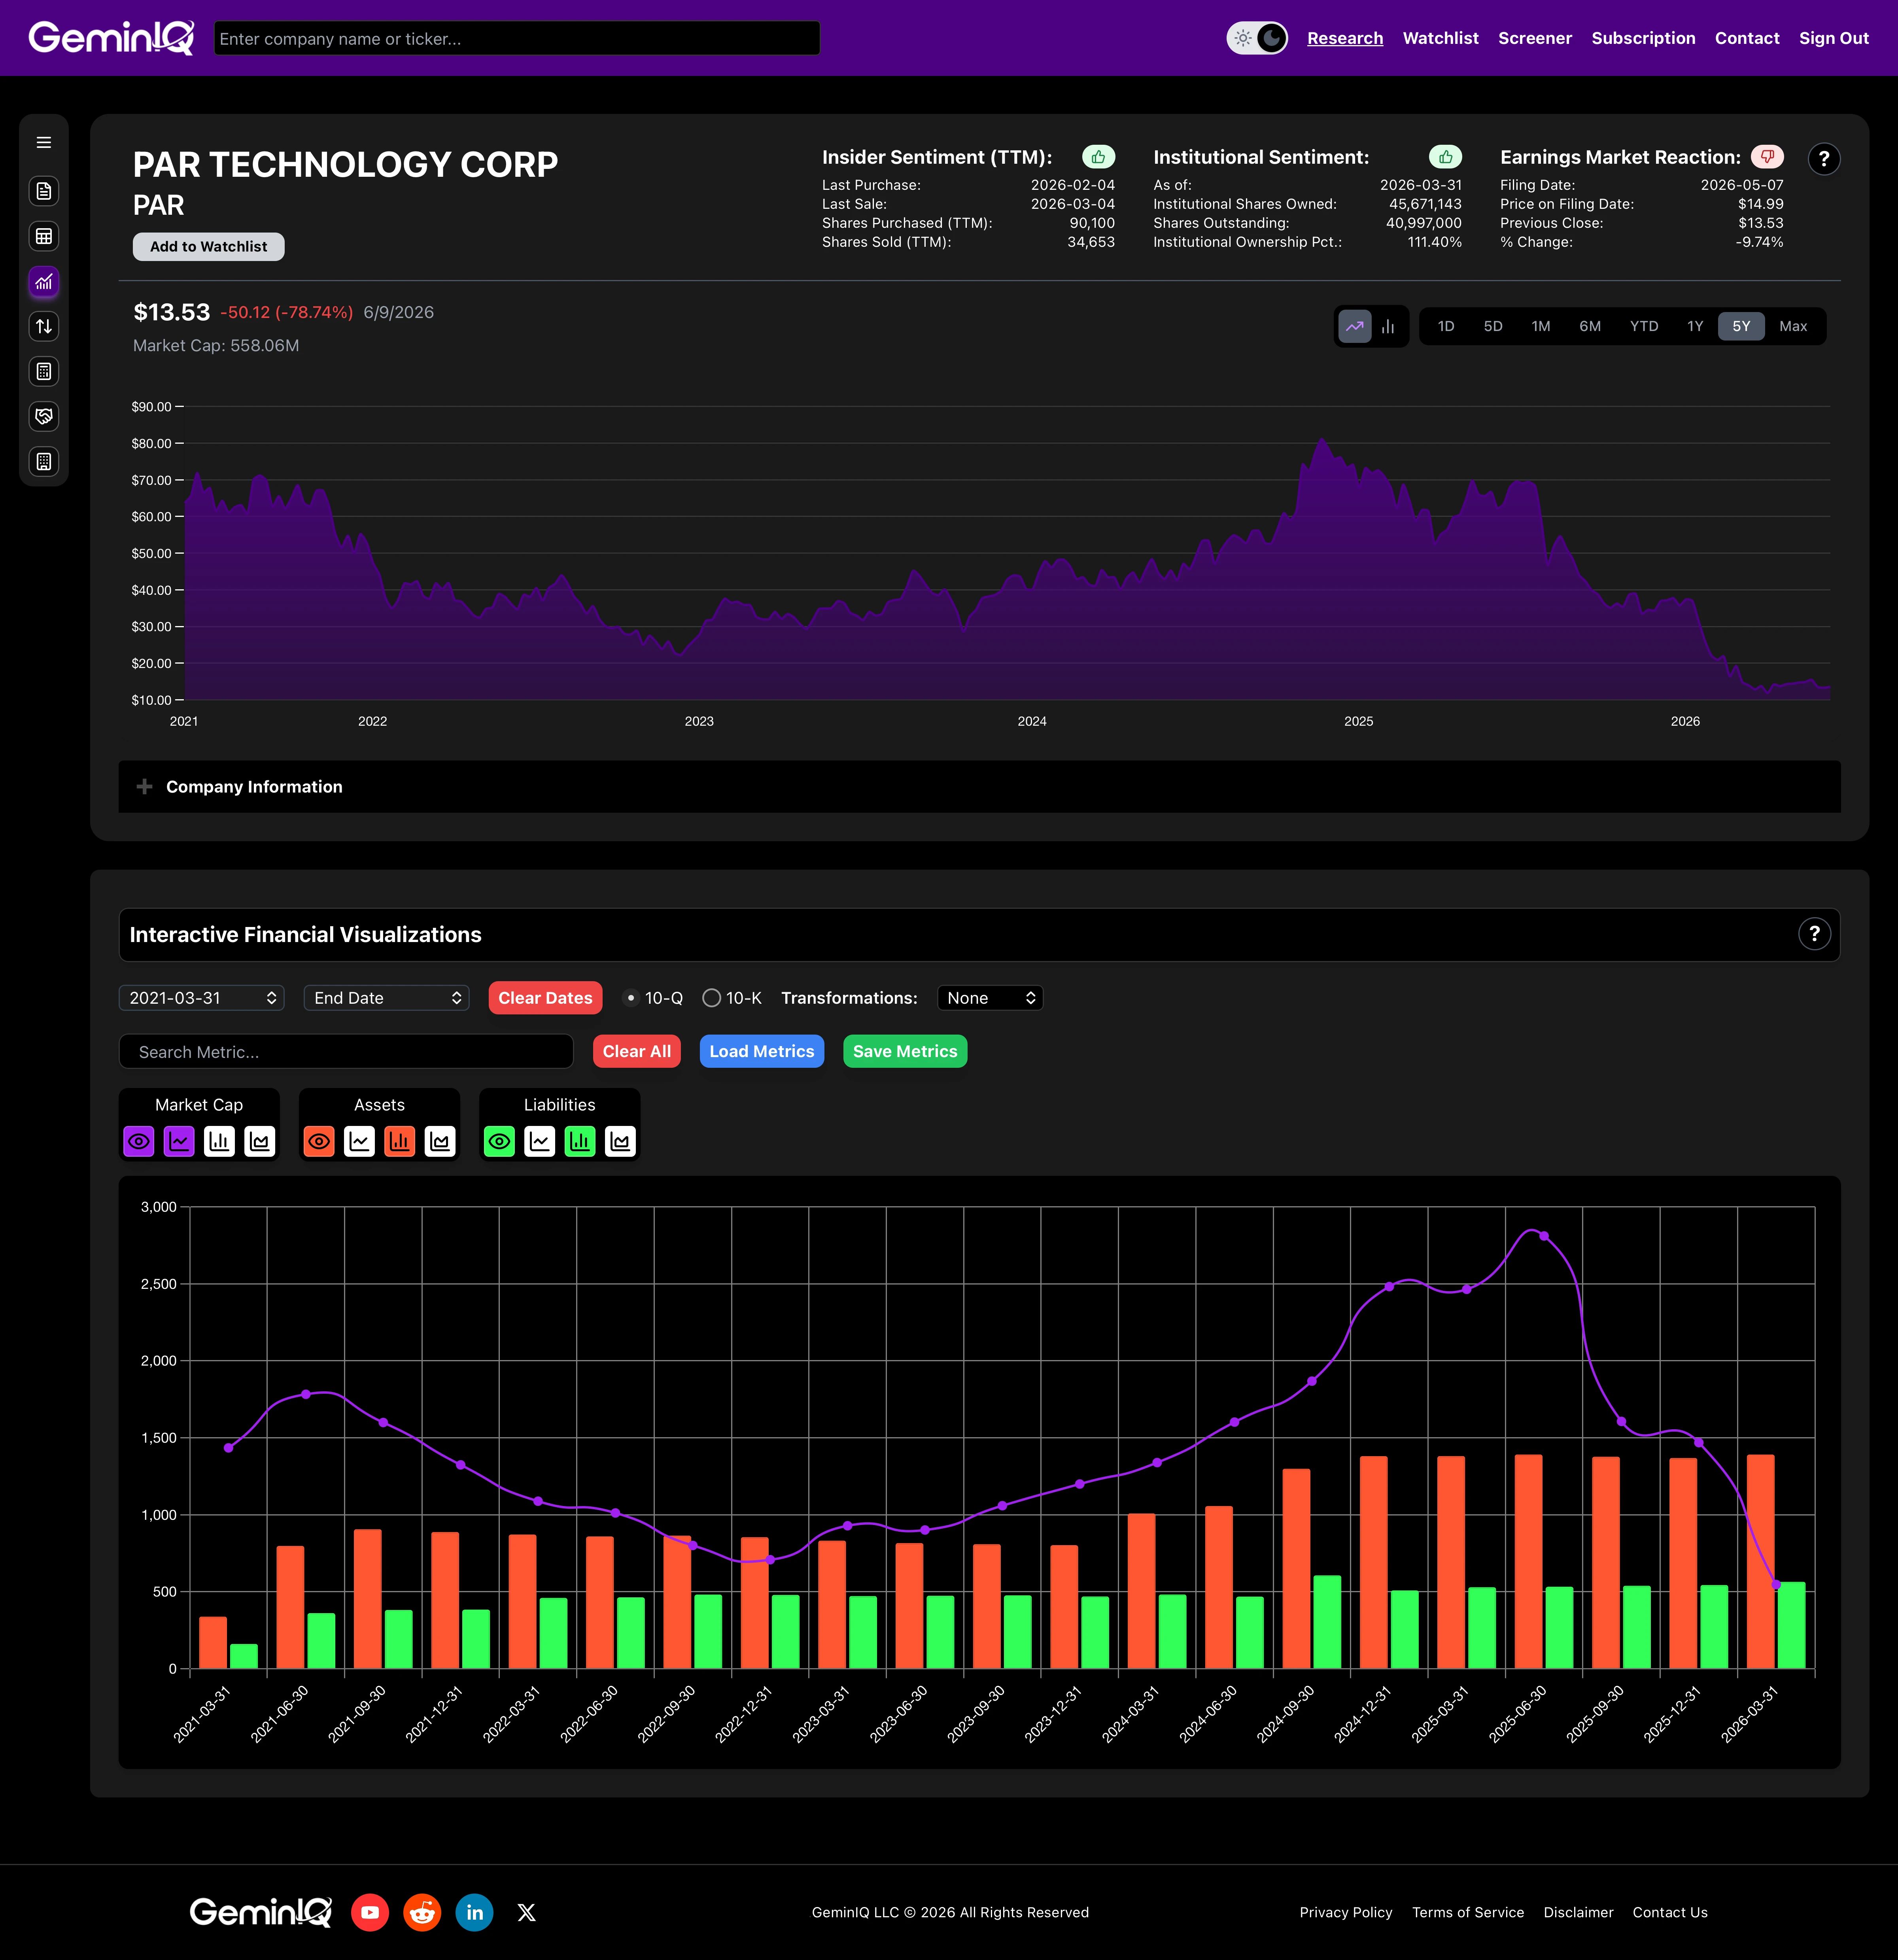
After confirming net-net status, GeminIQ's Visualizations tab allows you to chart total assets, total liabilities, and market cap side by side across reporting periods. A company where liabilities are growing faster than assets quarter over quarter is a deteriorating candidate. One where the asset base is stable or expanding while market cap remains compressed is a more durable position. Trend matters as much as the current ratio.
The final quality check: pull GeminIQ's pre-calculated Altman Z-Score for each name. Remove candidates scoring below 1.8 from the initial list or flag them for a separate, explicit solvency analysis before assigning any position size.
Net-Net and the Broader Value Toolkit
Net-net investing sits at the most extreme end of the asset-value spectrum in quantitative value investing. Understanding how it relates to adjacent strategies clarifies when to use it and how to construct a diversified value portfolio around it.
Joel Greenblatt's Magic Formula, which GeminIQ's Stock Screener supports directly, ranks companies on Return on Invested Capital and earnings yield — two measures of operational quality and earnings-based cheapness. A Magic Formula company might trade at P/B 4× or 6× and still appear on the screen because its returns on capital are exceptional. Net-net companies will almost never appear in that list. Their ROIC is often negligible or negative, which is precisely why they are trading below liquid asset value. The two strategies do not compete — they occupy completely different parts of the valuation universe. See our Magic Formula investing guide for how that strategy complements net-net in a diversified value approach.
The Piotroski F-Score is more naturally paired with net-net analysis. Piotroski's original research applied his nine-signal scoring framework specifically within the universe of low price-to-book stocks — the same starting population where net-nets are found. A high Piotroski score on a net-net candidate means the company's fundamentals are stabilizing or improving rather than deteriorating, which shifts it toward the one-third that recovers rather than the one-third that continues to decline. Running both filters simultaneously is one of the more disciplined modern implementations of Graham's approach. See our post on the Piotroski F-Score as a value trap detector for a full breakdown of how the scoring framework works within a value screen.
The consistent thread across all of these strategies is that data quality determines whether the signal is real. Net-net investing, more than any other quantitative approach, requires current asset and liability figures that match the actual filing — not a normalized template that smooths over the sub-components where the real information lives. That is not a technical footnote. It is the edge.
Research Faster. Invest Smarter.
Most financial websites rely on third-party aggregators that simplify or process data before you ever see it. We built GeminIQ because we believe you deserve a better fundamental analysis tool—one that goes beyond basic price charts and processed numbers. We extract our data directly from SEC 10-K and 10-Q filings to ensure that when you look at a balance sheet or a cash flow statement, you are seeing the numbers exactly how the company reported them. Our goal is to give you the tools to verify the narrative for yourself using clean, traceable data. Start researching now at GeminIQ.com.
Disclaimer: The content in this blog is for educational and entertainment purposes only and does not constitute financial, legal, or tax advice. Investing involves risk, including the loss of principal. The views expressed are my own and not intended as financial advice or a guarantee of future performance.