Newmont (NEM) Q3 2026 Earnings: EPS Up 41%, Ounces Down 8%

By Chad Hartman
Published · Last updated
Newmont (NEM) reported Q3 FY2026 revenue of $6.36 billion (+15.2% year over year) and diluted EPS of $2.35 (+40.7%) for the quarter ended September 30, 2026, in an 8-K earnings release on October 22, 2026 and a 10-Q filed the same day. Gold ounces sold fell 8.2% to 1.21 million, so the revenue growth came entirely from a realized gold price of $4,317 an ounce, up 22%. Beneath the release's record adjusted earnings, operating cash flow fell 5.3% from Q2 as working capital absorbed $565 million, and the lower 2026 cost guidance rests on higher by-product credits, not lower costs.
| Field | Value |
|---|---|
| Company | Newmont ($NEM) |
| Quarter | Q3 FY2026, period ended September 30, 2026 |
| Earnings release | October 22, 2026 (Form 8-K) |
| 10-Q filed | October 22, 2026 |
| Revenue | $6.36 Billion (+15.2% YoY) |
| Diluted EPS | $2.35 (+40.7% YoY) |
| Operating margin | 50.4% (+5.1 pts YoY) |
| Operating cash flow (TTM) | $13.10 Billion |
| Gold ounces sold | 1.21 million oz (-8.2% YoY) |
Newmont Q3 2026 Revenue, EPS and Margins
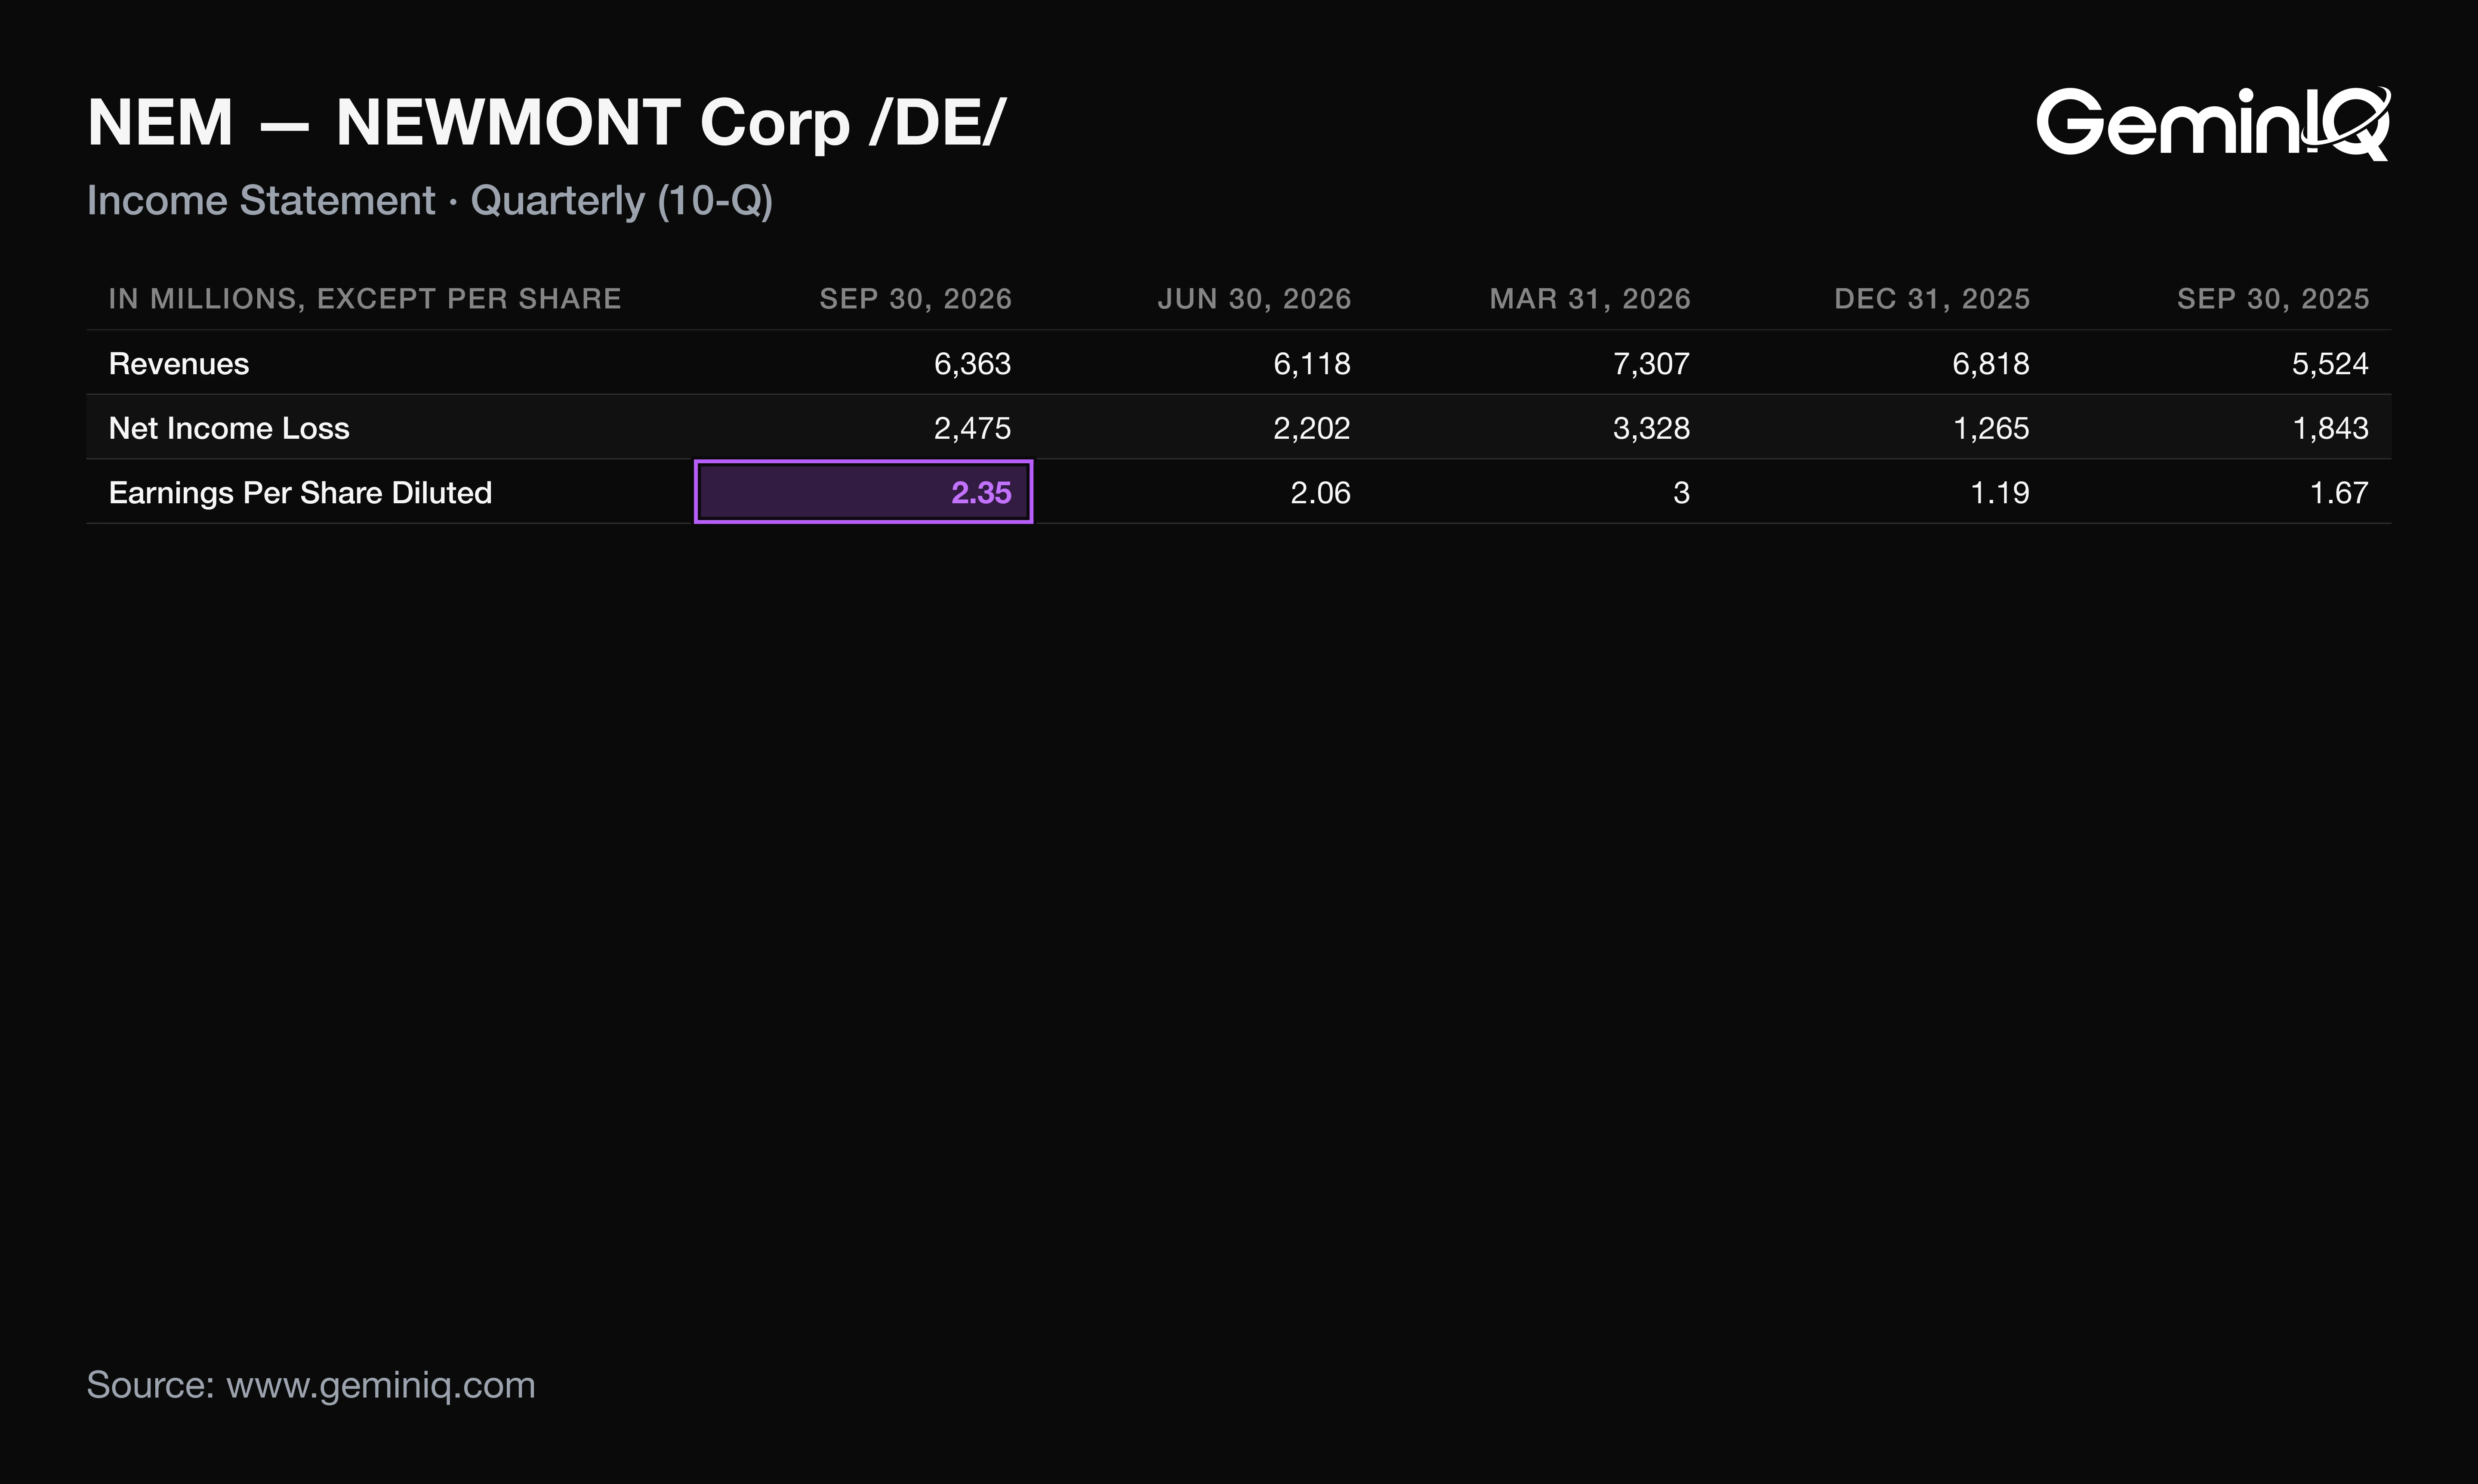
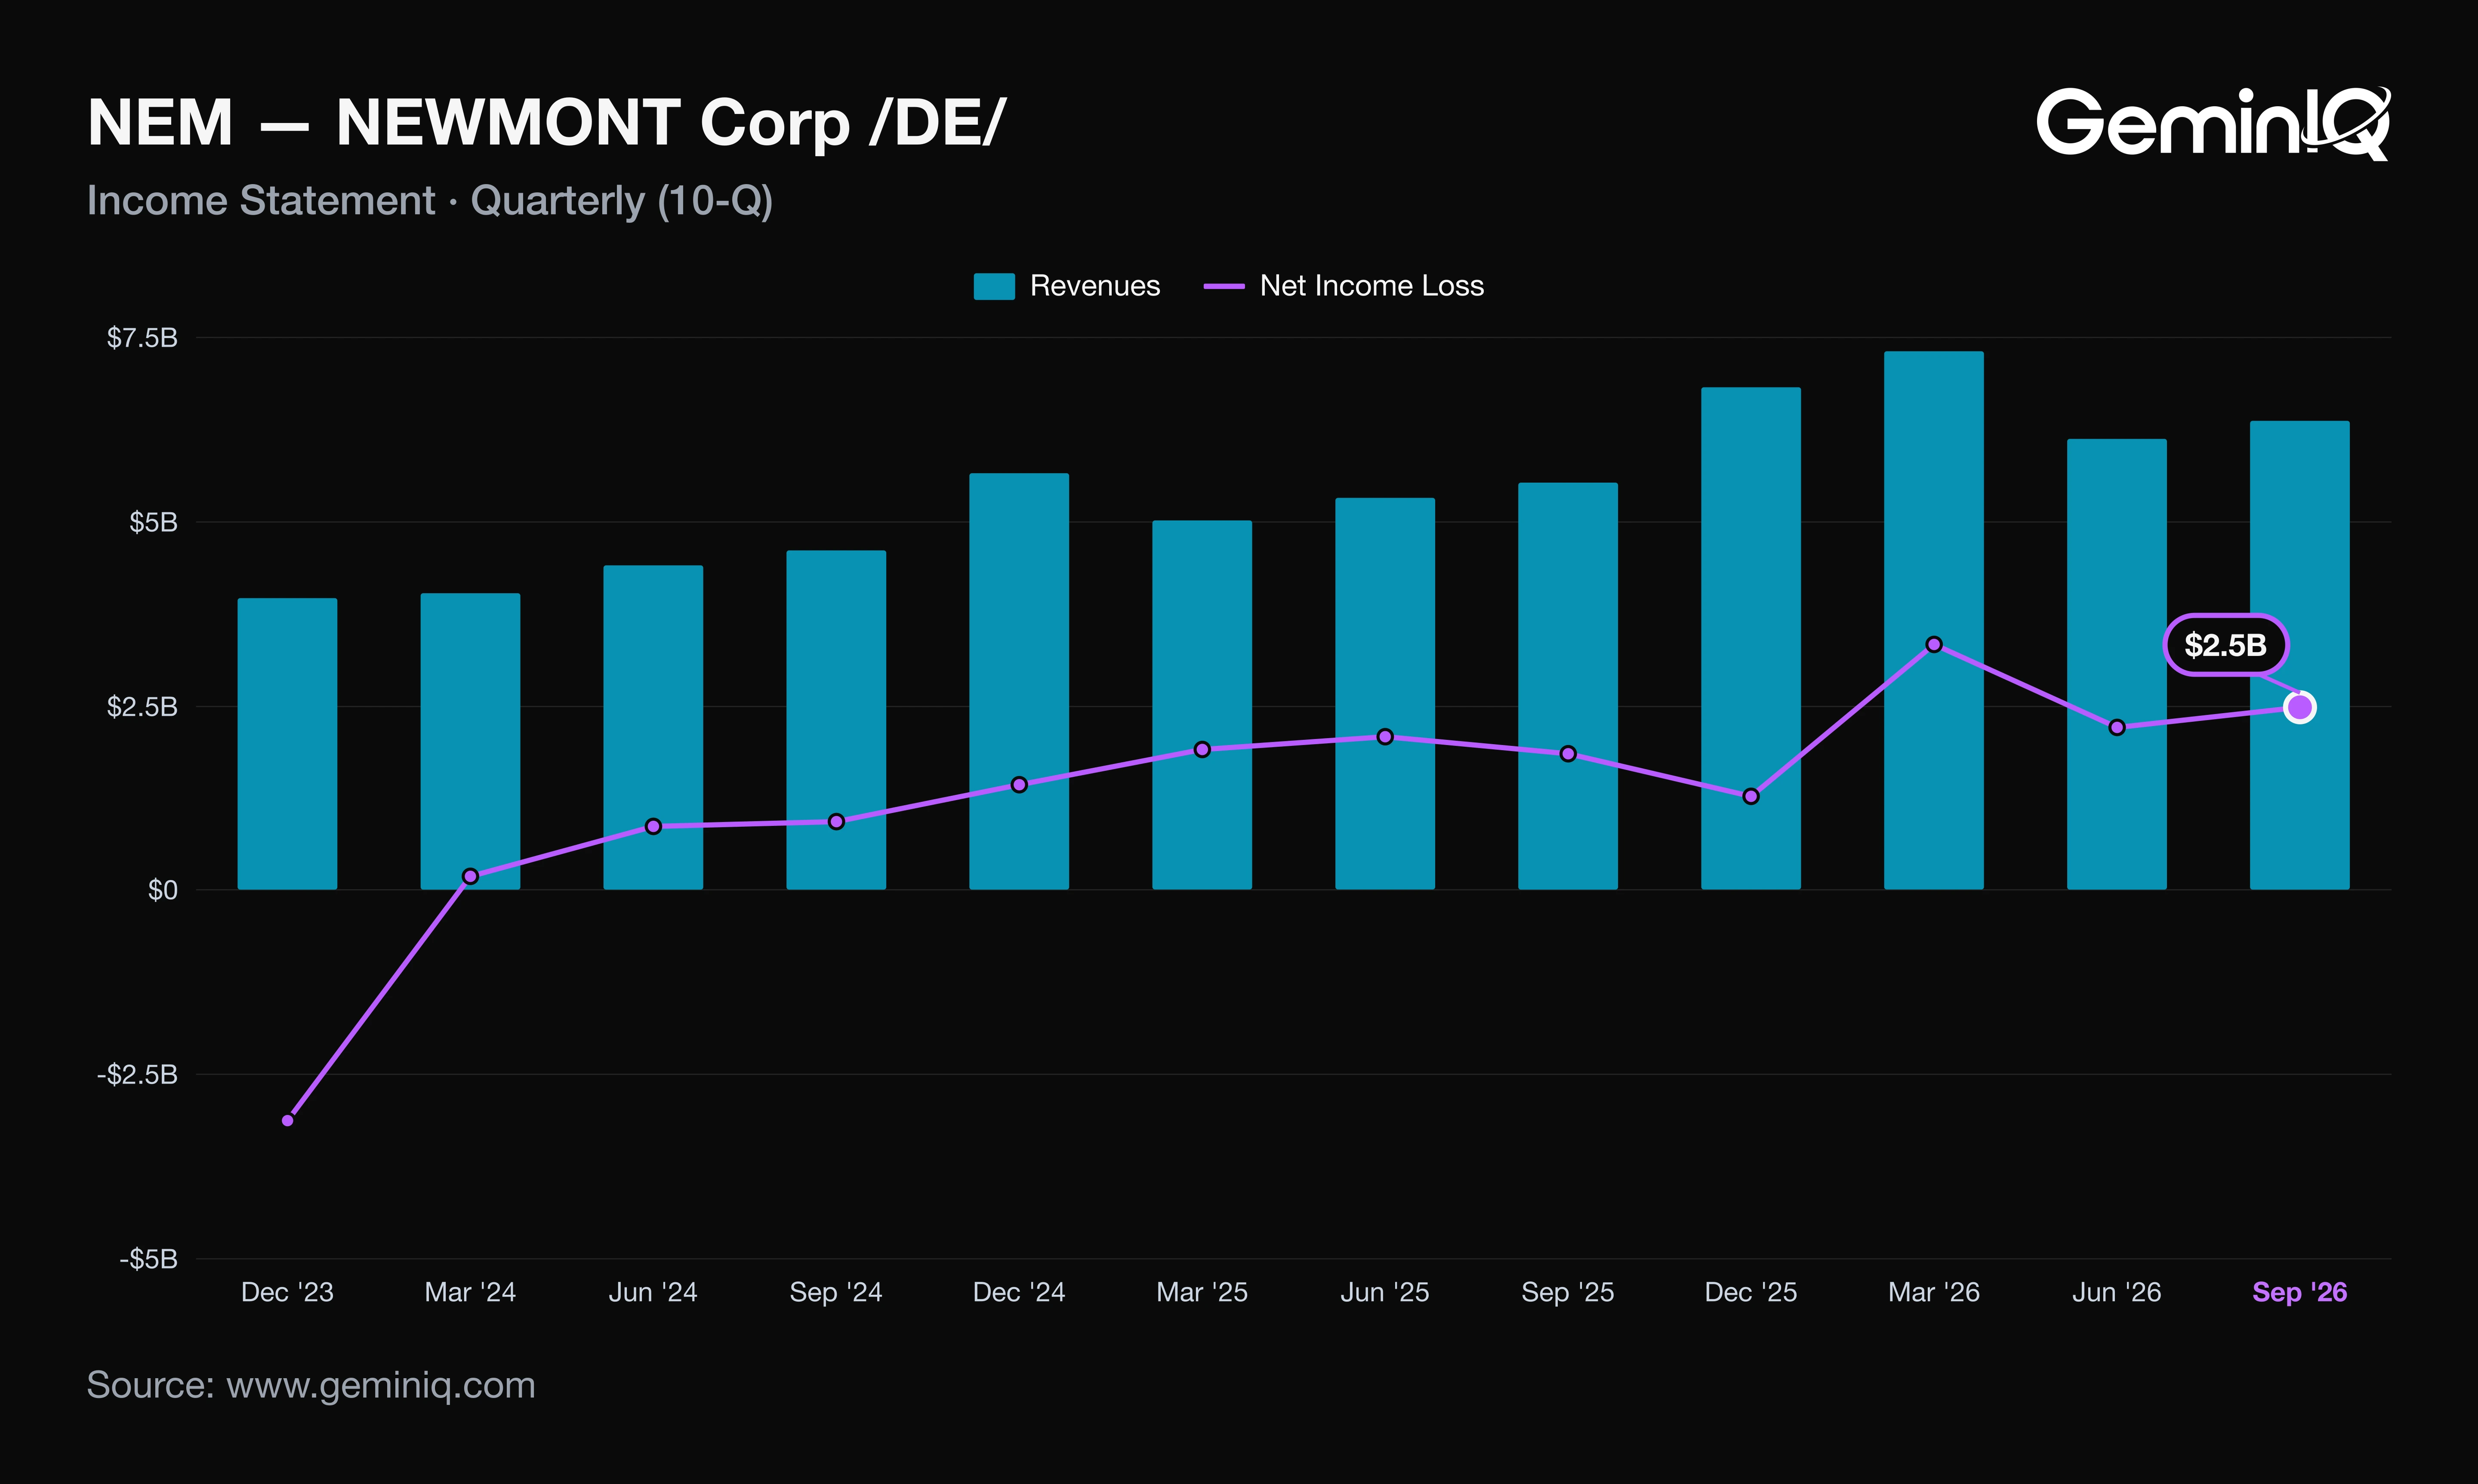
Newmont's Q3 2026 revenue was $6.36 billion, up 15.2% from $5.52 billion a year earlier and the third-highest of the last 16 quarters. Diluted EPS of $2.35 rose 40.7%, the second-highest of the last 16, and both gains trace to the gold price rather than to more metal.
A reader who sees revenue up 15% would expect ounces sold to have risen too. Instead gold ounces sold fell from 1,319 thousand to 1,211 thousand.
The Data: The 10-Q's sales bridge shows gold sales up $559 million: $934 million from realized price, offset by $383 million lost to volume. The price effect alone exceeds the $839 million total revenue increase; silver added another $257 million. Operating income grew 28.0%, net income 34.3% and EPS 40.7%.
Why: Revenue is price times volume, and volume went the wrong way. Below the operating line, a lower effective tax rate (26%, from 31%) and other items added about five points of EPS growth, and a 4.5% smaller diluted share count (1,051 million shares) added about five more. At the year-ago tax rate, diluted EPS would have been near $2.19. The 8-K's sensitivity table puts a $100 move in gold at $505 million of revenue and cost impact, so the margin rests on a price the company does not set.
What Newmont's 10-Q Shows Beyond the Press Release
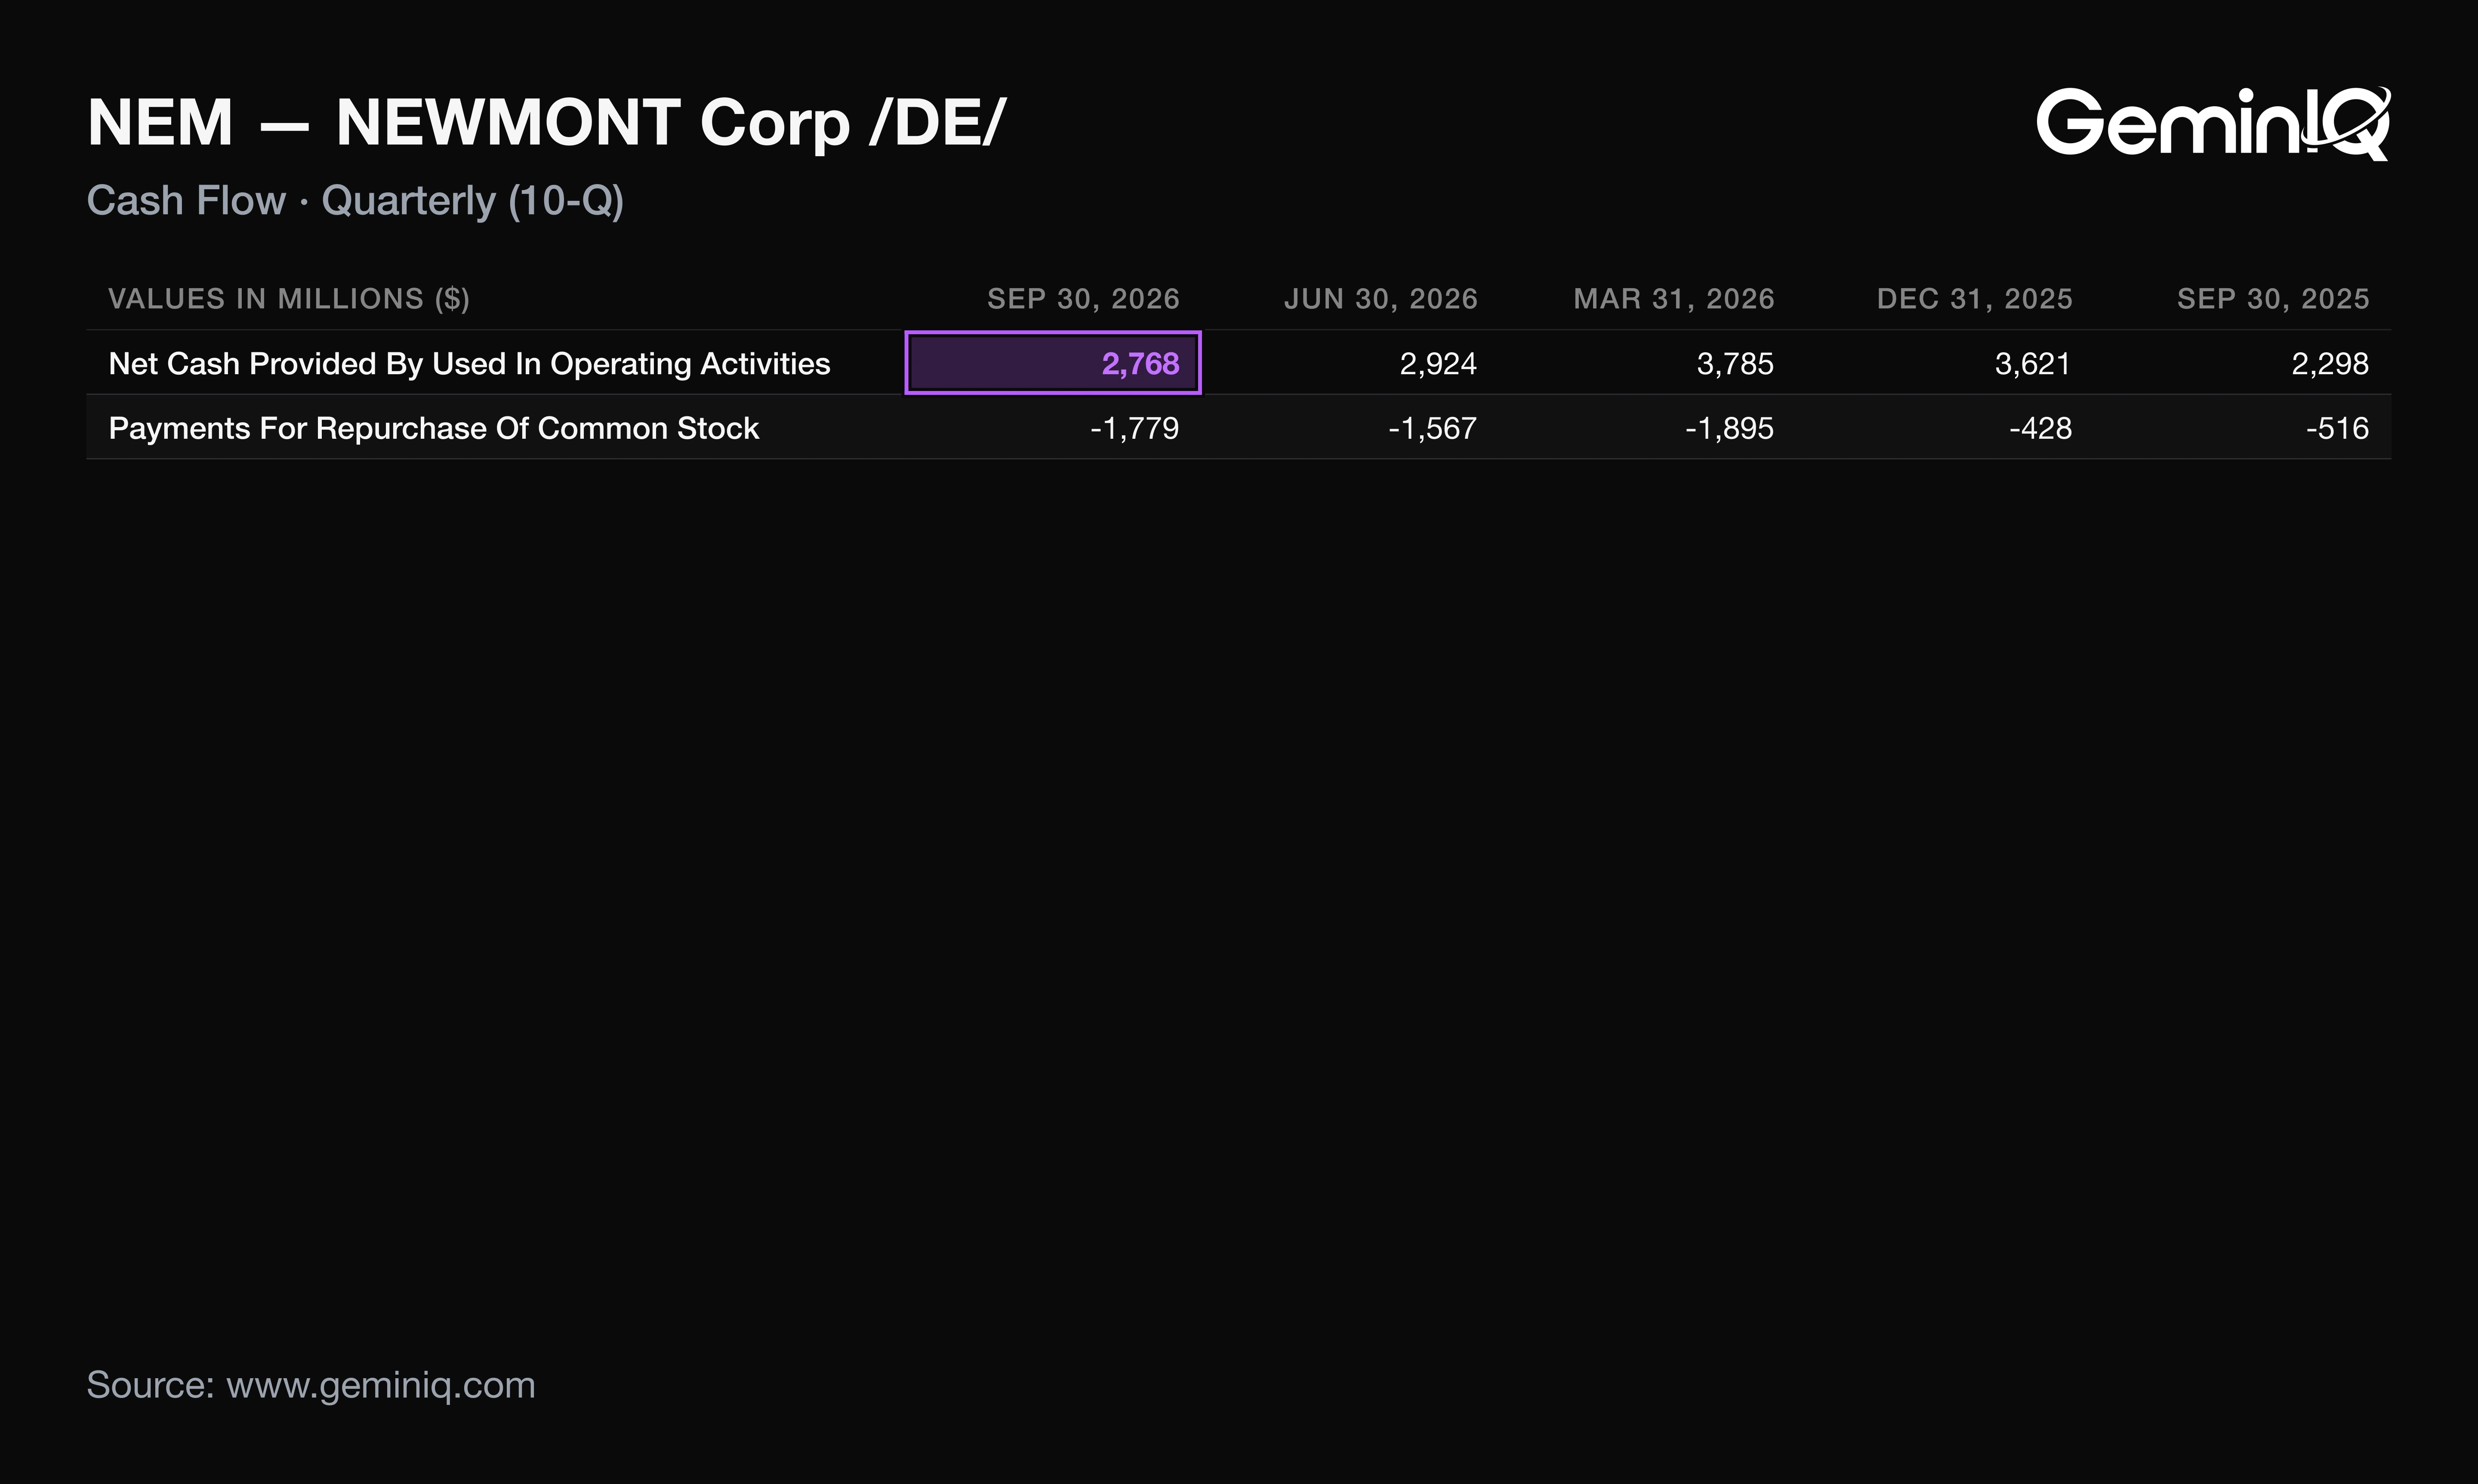
Newmont's Q3 2026 operating cash flow was $2.77 billion, down 5.3% from $2.92 billion in Q2 and up 20.5% from a year earlier. The 8-K led with record third-quarter adjusted net income and free cash flow of $1.9 billion; the cash flow statement shows cash trailing earnings. The gap is in cash.
The Data: Operating cash flow was 112% of net income, against 133% in Q2 and 125% a year earlier (derived from the filed rows). The 8-K's non-GAAP cash from operations before working capital rose 11% to $3.33 billion, so the decline sits below that line: working capital took $565 million in Q3 after $90 million in Q2, including $318 million of unfavorable receivables movement and $256 million of reclamation spending. Cash capital expenditure rose 19.1% to $856 million, leaving free cash flow of $1.91 billion, down 13.3% from Q2 but the fourth-highest of the last 16 quarters.
Why: The company attributes the receivables build to production, shipment and collection timing. Its Q2 8-K said Q2's favorable receivable and payable movements "may partially reverse"; Q3 is that reversal, and the Q3 8-K says this quarter's unfavorable movements may partially reverse in turn. The 8-K's 2027 indications warn that higher cash tax payments on accrued liabilities may weigh on free cash flow if gold stabilizes. A deferred tax payment is a cost that arrives later.
Newmont Q3 2026 Free Cash Flow, Buybacks and Net Cash
Newmont ended Q3 2026 with $8.8 billion of cash and a net cash position of $3.2 billion, per the 8-K, and GeminIQ's pre-calculated Net Debt to EBITDA was -0.22x on a trailing basis. That balance is spoken for before Q4 opens.
The Data: The 10-Q states Newmont will contribute $1.95 billion in cash to Nevada Gold Mines within 30 days of the Fourmile contribution, expected in Q4, and the 8-K says the cash and net cash figures are before that payment. Add roughly $451 million of October share repurchases from the 8-K, and net cash falls to about $0.8 billion before Q4 cash flow (derived), against the company's stated $1 billion net cash target. Dividends paid were $272 million, the lowest of the last 16 quarters.
Why: The capital allocation framework fixes the dividend at $1.1 billion a year and lets repurchases raise it per share, so the dollar payout drifts down as shares fall. The 8-K counts over 115 million fewer shares since February 2024. Buybacks, not the dividend, are the flexible claim on cash.
Newmont's 2026 Guidance After Q3
Newmont's 8-K lowered 2026 gold by-product AISC guidance to $1,520 an ounce from $1,680 in July, and by-product CAS to $925 from $1,055. The company credits cost discipline and higher co-product pricing; its own reconciliation assigns the whole change to one line.
The Data: In the AISC reconciliation, cost applicable to sales ($8,610 million) and sustaining capital ($1,950 million) are identical in the July and October tables. Only consolidated other metal sales, which are subtracted, rose from $3,400 million to $4,180 million. That $780 million equals the entire fall in total AISC, from $8,230 million to $7,450 million.
Why: By-product accounting nets silver, copper, lead and zinc revenue against gold costs, so a higher metal price lowers guided unit cost without any cost falling. The Q4 guide shows the effect reversing: AISC of $1,900 an ounce, against $1,454 in Q3, with sustaining capital of $600 million and Peñasquito silver expected at about half its Q3 volume. The lower full-year guide is delivered by the first nine months; guided Q4 AISC sits above both Q3 and Q2's $1,621.
How NEM Stock Has Moved After Past Earnings Reports
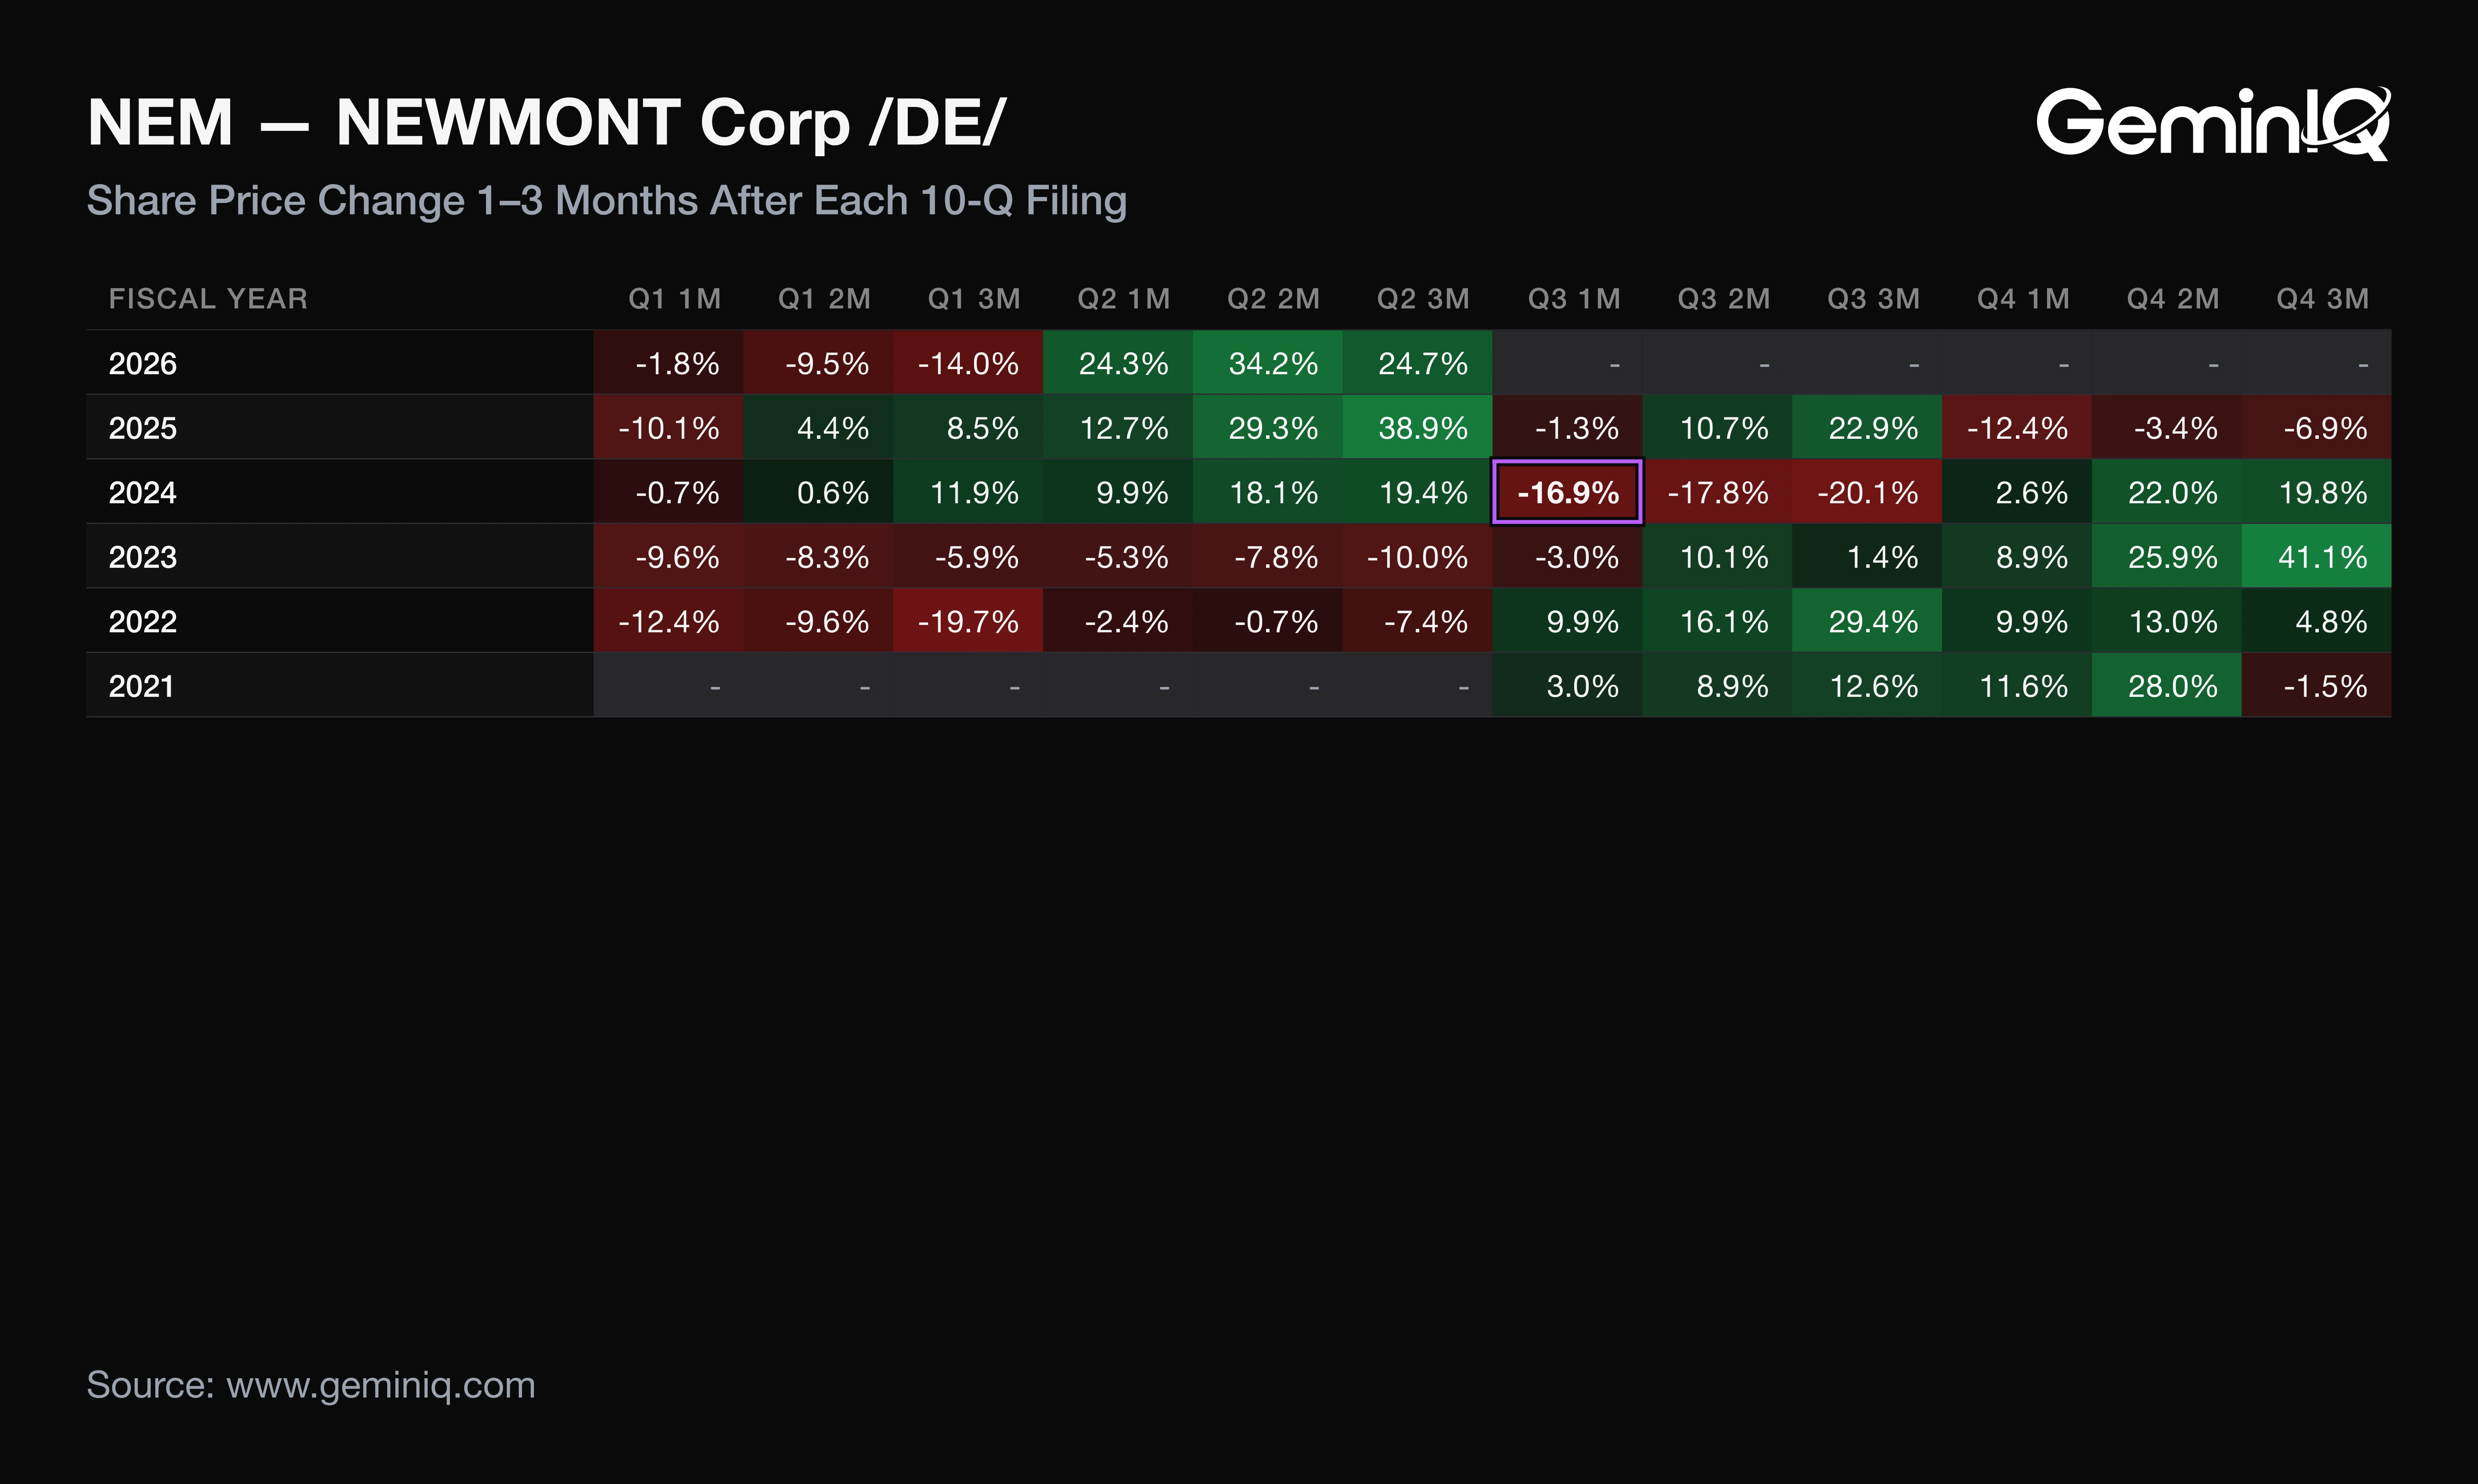
Across NEM's last 12 10-Q filings with completed windows (October 2023 to July 2026), the median one-month cumulative return was -1.0%, positive after 5 of 12, and the median three-month return was +15.6%, positive after 9 of 12. These figures describe how Newmont's stock moved after its past filings; they are a historical association, not a forecast. The Q3 FY2026 window has not yet elapsed.
The Data: One-month returns after the last three Q3 filings were -3.0%, -16.9% and -1.3%, and the three-month returns were +1.4%, -20.1% and +22.9%. The -16.9% after the FY2024 Q3 filing is the weakest one-month figure of the 12. Gains in this record arrived after the first month, not in it.
Why: Three Q3 observations cannot establish a seasonal pattern. The 12-filing distribution is the usable yardstick: the median three-month return sits more than 15 points above the one-month median. See GeminIQ's Earnings Reaction Heat Maps for the full grid.
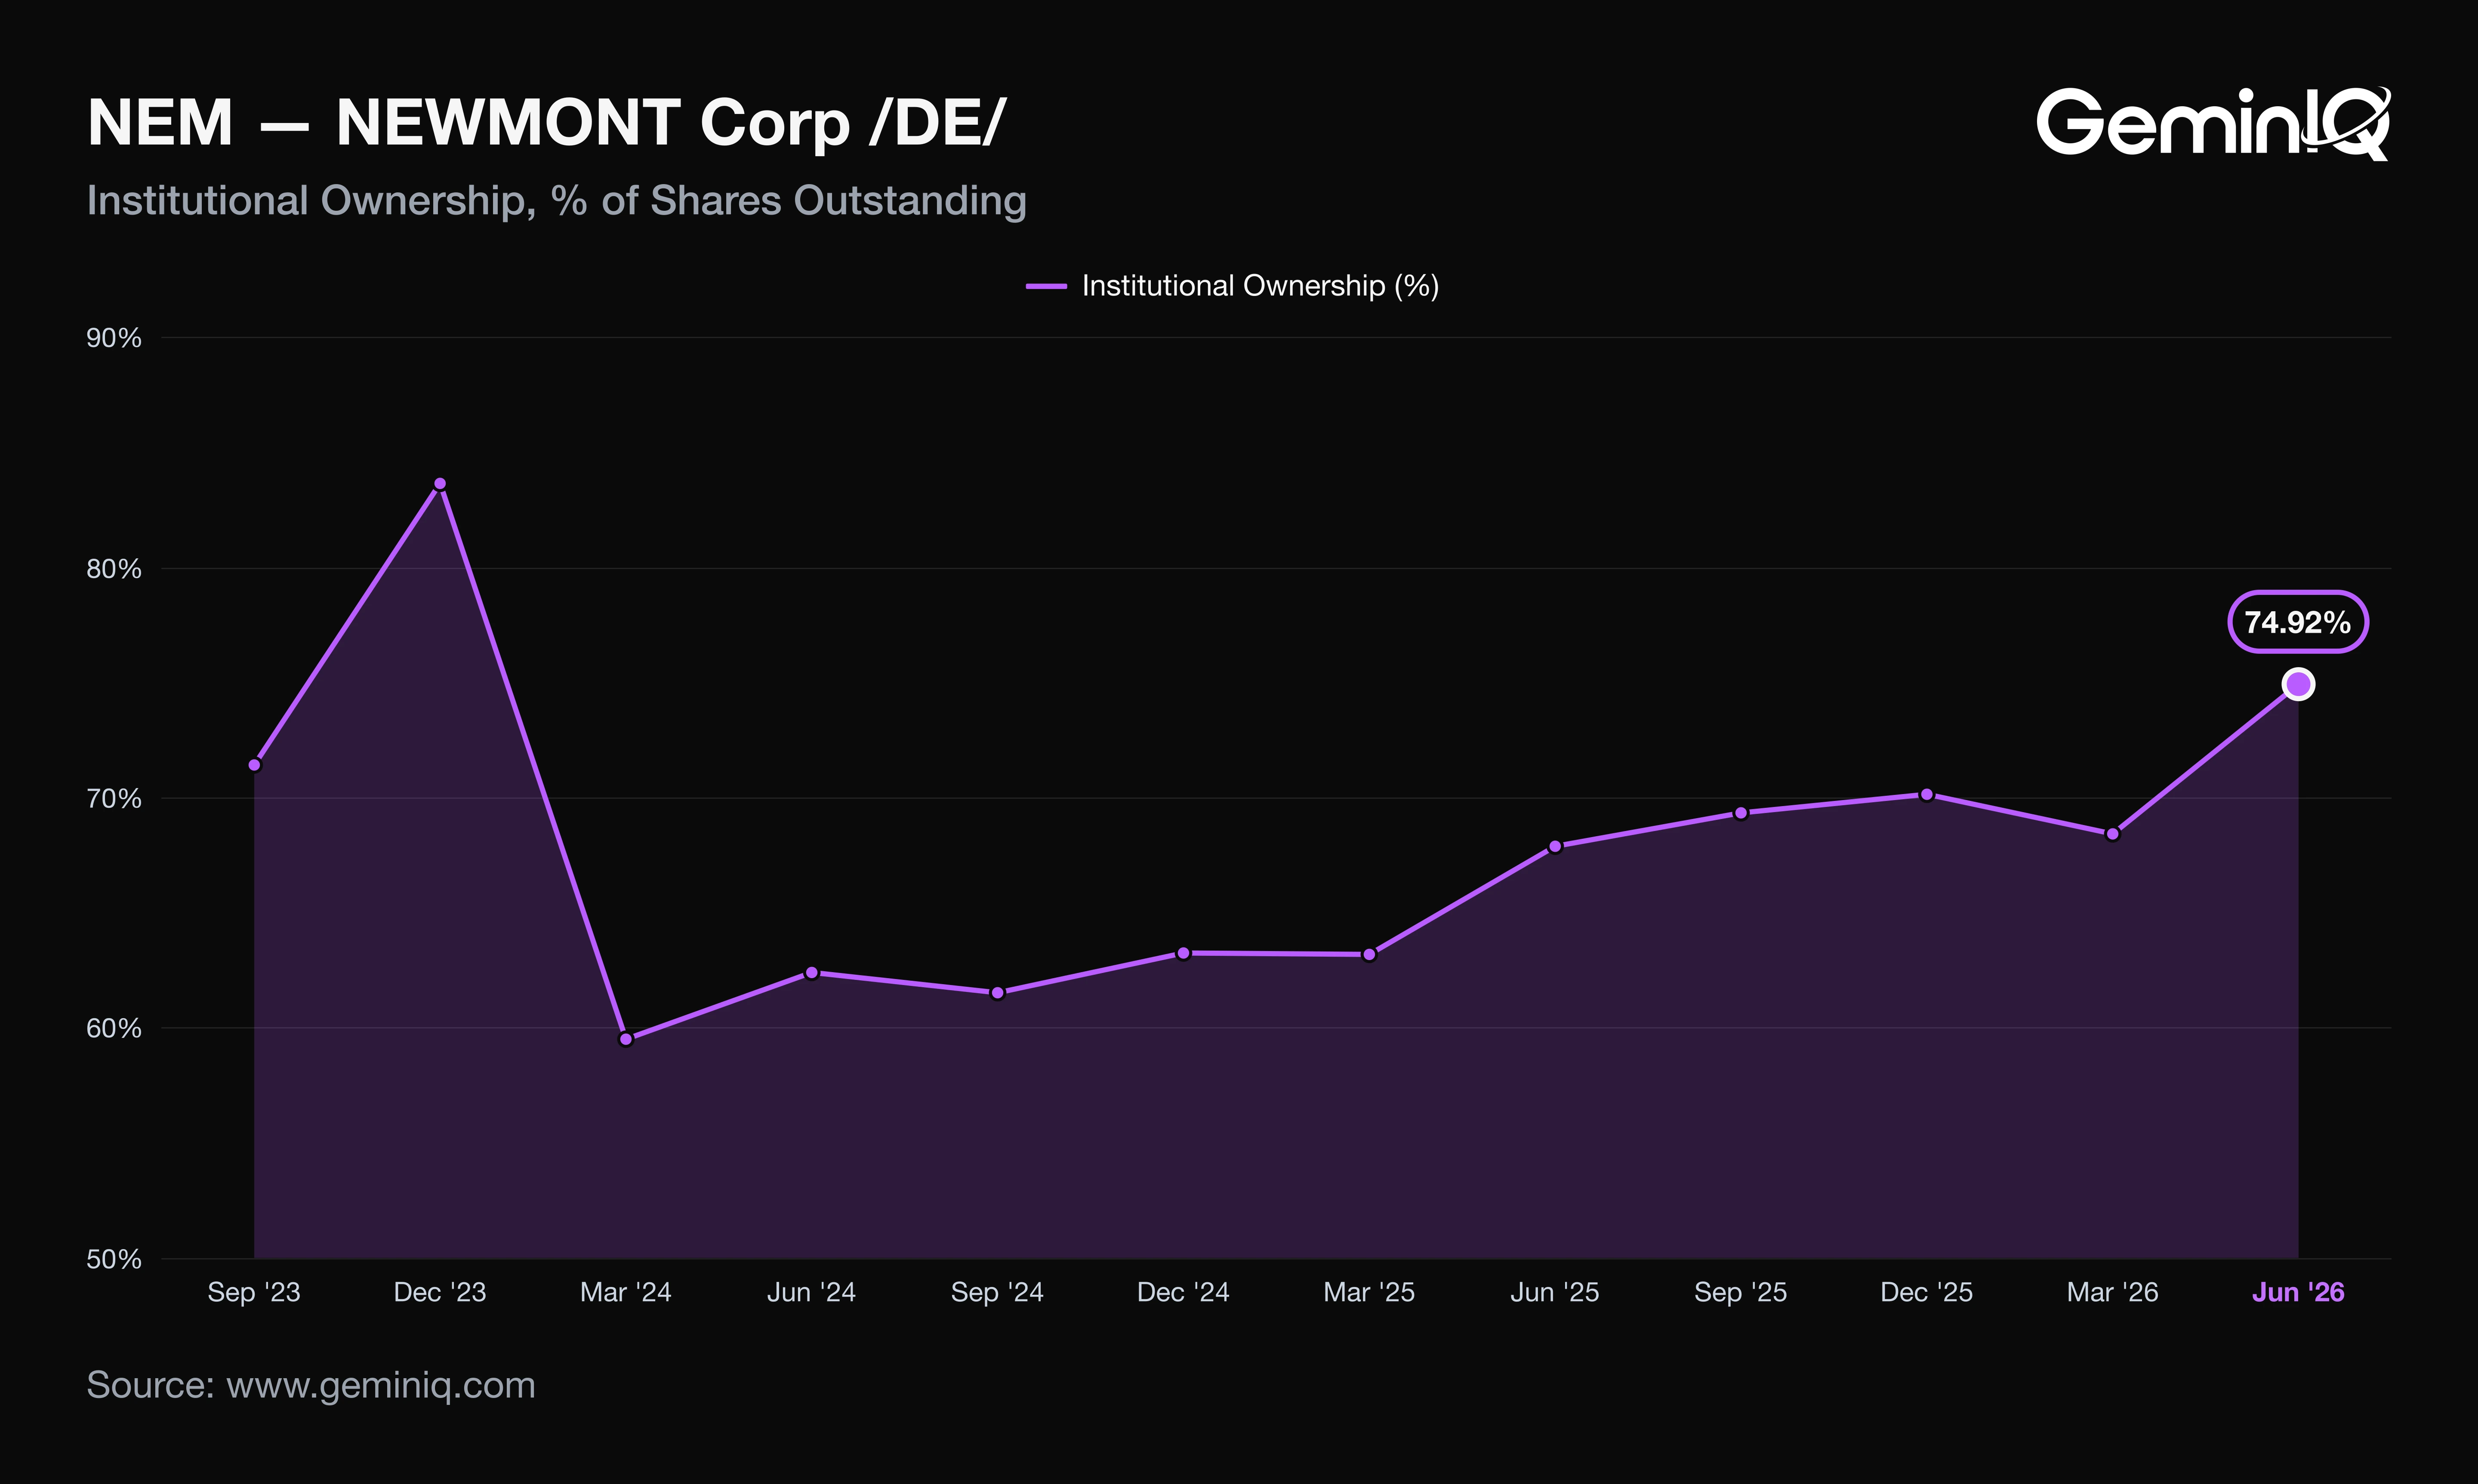
For ownership, GeminIQ's 13F institutional holdings show institutions held 74.92% of Newmont at June 30, 2026, up 7.04 points from 67.88% a year earlier and the third-highest of the last 16 quarter ends. The September 30 quarter had not yet been filed. GeminIQ's Form 4 data, filed through September 1, 2026, shows 25 insider sales totaling $12.8 million over the prior twelve months and no purchases, the last of which was on November 27, 2024.
A commodity producer's record margin is a reading of the metal price until the volume and unit-cost lines show otherwise, so the first check on any such quarter is which of the two moved.
Frequently Asked Questions
Is Newmont doing well financially?
Newmont's trailing-twelve-month results through Q3 2026 show GeminIQ's pre-calculated Operating Profit Margin of 52.76%, up 5.56 points, and Net Profit Margin of 34.84%, up 1.16 points. Return on Invested Capital (ROIC) was 27.80% against 21.29% a year earlier, and the Current Ratio was 2.45x.
When does Newmont report earnings?
Newmont reported Q3 2026 results on October 22, 2026 and filed its 10-Q the same day. Last year it filed its Q3 10-Q on October 23, 2025 and its fourth-quarter results on February 19, 2026. That is a filing pattern, not a forecast of the next date.
Does Newmont pay a dividend?
Yes. Newmont declared $0.26 per share for Q3 2026, payable December 21, 2026 to holders of record on November 25, 2026, per the 8-K. It paid $272 million in Q3 and $1.10 billion over the trailing twelve months, 1.2% less than a year earlier. The 8-K calls the indicated $1.04 annualized per-share figure non-binding.
Where can I verify Newmont's Q3 2026 figures?
Newmont's Q3 2026 10-Q (accession 0001164727-26-000043) is on EDGAR at sec.gov, and the Exhibit 99.1 earnings release is at sec.gov.
Wall Street's data. Main Street's price.
Institutional terminals charge thousands a year for as-filed accuracy. GeminIQ gives you the same thing for a fraction of the cost: financials built directly from raw SEC EDGAR filings, not third-party APIs, with full XBRL traceability back to the original 10-K or 10-Q. No normalized guesswork, just calculated metrics, charts, screeners, and watchlists built on numbers exactly as the company reported them. Start researching now at GeminIQ.com.
All financial figures cited in this article reference NEWMONT CORPORATION's Q3 2026 10-Q (filed October 22, 2026, period ending September 30, 2026), with guidance and management commentary drawn from the company's Form 8-K earnings release (filed October 22, 2026). All SEC filings are publicly available at SEC EDGAR and SEC EDGAR.
Disclaimer: The content in this blog is for educational and entertainment purposes only and does not constitute financial, legal, or tax advice. Investing involves risk, including the loss of principal. The views expressed are my own and not intended as financial advice or a guarantee of future performance.